How much do fabs spend annually on water on average depends on UPW capacity and the local utility rate. Semiconductor UPW system cost for 300mm fab projects usually lands between $2M–$20M in CAPEX and $12–$30 per 1,000 gallons in OPEX. A 300mm line using about 3 million gallons per day can see annual OPEX above $10M. Energy is 40–50% of that OPEX, and membrane replacement is 20–30%.
Semiconductor UPW System Cost for 300mm Fab
A standard 300mm fab UPW train usually costs $8M–$15M in CAPEX and $15–$25 per 1,000 gallons in OPEX. At about 3 million gallons per day, annual operating spend can exceed $10M. Energy takes 40–50% of OPEX. Membrane replacement takes 20–30%, and plants we size for a first ramp often land at the lower end of that band.
Semiconductor UPW system costs typically range from $2M to $20M in CAPEX, with OPEX at $12–$30 per 1,000 gallons. A 300mm fab using about 3 million gallons per day can face annual OPEX above $10M. Energy often takes 40–50% of OPEX, while membrane replacement takes 20–30%. Modular design, automation, and recycling can cut OPEX by 15–25% over a multi-year horizon.
Advanced process nodes and tighter purity limits push both capital and operating spend higher. Modern fabs consume between 2 and 4 million gallons of ultrapure water daily. According to SEMI 2024 data, nodes at 3nm and below need 30–50% more water per wafer than legacy 28nm processes. That volume growth raises infrastructure investment and the recurring plant bill.
Stricter quality targets also lift CAPEX. Dissolved silica below 0.3 ppb and TOC under 1 ppb now guide advanced chip lines. Meeting those limits usually means multi-stage reverse osmosis plus high-intensity UV oxidation. Field data from HydropureWater in 2025 shows new UPW CAPEX up 20–40% versus systems built five years earlier.
According to the SEMI standards store, the current revision is SEMI F63-1224. The guide covers line widths of 32 nm and smaller and is used with SEMI F61 and SEMI F75. Spec detail sits with the semi f63 owner page rather than this cost brief.
Energy use for UPW production has risen by about 15% since 2020. Higher electricity prices and higher membrane feed pressures both contribute. High-pressure pumps and UV units typically account for 40–50% of total OPEX. A 300mm fab in Taiwan reported a 22% UPW OPEX rise in 2023 after tariff and specialty membrane cost increases.
Water scarcity in hubs such as Arizona, Israel, and Taiwan pushes recycling and zero-liquid-discharge designs. Those loops can lower raw intake cost per gallon. They also add plant complexity and energy intensity for facility directors who track how much do fabs spend annually on water on average across full utility budgets.
How Much Do Fabs Spend Annually on Water on Average?
Annual water spend for a fab covers more than the UPW polish loop. According to the IEEE IRDS 2024 facilities chapter, a typical 300 mm site splits water into process use at 48%, cooling towers at 23%, abatement at 20%, and UPW treatment losses at 9%. That ratio moves with process mix and climate. Cooling towers are the single largest water loss on the site.
Carollo Engineers, citing IEEE, put average freshwater demand at 5–10 million gallons per day for one fab. That freshwater band sits above the 2–4 million gallons per day of UPW used in many lines, because cooling and scrubbers sit outside the polish loop. Micron’s Clay, New York campus is forecast at about 50 million gallons per day for four fabs at full buildout. All freshwater users in Syracuse withdraw about 40 million gallons per day today, according to the same review.
An Idaho National Laboratory whitepaper states a wider UPW draw of 5–10 million gallons per day. The same whitepaper states about 1,500 gallons of municipal water per 1,000 gallons of UPW. This cost model keeps the 2–4 million gallon daily UPW band, and the 3 million gallon per day case, as the budgeting basis. Use the laboratory range when the scope is whole-fab UPW production rather than one 300mm module.
The whitepaper also reports that TSMC’s Phoenix fab plans to reclaim about 65% of its water on site. That 65% figure sits inside the 50–70% recovery band used later in this brief. Plants we size in a drought year treat the lower recovery number as the permit case, not the brochure case.
According to Carollo Engineers, 38% of 108 existing and announced U.S. fab sites in 2023 sat in high or extremely high water stress. The classes come from the World Resources Institute. Those sites treat recovery CAPEX as a permit item, not as an optional add-on. An advanced-node chip now takes beyond 4,000 process steps, so rinse counts tend to rise as the node tightens.
Carollo Engineers also report that almost all major chip makers have at least one campus operating or installing end-of-pipe zero-liquid-discharge treatment. The same review says a large campus can discharge well over 100,000 pounds of total dissolved solids per day. That salt load is why brine equipment shows up on advanced-node capital sheets.
Ultrapure water system capex and opex breakdown
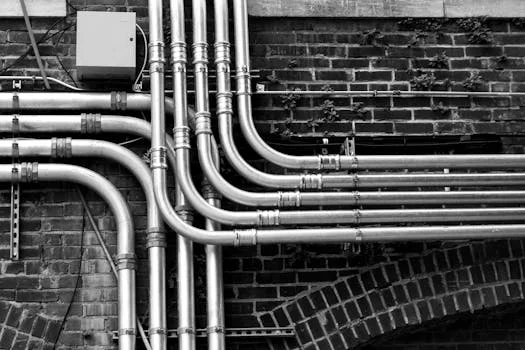
An ultrapure water capital budget usually runs from $2M for a small 200mm line to more than $20M for a large 300mm fab with advanced recovery. That spend covers core equipment, PVDF high-purity piping, automated controls, and commissioning to the purity target. Most plants we bid separate the installed train from the first-year spare set so the opening check is not hiding membranes.
OPEX is more volatile and typically falls between $12 and $30 per 1,000 gallons produced. Local power price, raw water quality, and technology stack efficiency set the range. Engineers often amortize plant CAPEX over a 15–20 year life. RO membranes, UV lamps, and EDI modules still need replacement every 3 to 5 years.
Higher upfront spend on efficient pumps, automation, and EDI can cut chemical and energy use. That path often yields a 15–25% OPEX drop over five years. A municipal plant view of capex and opex uses a different boundary and should not be pasted onto a fab UPW quote.
Related industrial cost logic appears when exploring cost breakdowns for high-salinity wastewater treatment, because stronger pre-treatment lowers stress on downstream UPW stages. Parallel fab discharge economics are covered in the wafer fab wastewater treatment cost breakdown.
| Cost Category | Estimated Range (2025) | % of Total Lifecycle Cost | Primary Drivers |
|---|---|---|---|
| CAPEX (Equipment & Install) | $2M – $20M | 30–40% | System capacity, node technology, piping material |
| Energy (OPEX) | $4.80 – $15.00 / 1k gal | 40–50% of OPEX | Pump efficiency, UV intensity, RO pressure |
| Chemicals & Consumables | $1.80 – $6.00 / 1k gal | 15–20% of OPEX | Resin regeneration, antiscalants, pH adjustment |
| Maintenance & Labor | $2.40 – $9.00 / 1k gal | 30–40% of OPEX | Membrane life, UV lamp replacement, automation level |
The lifecycle table prices energy at $4.80 – $15.00 / 1k gal when energy is 40–50% of OPEX. The later 3M GPD table prices electricity at $6.50 – $12.00 per 1,000 gallons for that named volume. Use the volume table when the fab sits near 3 million gallons per day. Use the wider band when the power tariff or recovery ratio is still unknown.
CAPEX Breakdown: What Drives Semiconductor UPW System Costs?
Capital cost follows the stack needed to reach 18.2 MΩ·cm resistivity. Pre-treatment is the first major line item, often $200K to $1M. Multimedia filtration and coagulation remove suspended solids before membranes. High organics or minerals in the raw source raise this stage cost to protect later membranes from fouling.
The RO core typically costs $500K to $3M. Large fabs often add energy recovery devices and high-efficiency pumps, lifting initial cost by 20–30% while protecting OPEX. HydropureWater’s industrial RO systems for semiconductor UPW pre-treatment are frequently set as two-pass trains to feed polishing stages with stable quality. Broader process design notes appear in semiconductor high-purity water treatment engineering specs.
Choosing EDI versus mixed-bed ion exchange is a major CAPEX fork. EDI usually costs 30–50% more upfront, yet removes hazardous chemical regeneration systems and shrinks safety infrastructure. UV sterilization and TOC reduction add another $300K to $1.5M when 185nm lamps are required for trace organics control. Plants we commission usually spend that UV money once the TOC spec is under 1 ppb, not before.
Distribution and automation close the capital budget. PVDF piping is standard for purity retention, and loop install often runs $500K to $2M by distance to point of use. SCADA plus real-time TOC analyzers commonly add $200K to $1M so the plant can correct quality swings without manual delay.
| UPW Sub-System | Typical CAPEX (300mm Fab) | Key Technology Options |
|---|---|---|
| Pre-treatment | $500K – $1.2M | Ultrafiltration (UF), Multimedia, Carbon |
| Primary Purification | $1.5M – $4M | Two-pass RO, Degasification |
| Polishing Loop | $1M – $3M | EDI, Mixed-bed, Ultra-filters |
| UV & TOC Reduction | $400K – $1.2M | 185nm/254nm UV lamps |
| Distribution & Piping | $1M – $2.5M | PVDF piping, VFD pumps |
| Monitoring & Control | $300K – $800K | Online TOC, Resistivity, Particle counters |
The prose band of $500K to $2M covers a short distribution loop. The 300mm table’s $1M – $2.5M band covers a longer PVDF run to point of use. Most plants we size for a multi-building fab land in the table, not the short-loop figure. Pre-treatment shows the same pattern: $200K to $1M for a light source, and $500K – $1.2M once the 300mm raw water needs ultrafiltration.
Readers who want the purity stack beside these dollars can use Semiconductor High-Purity Water Systems: 2026 Engineering Sp.
OPEX Deep Dive: Energy, Chemicals, and Maintenance Costs
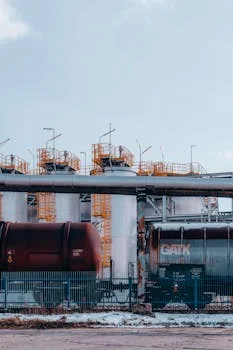
UPW operating cost is dominated by energy, which can near half of total OPEX. High-pressure RO pumps lead consumption, followed by continuous high-output UV duty. VFDs and high-efficiency motors can cut that energy load by 15–20% (HydropureWater field data, 2025). The IEEE IRDS 2024 facilities chapter treats water and energy as one problem, because purification and wastewater disposal both draw power.
Chemical spend typically sits at 15–20% of OPEX. Antiscalants protect RO membranes, while acids and caustics hold pH. HydropureWater’s PLC-controlled chemical dosing systems for UPW pH adjustment support precise titration and limit waste. Moving to EDI can cut resin regeneration chemicals by up to 80% versus conventional ion exchange beds.
Maintenance and consumables fill the remaining 30–40%. RO membranes usually last 3–5 years, and EDI modules can last 5–7 years with strong pre-treatment. UV lamps need replacement every 12 to 18 months to keep TOC performance. Hybrid ZLD recovery of 50–70% water raises energy use yet can shrink raw water purchase cost in scarce regions.
| OPEX Item | Cost per 1,000 Gallons | Annual Cost (3M GPD Fab) | Optimization Strategy |
|---|---|---|---|
| Electricity | $6.50 – $12.00 | $7.1M – $13.1M | VFDs, Energy Recovery Devices |
| Chemicals | $2.00 – $4.50 | $2.2M – $4.9M | Switch to EDI, automated dosing |
| Consumables | $3.00 – $7.00 | $3.3M – $7.6M | Predictive maintenance for membranes |
| Labor | $1.50 – $3.00 | $1.6M – $3.3M | Remote monitoring and SCADA |
Add the four annual rows at the low end and the 3M GPD case starts near $7.1M plus $2.2M plus $3.3M plus $1.6M. That stack is why a single line at 3 million gallons per day can clear $10M a year before anyone buys a spare membrane. Plants we audit usually find the electricity row first, because it moves every month with the tariff.
How Do You Estimate 20-Year Lifecycle Cost for an Ultrapure Water System?
Lifecycle cost ties CAPEX amortization to two decades of energy, chemicals, labor, and membrane swaps. Use the 15–20 year plant life already common in fab budgeting, then add 3–5 year replacement cycles for RO, UV, and EDI. A practical model multiplies OPEX per 1,000 gallons by annual volume, then adds planned CAPEX refresh. That view explains why early EDI or VFD spend can beat a low first-cost mixed-bed train.
Fab scale shifts the profile. Legacy 200mm plants often keep simpler trains and mixed-bed polish under milder purity tiers, with daily use often under 1 million gallons. Standard 300mm fabs need EDI and advanced UV oxidation at 2–4 million gallons per day. Advanced nodes below 3nm can add another 20% UPW cost for extra polishing and sub-ppb silica monitoring.
Location still matters. Arizona and Taiwan face higher OPEX under recycling mandates, so recovery CAPEX becomes mandatory. The IEEE IRDS 2024 representative 300 mm model treats Arizona as the stressed case because supply is limited, salinity is higher, and summer evaporation is high. Sites with cheaper power and abundant water, including parts of the Pacific Northwest or Northern Europe, can see 10–15% lower OPEX for the same configuration.
| Fab Type | Daily Usage (Gal) | Avg. CAPEX | Avg. OPEX / 1k Gal | Standard Technology |
|---|---|---|---|---|
| 200mm Legacy | 500K – 1M | $2M – $5M | $12 – $18 | RO + Mixed Bed |
| 300mm Standard | 2M – 4M | $8M – $15M | $15 – $25 | Two-pass RO + EDI + UV |
| Advanced Node (<3nm) | 3M – 5M | $15M – $20M | $20 – $30 | ZLD + High-end Polishing |
Six inputs should be frozen before a vendor prices that 20-year model.
- Volume at two loads: Price the ramp flow and the full-node flow, not only a flat 3 million gallons per day.
- Purity gate: Lock 18.2 MΩ·cm, TOC under 1 ppb, and dissolved silica below 0.3 ppb before the bid.
- Polish choice: Decide EDI versus mixed bed early. EDI is often 30–50% more in CAPEX.
- Power tariff: Energy is 40–50% of OPEX, so a wrong kilowatt-hour price wrecks the model.
- Recovery proof: Many expansions need about 70% recovery before the permit moves.
- Water boundary: Split UPW production from cooling and abatement, or the annual water spend is understated.
Which UPW System Designs Fit Semiconductor Fabs Under the US CHIPS Act?
CHIPS-era fab builds favor designs that scale in modules, prove water recovery, and protect yield from day one. Modular capacity deferral, two-pass RO, EDI polish, and VFD pumping are the common engineering answers. They match U.S. fab expansion schedules without locking full day-one CAPEX. Specs for resistivity, TOC, silica, particles, and bacteria still set the acceptance gate for 3 nm and 5 nm lines.
A semiconductor UPW system cost for 300mm fab case on a CHIPS-era schedule should still show modular capacity, two-pass RO, EDI, and VFD pumps. Purity and reliability protection come from online TOC, resistivity, and particle counters tied to automatic response. Yield protection often dominates ROI. Even a 1% wafer yield gain from cleaner water can be worth $5M to $15M annually in a large fab, far above chemical or energy savings alone.
ROI Calculator: How to Justify UPW System Investments
A multimillion-dollar UPW case needs more than water-bill math. Yield protection is usually the largest cash lever. To size an upgrade such as mixed-bed to EDI or a new recycling loop, walk these five steps.
- Calculate Current OPEX: Total your annual energy, chemical, and labor costs. Example: $15/1,000 gal × 3M GPD × 365 days = $16.4M/year.
- Estimate CAPEX for Upgrade: Include equipment, installation, and downtime costs. Example: $10M for a new EDI and recycling system.
- Project Future OPEX Savings: Account for reduced chemical use and water procurement costs. Example: $2M/year savings.
- Factor in Yield Improvements: Estimate the value of reduced wafer defects. Example: $5M/year in recovered yield value.
- Calculate Payback Period: Divide the CAPEX by total annual savings (OPEX + Yield). Example: $10M ÷ $7M = 1.4-year payback.
Compliance and water security also carry value. Proving about 70% recovery can decide whether an expansion permit proceeds. Facility directors treat that recovery proof as growth insurance beside pure OPEX math. Most plants we model still show the 1.4-year example only after finance accepts the yield line, not before.
| ROI Factor | Annual Financial Impact | Description |
|---|---|---|
| Chemical Savings | $500K – $1.5M | Elimination of resin regeneration chemicals via EDI |
| Water Recovery | $1M – $3M | Reduction in raw water purchase and discharge fees |
| Yield Improvement | $5M – $15M | Reduced wafer contamination and higher binning rates |
| Energy Efficiency | $300K – $800K | Use of VFDs and high-efficiency RO membranes |
Five Cost-Saving Strategies for Semiconductor UPW Systems
Five tactics already used in fab water plants can lower ownership cost without relaxing purity. None of them changes the 18.2 MΩ·cm gate. They change when you spend, and how many kilowatt-hours you buy.
- Modular Design: Build for ramp, not peak day-one load. HydropureWater’s modular water purification systems for scalable UPW pre-treatment let fabs add capacity later and defer 20–30% of initial CAPEX.
- Hybrid Water Recycling: Target streams such as CMP wastewater and recover up to 70% of UPW. Pump energy for those loops can be offset with solar-powered systems that reduce wastewater treatment costs for semiconductor fabs.
- Energy-Efficient Pumping: High-pressure pumps dominate power draw. VFDs match pump work to demand and can save 15–20% energy.
- Enhanced Automation: PLC control can cut labor 30–50% and reduce human-error contamination that destroys yield.
- Predictive Maintenance: IoT pressure and UV intensity data can extend membrane life 10–15% versus fixed calendars and avoid unplanned stops.
Who This Is For / Who Should Look Elsewhere / Next Step
Fab utility engineers, process owners, and finance teams should use this model when they size UPW capital, operating spend, and payback. Tool owners who only need particle or bacteria limits should look elsewhere. Teams building a municipal cost model for another country should stay with that page, not these fab unit rates.
Bring design flow, raw-water quality, the process node, and the local power tariff. Request a scoped UPW cost review with those four inputs so the estimate uses your volume rather than a generic 3 million gallon per day case.
Frequently Asked Questions
What is the average cost of UPW per 1,000 gallons in 2025?
UPW operating cost averages $12 to $30 per 1,000 gallons in 2025. Advanced fabs on 3nm nodes, or plants in water-scarce regions, usually sit near $25-$30 because recycling and higher pump pressure add energy. Legacy lines with milder purity targets and cheaper power often land closer to $12. Most plants we size for a first 300mm ramp quote the middle of that band until the raw-water analysis is in, and the 2025 table uses the same $12–$30 envelope.
How much does a UPW system for a 300mm fab cost?
A complete UPW system for a standard 300mm fab typically requires a CAPEX of $8M to $15M. That figure covers two-pass RO, EDI, UV sterilization, and PVDF distribution loops. Advanced nodes below 3nm often move toward the $15M–$20M band when ZLD and extra polishing are added. Small 200mm lines are a different case, commonly $2M–$5M, so ask for a line-item split before comparing vendor totals, because piping distance can move the install inside the stated bands.
Does EDI really save money compared to mixed-bed ion exchange?
Yes, EDI has a 30-50% higher upfront cost than mixed-bed ion exchange, yet it removes bulk acid and caustic storage for resin regeneration. In high-volume fabs the premium often pays back in less than 2 years. Chemical savings from dropping regeneration commonly fall in the $500K–$1.5M per year band in the ROI table. Plants we convert off mixed beds also cut regeneration labor, which a first-cost bid often misses.
What are the biggest cost drivers for UPW OPEX?
Energy is the largest driver at 40-50% of OPEX, followed by maintenance and consumables at 20-30% and chemicals at 15-20%. Electricity for high-pressure pumps and UV lamps is the largest line. On a 3M GPD fab, electricity alone runs $7.1M–$13.1M a year. VFDs are the first lever most plants we review fund, because chemical dose is real money but it rarely beats power.
How can I reduce the CAPEX of a new UPW system?
Modular system design is the most effective way to reduce upfront CAPEX. Installing only the capacity needed for the initial fab ramp can defer 20-30% of equipment cost into a later budget cycle. Most plants we size for a staged 300mm start buy the polish loop now and leave the second RO train as a pad and a nozzle. That deferral does not relax the 18.2 MΩ·cm test on day one, and it only avoids paying for idle membrane area.