The 7 Wastewater Treatment Steps at a Glance
Industrial wastewater treatment process steps typically run preliminary screening and grit removal, primary sedimentation, secondary biological oxidation, tertiary polishing, disinfection, sludge handling, then discharge or reuse. Primary clarification often removes 30–40% BOD and 50–70% TSS. Secondary biology commonly cuts BOD and COD by 85–95% when DO, F/M, and HRT stay in design range.
The 7 steps in wastewater treatment form the practical sequence most plants follow when converting high-variability industrial effluent into permit-ready water. Industrial wastewater discharge enforcement pressure rose sharply after 2023 reporting cycles, and many plants still miss one or more permit limits—leaving ecosystems exposed to PFAS, metals, and high-COD loads. For pharmaceuticals, food processing, textiles, and metals finishing, each step decides whether effluent clears the permit or triggers violations.
Procurement teams should treat the seven-step map as a scope checklist, not a brochure outline. If a bid skips grit removal, sludge dewatering, or disinfection validation, the missing unit usually returns as a change order after the first violation notice. Regional case notes such as industrial wastewater treatment in Quito show how local permits reshape the same unit train without changing the step order.
Unlike municipal sewage, industrial streams need tailored pretreatment. A dairy FOG load often needs dissolved air flotation for about 95% oil and grease removal at 30–50 mg/L influent FOG, while semiconductor rinse waters may need advanced oxidation for PFAS precursors. Untreated discharge can foul groundwater and interrupt production. Earlier guidance often cited Clean Water Act civil fines near $50,000 per day; the 2024 EPA inflation adjustment sets the Clean Water Act civil penalty maximum at $66,712 per day for each violation. Roughly 60% of industrial sites still run weak pretreatment, which raises fouling risk and biological upset downstream.
Market estimates put the global wastewater treatment sector near $308 billion in 2024, driven by permits and water scarcity. Parts of the U.S. Southwest now push reuse for a large share of industrial demand, and the EU Industrial Emissions Directive tightens nitrogen and phosphorus limits. This guide walks the seven-step train for industrial duty, with equipment choices from screens and DAF to sludge dewatering, plus emerging concerns such as microplastics. Whether you are sizing a new train or diagnosing an existing one, the sequence below is the decision map engineers actually use.
Start with five facts on paper before calling vendors: peak and average flow in m³/d (US gpd), COD/BOD ratio, FOG and TSS, metals or solvents of concern, and the written permit limit for each parameter. Most plants we size for industrial parks run toward the lower end of textbook HRT ranges because tanks were built for yesterday’s product mix. Missing peak-dump data is the usual reason a “compliant” design fails on night shift.
| Parameter | Industrial Wastewater | Municipal Wastewater |
|---|---|---|
| Contaminant Variability | High (e.g., heavy metals, solvents, FOG) | Low (primarily organic waste, nutrients) |
| Treatment Complexity | Requires pretreatment (e.g., chemical dosing, pH adjustment) | Standard biological methods suffice |
| Regulatory Limits | Stricter (e.g., PFAS: 4 ppt in some states) | Less stringent (e.g., BOD: 30 mg/L) |
| Water Reuse Potential | High (e.g., cooling towers, irrigation) | Limited (typically discharged to surface water) |
Step 1: Preliminary Treatment – Screening and Grit Removal
Preliminary treatment removes debris and grit before they damage pumps, clog pipes, or upset biology. Without this step, plants lose capacity fast: a single 50 mm rake jam in a Rotary Mechanical Bar Screen (GX Series) can cut throughput by 40%, while undetected grit can accumulate near 1.2 tons per million gallons of wastewater, according to EPA estimates most plants still use for planning.
Screening: The First Line of Defense
Bar screens capture solids larger than about 6 mm—rags, plastics, wood—before they foul equipment. Industrial trains often run mechanical screens with 3–10 mm openings at flows up to 5,000 m³/h. Food and textile plants add fine screens at 0.5–2 mm to catch fibers that would foul membranes later. Screening failures are expensive: a 2022 Midwest rendering incident left about $2.8M in pump repairs after a 30 cm rag bypassed a manual screen and destroyed a 150 HP centrifugal pump.
Channel velocity and CIP dump cycles matter as much as bar spacing. Batch dumps can push rags through a manual rack in minutes; timed mechanical rakes hold the opening clear when operators are elsewhere. Spec the screen on peak instantaneous flow, not daily average, or the bypass gate becomes the real treatment unit.
Grit Removal: Protecting Process Integrity
Grit—sand, glass, metal fragments—abrades equipment and steals tank volume. Aerated grit chambers use controlled turbulence to settle particles by density, often reaching 90–95% removal of grit 0.2 mm and larger. For high-COD pulp, paper, or chemical flows, vortex grit separators handle up to 10,000 m³/h at about 98% efficiency on 0.15 mm+ particles. Poor grit control shortens equipment life: a 2023 Water Environment Federation review found plants with weak grit management saw about 3.5× more pump failures and 22% higher maintenance cost.
Equipment Selection: Matching Challenges to Solutions
| Challenge | Solution | Key Parameter |
|---|---|---|
| High FOG (fats/oils/grease) | Dissolved Air Flotation (DAF) System | 95% FOG removal at 30–50 mg/L influent |
| Fibrous debris (textiles/paper) | Rotary drum screens | 0.5–2mm openings, 99% capture rate |
| Heavy grit (metal/glass) | Vortex separators | 98% removal of 0.15mm+ particles |
Industrial pretreatment must match the chemistry, not just the flow. PFAS-bearing semiconductor or firefighting-foam streams need screening plus advanced oxidation so residuals do not migrate downstream. Steel-mill wastewater above 60°C needs corrosion-rated screens and grit chambers. A sound preliminary train typically cuts TSS by 60–70%, lowers coagulant demand later, and can extend membrane life in MBR Membrane Bioreactor Wastewater Treatment Systems by 30–40%.
Checklist before purchase: match screen opening to the worst rag event on record, verify grit removal on the densest particle you actually see, and reserve FOG removal if oil exceeds about 100 mg/L on peak days. Those three decisions prevent most “mysterious” pump and membrane failures six months after startup.
Step 2: Primary Treatment – Sedimentation and Sludge Separation
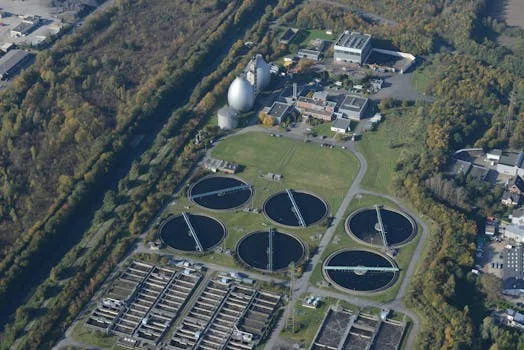
Primary treatment uses gravity to separate settleable solids and floatable oils after screening. This cut in organic and solids load protects secondary biology, especially on high-COD manufacturing, food, and chemical wastes. Primary trains typically achieve 30–40% BOD removal and 50–70% TSS reduction, with results tied to influent solids and tank geometry (EPA, 2021).
How Sedimentation Tanks Work
Primary clarifiers—circular or rectangular—slow the flow to about 0.3–0.6 m/h so denser solids settle while oils and grease rise. Hydraulic retention times usually sit between 1.5 and 3 hours, depending on the industry. Pulp and paper mills often need longer detention for fibrous sludge; pharmaceutical plants favor faster separation to limit API carryover. Inclined plate settlers increase effective surface area and can shrink footprint by up to 50% without giving up removal.
Surface loading rate beats tank volume as a field check. When operators push flow above the plate-settler rating to absorb a production surge, TSS bleed-through reaches the aeration basin within one shift. Keep a spare polymer tote for those surges rather than permanently overdosing on quiet days.
Primary Sludge Handling: Challenges and Solutions
Bottom sludge at 2–8% solids needs prompt thickening or dewatering before anaerobic odor and gas issues start. Typical field problems include:
- High-viscosity sludge (e.g., from dairy or brewery wastewater) that clogs pumps.
- Toxic compounds (e.g., PFAS, heavy metals) that limit disposal options.
- Variable flow rates in batch production facilities.
Most industrial plants couple clarifiers with centrifuges or belt presses to reach 15–25% dry solids. One textile mill cut sludge volume by 60% with a high-speed decanter centrifuge and saved about $280,000 per year in disposal.
Equipment-Specific Considerations
| Parameter | Conventional Clarifier | Inclined Plate Settler | Dissolved Air Flotation (DAF) |
|---|---|---|---|
| Footprint (m²/1,000 m³/d) | 150–250 | 50–80 | 30–60 |
| TSS Removal Efficiency | 50–70% | 70–90% | 85–95% (with coagulants) |
| Best For | Low-FOG wastewater | Space-constrained sites | High-FOG or emulsified effluents |
Meat plants and other high-FOG sites often put DAF inside the primary block. Microbubbles deliver about 90% FOG removal and can cut chemical dose by roughly 30% versus plain sedimentation when emulsions are the problem.
Regulatory and Reuse Implications
Primary performance sets the headroom for NPDES permits and China’s GB 8978-1996 limits. A semiconductor plant in Shanghai lowered COD from 1,200 mg/L to 600 mg/L with tighter primary clarification and stayed inside local pretreatment rules. Primary effluent with TSS < 100 mg/L can feed membrane bioreactors for 30–50% internal recycle to cooling towers or irrigation.
Cost drivers at primary are footprint, sludge hauling, and coagulant use. Cheap civil tanks look attractive until haul fees rise. Better primary solids capture often pays back through lower secondary aeration power and polymer within two operating seasons.
Step 3: Secondary Treatment – Biological Degradation of Organics
Secondary treatment uses microorganisms to oxidize dissolved and colloidal organics after primary solids removal. Well-run trains cut BOD and COD by 85–95%. Discharge rules such as China’s GB 8978-1996 and U.S. EPA NPDES permits often set BOD near or below 30 mg/L. Miss that band and you face fines, curtailment, or blocked reuse projects.
How Microorganisms Work: Aerobic vs. Anaerobic Processes
Aerobic systems rely on oxygen-using bacteria (for example Pseudomonas and Bacillus) to convert organics to CO₂, water, and biomass. Design targets most plants we size for include:
- Dissolved oxygen (DO): 2–4 mg/L for optimal floc formation
- Food-to-microorganism ratio (F/M): 0.2–0.5 kg BOD/kg MLSS/day
- Hydraulic retention time (HRT): 4–8 hours for conventional activated sludge
Anaerobic systems use methanogens in oxygen-free tanks to make biogas at about 60% methane. They suit high-COD pharmaceutical or food wastes, often removing 70–90% COD while recovering energy. Stable operation needs pH 6.8–7.4 and temperature about 30–37°C.
| Parameter | Aerobic Systems | Anaerobic Systems |
|---|---|---|
| Energy Input | High (aeration pumps) | Low (no aeration) |
| Sludge Production | High (0.4–0.6 kg sludge/kg BOD) | Low (0.05–0.1 kg sludge/kg COD) |
| Start-up Time | 1–2 weeks | 4–8 weeks |
| Suitable for | Low-to-medium COD (≤1,000 mg/L) | High COD (≥2,000 mg/L) |
Key Biological Treatment Methods
- Activated Sludge Process (ASP): ASP keeps mixed liquor suspended solids circulating in aeration tanks. MBR upgrades add ultrafiltration and can hold effluent turbidity below 0.2 NTU when reuse is the goal. Compact sites also evaluate an Underground Package Sewage Treatment Plant (WSZ Series) when civil space is tight and flows sit in the package-plant range.
- Moving Bed Biofilm Reactors (MBBR): Plastic carriers provide biofilm area in a smaller footprint. MBBR trains tolerate shock loads better than conventional ASP, which helps batch industrial schedules.
- Trickling Filters: Rock or plastic media support biofilm while wastewater is sprayed overhead. They remain cost-effective for small breweries and similar sites because energy demand stays low.
Aeration: The Engine of Biological Treatment
Diffused air, surface aerators, or jet aerators supply the oxygen aerobic biology needs. Fine-bubble diffusers often reach 6–8% oxygen transfer efficiency and can cut energy about 30% versus coarse-bubble grids. Aeration also strips some VOCs, which helps odor control. A 2023 Water Research study reported 15–25% energy savings from DO-sensor control without losing treatment performance.
Keep spare diffuser membranes and a calibrated DO probe on the shelf. Most “biology failed” tickets we see start as aeration hardware faults, not as mysterious microbial collapse. Log F/M weekly when production mix changes; a silent shift from 0.25 to 0.55 kg BOD/kg MLSS/day is enough to invite filaments.
Secondary success is a balance of microbes, hardware, and permit math. Refractory streams—PFAS-bearing textiles, for example—may need hybrid aerobic/anaerobic trains plus chemical dosing. Tertiary polishing then removes nutrients, color, and micropollutants that biology alone leaves behind.
Step 4: Tertiary Treatment – Advanced Pollutant Removal

Tertiary treatment polishes secondary effluent by removing residual nutrients, pathogens, and micropollutants. Industrial permits under NPDES or GB 8978-1996 often require this step when PFAS, pharmaceuticals, dyes, or metals remain after biology. The unit operations below are selected against the discharge or reuse target, not by habit.
Key tertiary methods include:
- Filtration: Multimedia filters (sand, anthracite, garnet) or ultrafiltration membranes remove suspended solids down to 0.1–10 microns, achieving <5 mg/L TSS. For high-COD pulp/paper or chemical streams, activated carbon adsorbs dissolved organics and can cut COD by 70–90%.
- Chemical Precipitation: Ferric chloride, alum, or lime bind phosphorus as solids. Metal-finishing plants use selective precipitation to push copper or nickel below 0.1 mg/L under EPA Metal Finishing Effluent Guidelines (40 CFR Part 433). For hexavalent chromium lines, see our guide to chemical precipitation for chromium removal before you lock coagulant dose and redox control.
- Membrane Processes: Reverse osmosis and nanofiltration reject 95–99% of dissolved salts, pathogens, and many micropollutants. RO permeate below 10 µS/cm conductivity supports cooling-tower and boiler makeup, but oils and silica scale demand DAF or antiscalant pretreatment.
- Advanced Oxidation Processes (AOPs): UV/H₂O₂ or ozone generate hydroxyl radicals that attack PFAS precursors and APIs such as carbamazepine when conventional biology stalls.
Industry loads drive method choice:
| Industry | Primary Contaminants | Tertiary Treatment Method | Performance Target |
|---|---|---|---|
| Textiles | Azo dyes, surfactants, salts | NF + Activated Carbon | <50 mg/L COD, <1 mg/L color units |
| Pharmaceuticals | APIs, PFAS, solvents | AOP (UV/H₂O₂) + RO | <0.1 µg/L PFAS, <100 CFU/mL pathogens |
| Food & Beverage | Nutrients (N, P), FOG | Chemical Precipitation + DAF | <1 mg/L TP, <10 mg/L BOD |
Reuse programs lean on tertiary barriers. A petrochemical plant in Ningbo cut freshwater intake by 40% with RO permeate for cooling makeup; a Taiwan semiconductor fab reported about 90% reuse through MF-RO-UV. China’s Water Pollution Prevention and Control Action Plan has pushed tertiary duty into more high-risk sectors. Chemical sludge from precipitation needs reliable dewatering, and membranes need strong pretreatment. For PFAS, GAC or ion exchange is common, though spent media disposal remains constrained under EPA’s PFAS Strategic Roadmap.
Main tertiary cost drivers are membrane replacement, antiscalant, carbon change-out, and high-pressure pump energy. Pilot a 1–5 m³/h skid on real secondary effluent for two to four weeks before freezing full-scale design; jar tests alone miss fouling kinetics that show up after day ten.
Step 5: Disinfection – Killing Pathogens Before Discharge
Disinfection inactivates bacteria, viruses, and protozoa so effluent meets NPDES or EU Directive 91/271/EEC microbial limits. Food, pharma, and textile plants often face tighter pathogen targets because organic waste raises microbial load. Method choice follows turbidity, residual needs, byproduct limits, and operating cost.
Four common options compare as follows:
| Method | Mechanism | Dose Range (mg/L or mJ/cm²) | Contact Time | Pros | Cons | Byproduct Risks |
|---|---|---|---|---|---|---|
| Chlorination | Oxidation of cell membranes | 2–20 mg/L (free chlorine) | 15–60 min | Low cost, residual protection | pH-dependent efficacy, corrosive | Trihalomethanes (THMs), chloramines |
| UV Radiation | DNA/RNA disruption | 20–100 mJ/cm² (254 nm) | Instantaneous | No chemical residuals, effective against Cryptosporidium | High turbidity reduces efficacy, no residual | None |
| Ozone | Oxidation of cellular components | 1–5 mg/L | 5–10 min | Broad-spectrum, oxidizes PFAS precursors | High energy demand, off-gas handling | Bromate (if bromide present) |
| Chlorine Dioxide | Protein denaturation | 0.5–2 mg/L | 10–30 min | pH-independent, no THMs | Explosive at high concentrations, costly | Chlorite, chlorate |
UV is often preferred on high-COD pulp and paper effluent when chlorine residual would hurt reuse. Variable turbidity usually needs pre-filtration so the UV dose actually reaches the microbes. Ozone costs more to install but helps with recalcitrant organics at semiconductor and leachate sites. California Title 22 recycled-water rules commonly demand multi-log virus inactivation, so disinfection is sized to the log-removal credit, not to a generic dose table. Where operators want a chemical residual without THMs, an on-site Chlorine Dioxide (ClO₂) Generator for Water Disinfection is a frequent option at 0.5–2 mg/L.
Byproduct control is part of the design, not an afterthought. Chlorination THMs are managed with bisulfite dechlorination; ozone needs off-gas destruction. Turbid effluent from bulking sludge scenarios often pairs UV with peracetic acid. Always prove kill against the local permit—E. coli below 126 CFU/100 mL or fecal coliforms below 200 CFU/100 mL are common benchmarks, but the receiving water and industry category set the real number.
Disinfection selection checklist: measure secondary turbidity on the worst day, decide whether a residual is required in the pipe, list byproduct limits in the permit, and confirm power and chemical logistics. Skipping the turbidity check is the fastest way to buy a UV system that cannot deliver the credited log removal.
Step 6: Sludge Treatment and Management

Sludge from primary and secondary stages is usually 1–2% of influent volume and must be thickened, stabilized, and dewatered before disposal or reuse. Industrial cakes often carry metals, FOG, or PFAS, so the solids train is a compliance path of its own, not a side chore.
Core Processes and Equipment
| Process | Method | Key Parameters | Industrial Considerations |
|---|---|---|---|
| Thickening | Gravity, DAF, rotary drum | Solids: 2–5% → 4–8%; HRT: 6–24 hrs | DAF ideal for oily sludge (e.g., food processing); centrifuges for high-solids streams |
| Digestion | Aerobic (30–35°C) / Anaerobic (35–55°C) | VS reduction: 30–60%; Biogas yield: 0.5–1.0 m³/kg VS | Anaerobic preferred for high-COD sludge (e.g., pulp/paper); aerobic for low-organic loads |
| Dewatering | Belt press, centrifuge, screw press | Cake solids: 15–40%; Polymer dose: 2–10 kg/ton DS | Centrifuges achieve 25–35% solids for landfill-ready cake; filter presses for hazardous sludge |
Disposal and Reuse Pathways
- Land Application: Regulated under 40 CFR Part 503 (U.S.) or EU Sewage Sludge Directive; Class A biosolids (fecal coliforms <1,000 MPN/g) permit agricultural use. Industrial sludge often requires pretreatment to meet heavy metal limits (e.g., Cd <39 mg/kg).
- Incineration: Achieves 90% volume reduction; energy recovery offsets costs (e.g., 3–5 MJ/kg sludge). Emission controls (e.g., scrubbers for SO₂, Hg) add $150–$300/ton to operational expenses.
- Landfill: Monofills or co-disposal with municipal waste; leachate management critical for PFAS-containing sludge. Tipping fees range from $50–$150/ton (U.S. EPA, 2023).
- Resource Recovery: Phosphorus extraction (e.g., struvite crystallization) yields 10–20 kg P/ton sludge; emerging technologies target PFAS destruction via hydrothermal liquefaction. High-purity recovery concepts such as SiC wastewater resource recovery show how solids and salts can become products instead of liabilities.
Dewatering efficiency and tip fees often dominate sludge OPEX; polymer alone can run $1,000–$3,000 per ton of product polymer, and disposal can exceed half of solids cost. Hazardous or high-solids cakes frequently move to a Plate and Frame Filter Press for Sludge Dewatering when centrifuges cannot hit the required cake dryness. Align dewatering with upstream chemistry using the Industrial Wastewater Treatment Equipment Selection Guide, and use the foaming/bulking troubleshooting notes when SVI drifts.
Sludge OPEX checklist: polymer dose per ton dry solids, cake dryness target, haul distance, and whether Class A or B rules apply. Plants chasing zero liquid discharge still generate solids; budget the cake path on day one or the “closed loop” story fails at the landfill gate. Faridabad-style industrial clusters face the same solids math under different local rules—see industrial wastewater treatment in Faridabad for a regional compliance framing.
Step 7: Effluent Discharge and Water Reuse
Effluent discharge and reuse decide whether the train earns its keep. Plants must meet NPDES or EU Industrial Emissions Directive limits—often BOD <50 mg/L, COD <250 mg/L, and tightening PFAS thresholds such as <70 ppt where specified—using continuous pH, turbidity, and TOC sensors plus lab confirmation.
Reuse is the usual next lever when freshwater is scarce or expensive. RO or UF permeate can feed cooling towers, irrigation, or boiler makeup. A Taiwan semiconductor plant reused 2,500 m³/day and cut freshwater demand by about 40%. Potable reuse remains rarer but follows multi-barrier trains such as Singapore’s NEWater (microfiltration + UV + RO). Size the final barrier with the Wastewater Treatment System Sizing Guide so hydraulic and contaminant peaks both clear the permit.
Online sensors catch drift; grab samples close the compliance file. If turbidity or TOC trends toward the permit ceiling for three consecutive days, hold reuse diversion and check secondary clarifier performance or membrane TMP before the lab result arrives. That habit prevents most reuse-water quality complaints we see after weekend production spikes.
| Parameter | Discharge Standard (EPA NPDES) | Reuse Quality (Industrial) |
|---|---|---|
| BOD5 | <30 mg/L | <10 mg/L |
| TSS | <30 mg/L | <5 mg/L |
| Turbidity | N/A | <0.5 NTU |
| Total Nitrogen | <10 mg/L | <5 mg/L |
Common Challenges and How to Overcome Them
Industrial trains fail in repeatable ways: foam, bulking, fouling, and turbid effluent. The seven-step map still holds, but each failure mode needs a specific lever—F/M, DO, coagulants, or hardware upgrades—not a generic “optimize the plant” note.
Key Challenges and Solutions
| Challenge | Root Cause | Solution | Equipment/Product Link |
|---|---|---|---|
| Excessive foaming in aeration tanks | Surfactants, high organic load, or filamentous bacteria (e.g., Nocardia) | Adjust F/M ratio (0.2–0.5 kg BOD/kg MLSS/day), add antifoam agents, or install surface spray systems | Foaming troubleshooting guide |
| Bulking sludge (SVI > 150 mL/g) | Low DO (< 1.0 mg/L), nutrient imbalance (N/P ratio < 5:1), or filamentous overgrowth | Increase aeration, dose selective biocides, or implement anoxic selectors | HydropureWater’s MBR Systems (MLSS control via membrane filtration) |
| Clogged DAF or filter media | High FOG (> 500 mg/L) or suspended solids (> 1,000 mg/L) in influent | Upgrade to high-efficiency DAF systems with lamella separators or add chemical coagulants (e.g., PAC at 50–100 mg/L) | HydropureWater’s DAF System (95% FOG removal, 30% smaller footprint) |
| Turbid effluent (NTU > 5) | Incomplete flocculation, filter breakthrough, or hydraulic overload | Optimize polymer dosing (0.5–2 mg/L), backwash filters at 15–20 gpm/ft², or add tertiary sand/anthracite filters | Equipment selection guide |
Watch MLSS and DO trends before foam or bulking become visible. A DO drop below 0.5 mg/L often precedes bulking; surfactant spikes track with foam. Online DO probes that trim aeration or trigger chemical dose can cut related downtime by up to 40% when operators act on the alarm within one shift.
High-strength feeds above 2,000 mg/L COD can overwhelm conventional biology. Electrocoagulation or UV/H₂O₂ AOPs often cut 70–90% COD on pharmaceutical streams before secondary treatment, which helps meet GB 8978-1996 targets near COD < 100 mg/L. Food plants lean on DAF for FOG; textile mills need color removal with carbon or ozone. Capacity math belongs in the wastewater treatment system sizing guide, which ties m³/h flow to contaminant load.
When foaming, bulking, and turbid effluent stack in the same week, fix the root cause upstream first. Antifoam without F/M correction only buys a quiet shift. Most plants we support recover faster by restoring DO to 2–4 mg/L and trimming peak organic dumps than by buying another chemical tote on Monday morning.
Who This Is For / Next Step
Plant engineers, EPC teams, and procurement managers use this breakdown to compare industrial wastewater treatment process steps against a real permit and sludge ticket. Look elsewhere if you only need a municipal package plant with stable domestic sewage and no industrial pretreatment.
Bring COD, FOG, metals, peak flow, and the discharge or reuse target to the first call. For a duty-specific equipment list and budget band, send those data through our request a quote form so sizing starts from measured loads—not from a generic brochure. A short soft check with process engineering before civil freeze usually saves a clarifier or membrane retrofit later.
Frequently Asked Questions
How much does an industrial wastewater treatment system cost?
Installed cost tracks flow, contaminant load, and reuse goals more than brand. A basic DAF for FOG removal often starts near $50,000 at about 50 GPM, while a full biological plant with membranes and sludge dewatering can exceed $2 million at about 500 GPM. Use the Wastewater Treatment System Sizing Guide to fix capacity before you solicit bids. Modular skids let capital follow production growth instead of overbuilding year one.
What are the most common maintenance issues in wastewater treatment?
Foaming, bulking sludge, and membrane fouling dominate industrial maintenance tickets. Filamentous bacteria such as Nocardia often bloom when F/M drifts above about 0.3 kg BOD/kg MLSS/day or DO falls. Real-time MLSS and DO monitoring plus targeted antifoam or selector changes stop most events before effluent turbidity rises. The site troubleshooting guide covers 18 recurring problems with root-cause checks and corrective actions.
How do I ensure compliance with effluent discharge standards?
Map the permit first—U.S. NPDES or China’s GB 8978-1996—then design to the strictest parameter, not the average day. Typical industrial targets include COD below 50 mg/L for many sectors, ammonia below 10 mg/L, and chromium below 0.1 mg/L where metals finishing applies. Automated ferric dosing for phosphorus plus tertiary filtration closes most gaps. Weekly lab checks on priority pollutants remain essential even with online sensors.
Can treated wastewater be reused in industrial processes?
Yes—UF + RO + UV trains can reach 99%+ removal of many contaminants for cooling, boiler feed, or rinse water. One Taiwan semiconductor site reused about 70% of effluent after MBR polishing and cut freshwater intake by roughly 1.2 million gallons per year. Build reuse into early equipment selection so membrane pretreatment and brine handling are funded, not bolted on later.
What is the lifespan of wastewater treatment equipment?
Most industrial hardware lasts 8–20 years when feed chemistry and maintenance stay inside design limits. DAF units commonly run 15–20 years with stable pH and polymer control; MBR membranes often need replacement in 8–12 years based on TMP and cleaning cycles; sludge centrifuges typically last 10–15 years with consistent feed solids.
| Equipment Type | Typical Lifespan (Years) | Key Maintenance Factors |
|---|---|---|
| DAF Systems | 15–20 | pH control, polymer dosing optimization |
| Membrane Bioreactors (MBR) | 8–12 | Chemical cleaning frequency, TMP monitoring |
| Sludge Dewatering Centrifuges | 10–15 | Bearing lubrication, feed consistency |
Quarterly corrosion and seal checks can extend service life by 30–40%. Budget about 2–5% of capital cost per year for upkeep.