CMP Slurry Wastewater Treatment Cost 2025: Engineering Breakdown, Tech Comparison & ROI Calculator for Fabs
CMP slurry wastewater treatment costs vary widely based on technology and fab scale, but onsite systems can reduce expenses by up to 85% compared to offsite disposal. For a 50 m³/h CuCMP wastewater stream, CAPEX ranges from $1.2M (electrochemical recovery) to $2.5M (DAF + MBR), with OPEX savings of $0.5M–$1.2M/year from copper recovery and water reuse. Key cost drivers include influent copper concentration (50–500 mg/L), silica loading (100–1,000 mg/L), and hydrogen peroxide residuals (1–5%). This guide provides engineering specs, tech comparisons, and an ROI calculator to help fabs select the most cost-effective solution.
Why CMP Slurry Wastewater Treatment Costs Are Rising in 2025
Offsite disposal costs for CMP wastewater currently range from $0.80 to $2.50 per gallon in 2025, leading to annual expenditures that often exceed $1.5M for mid-sized semiconductor facilities processing 50 m³/h of effluent. These escalating costs are driven by the high volume of water required for chemical-mechanical planarization, where slurry is diluted by ultra-pure water (UPW) at ratios as high as 60:1. As fab capacities expand, the sheer volume of hazardous liquid waste makes transport and external treatment logistically and financially unsustainable.
Regulatory pressure is a secondary but equally critical cost driver. EPA and local municipality discharge limits for copper are tightening globally, with many jurisdictions moving from the traditional 0.5 mg/L limit down to <0.1 mg/L. Fabs that fail to meet these stringent limits face heavy surcharges or permit revocations, forcing a shift toward more sophisticated onsite treatment technologies. the consumption of CMP slurry directly correlates with wastewater overhead; engineering data suggests that a 20% reduction in slurry usage through process optimization can cut downstream wastewater treatment OPEX by 15–30% (HydropureWater field data, 2025).
The chemical complexity of modern slurries also inflates treatment budgets. The presence of high-concentration hydrogen peroxide (H2O2) and organic chelators (like EDTA or citric acid) complicates standard precipitation methods. These components require specialized pre-treatment stages, such as chemical reduction or advanced oxidation, which typically increase chemical reagent costs by 25–40% compared to standard industrial wastewater streams. This financial burden is driving fab managers to evaluate advanced copper recovery systems for semiconductor fabs to offset costs through resource reclamation.
CMP Wastewater Composition: What Makes Treatment So Expensive?
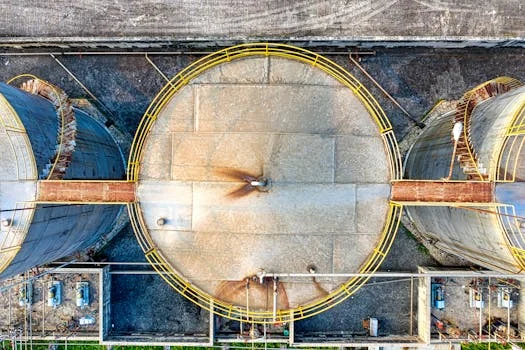
CMP wastewater is uniquely difficult to treat because it combines abrasive nanoparticles with dissolved metallic ions and aggressive oxidizing agents. During the polishing process, the slurry—containing silica or alumina abrasives—is diluted by a factor of 60 with UPW, resulting in massive volumes of waste that contain relatively low but highly regulated concentrations of copper. The high volume-to-contaminant ratio means that treatment systems must be sized for hydraulic capacity, which significantly drives up CAPEX.
Key contaminants that dictate the engineering design include copper (50–500 mg/L), colloidal silica (100–1,000 mg/L), and hydrogen peroxide (1–5%). Residual H2O2 is particularly problematic; it inhibits biological treatment in MBR systems and can degrade ion-exchange resins. Removing it requires chemical reduction using sodium bisulfite or catalytic decomposition, adding roughly $0.10–$0.30/m³ to the total OPEX (industry benchmark). Additionally, silica loading poses a severe threat to membrane-based systems. Without proper solids removal, silica fouling can reduce membrane lifespan by 30–50%, necessitating frequent and costly chemical cleaning or replacement cycles.
Chelating agents such as EDTA further complicate the chemistry by binding to copper ions, preventing them from precipitating out of solution at standard pH levels. Breaking these bonds requires either aggressive pH adjustment or the addition of specialized oxidants, which increases the complexity of PLC-controlled chemical dosing for CMP wastewater pH adjustment. The following table outlines the typical influent parameters that drive system costs.
| Parameter | Typical Range (Influent) | Treatment Challenge | Cost Impact |
|---|---|---|---|
| Copper (Cu) | 50 – 500 mg/L | Strict EPA discharge limits (<0.1 mg/L) | High (Requires recovery or precipitation) |
| Colloidal Silica | 100 – 1,000 mg/L | Rapid membrane fouling | Medium (Requires DAF or coagulation) |
| Hydrogen Peroxide | 1% – 5% | Oxidative damage to equipment/membranes | Medium (Requires chemical reduction) |
| Chelators (EDTA) | 10 – 100 mg/L | Prevents metal precipitation | High (Increases chemical consumption) |
| Total Suspended Solids | 200 – 2,000 mg/L | Sludge generation and disposal | Medium (Requires DAF systems for CMP slurry TSS removal) |
Onsite CMP Wastewater Treatment Technologies: How They Work and What They Cost
Selecting the right technology depends on whether the fab priority is copper recovery, water reuse, or simply meeting discharge compliance. Electrochemical recovery (ER) has emerged as a leader for high-concentration CuCMP streams. These systems use automated electrolytic cells to plate dissolved copper onto high-purity sheets. ER systems typically involve a CAPEX of $1.2M–$3M for flow rates of 50–200 m³/h, but offer the lowest OPEX ($0.20–$0.50/m³) because they recover valuable metal rather than producing hazardous sludge.
Dissolved Air Flotation (DAF) is the industry standard for removing the bulk of silica and suspended solids. Using microbubbles to float particles to the surface, DAF systems are cost-effective for solids management, with a CAPEX of $800K–$2M and OPEX of $0.30–$0.70/m³. However, DAF alone cannot meet <0.1 mg/L copper limits and must be paired with downstream polishing. For fabs pursuing Zero Liquid Discharge (ZLD), integrated MBR systems for CMP wastewater ZLD compliance combined with Reverse Osmosis (RO) provide the highest effluent quality. While MBR+RO has the highest CAPEX ($2M–$4M), it allows for the recovery of UPW, significantly offsetting freshwater procurement costs.
| Technology | CAPEX (50 m³/h) | OPEX ($/m³) | Cu Recovery | Effluent Quality |
|---|---|---|---|---|
| Electrochemical | $1.2M – $1.8M | $0.20 – $0.50 | >99% (Solid) | <0.5 mg/L Cu |
| DAF + Precipitation | $0.8M – $1.5M | $0.30 – $0.70 | 0% (Sludge) | <0.1 mg/L Cu |
| MBR + RO (ZLD) | $2.0M – $3.5M | $0.50 – $1.20 | 0% (Brine) | <0.05 mg/L Cu |
The process flow for these systems varies: Electrochemical units focus on automated copper plating; DAF utilizes microbubble flotation for CMP slurry TSS removal to clarify the water; and MBR systems employ submerged membranes to provide a physical barrier against particles and bacteria.
CAPEX Breakdown: What Drives the Cost of Onsite CMP Treatment Systems?
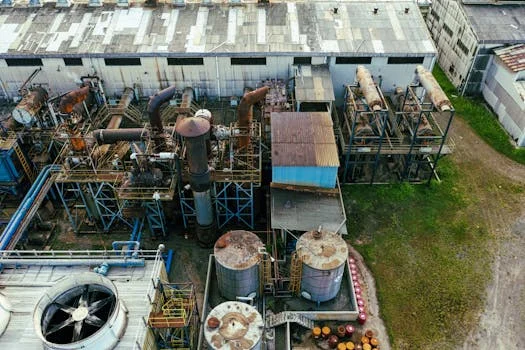
Budgeting for an onsite CMP treatment system requires a clear understanding of the division between equipment costs and site-specific integration. For electrochemical systems, approximately 60% of the CAPEX is allocated to specialized equipment, including high-surface-area electrodes and PLC automation. Installation accounts for 20%, while the remaining 20% is typically spent on permitting and EPA compliance testing to ensure the recovered copper sheets meet purity standards for resale.
DAF systems have a different cost structure, where civil works often play a larger role. About 50% of the budget goes toward the flotation tank, pumps, and dosing skids. However, because DAF units often require large footprint tanks, installation and civil works can rise to 30% of the total CAPEX, especially if underground equalization tanks are required. MBR systems are the most equipment-heavy, with 70% of costs tied to the membrane modules and high-pressure pumps. The following table provides CAPEX estimates based on hydraulic flow rates.
| System Capacity | Electrochemical CAPEX | DAF + Chemical CAPEX | MBR + RO CAPEX |
|---|---|---|---|
| 50 m³/h | $1.2M – $1.5M | $0.8M – $1.2M | $2.0M – $2.5M |
| 100 m³/h | $2.0M – $2.6M | $1.5M – $2.1M | $3.5M – $4.2M |
| 200 m³/h | $3.5M – $4.5M | $2.8M – $3.5M | $6.0M – $7.5M |
Fab layout significantly impacts these figures. Retrofitting an existing facility with limited space can increase installation costs by 10–25% due to the need for custom-engineered footprints or vertical equipment stacking. Conversely, greenfield projects can optimize layout to minimize piping runs and civil expenses.
OPEX Savings: How Onsite Treatment Cuts Costs by 50–85%
The primary driver for onsite treatment is the dramatic reduction in OPEX compared to offsite hauling. Copper recovery represents a direct revenue stream; with 2025 market prices for high-purity copper ranging from $50–$150/kg (depending on purity and form), a 50 m³/h system can recover between 100 and 500 kg of copper per month. This transforms a hazardous waste stream into a secondary resource, significantly lowering the net cost of treatment.
Water reuse provides the second major cost offset. By utilizing ZLD solutions for semiconductor wastewater, fabs can reclaim up to 50% of their UPW influent. Given that UPW production costs range from $0.50 to $2.00/m³, the savings for a high-volume fab can reach hundreds of thousands of dollars annually. automated onsite systems reduce labor costs by up to 70% compared to manual batch precipitation processes, as modern PLC systems handle dosing and monitoring with minimal operator intervention.
| Expense Category | Offsite Disposal (per m³) | Onsite Treatment (per m³) | Annual Savings (50 m³/h) |
|---|---|---|---|
| Disposal/Treatment | $210.00 – $660.00 | $0.40 – $1.20 | $1.2M – $2.8M |
| Water Procurement | $1.50 (No reuse) | $0.75 (50% reuse) | $328,000 |
| Resource Recovery | $0.00 | ($0.15) (Cu Revenue) | $65,000 |
| Total Net OPEX | $211.50+ | $1.00 – $1.80 | $1.5M – $3.2M |
ROI Calculator: When Does Onsite CMP Treatment Pay Off?
Calculating the Return on Investment (ROI) for CMP wastewater treatment requires balancing the high initial CAPEX against the substantial OPEX savings and resource recovery. The standard formula used by fab engineers is: Payback Period (Years) = CAPEX / (Annual OPEX Savings + Copper Recovery Revenue). For most mid-to-large scale facilities, the payback period falls between 1.5 and 4 years.
Consider a 50 m³/h system treating wastewater with 200 mg/L copper. With a CAPEX of $1.5M for an electrochemical system and annual OPEX savings of approximately $600,000 compared to offsite disposal, the payback period is 2.5 years. If the copper concentration increases to >300 mg/L, the increased recovery revenue and higher offsite disposal surcharges can reduce the payback period to as little as 1.5 years (Top 2 data). Fabs operating in regions with high water scarcity or strict EPA limits (<0.1 mg/L) will see an even faster ROI as the "cost of non-compliance" and freshwater costs rise.
To assist in budgeting, fab managers can use a decision framework based on three key inputs: total daily flow, average copper concentration, and local water costs. Generally, if your fab produces more than 10 m³/h of CMP wastewater, the ROI for an onsite system is almost always superior to offsite disposal over a 5-year horizon.
Choosing the Right CMP Wastewater Treatment System: A Decision Framework
The optimal choice for CMP wastewater treatment is dictated by the specific goals of the fab. If the primary objective is to recover high-value copper and minimize sludge, Electrochemical Recovery is the most efficient choice. It is particularly effective for fabs with copper concentrations exceeding 200 mg/L. However, if the fab has a small footprint and needs to prioritize the removal of silica and suspended solids, a DAF system is more appropriate, provided it is followed by a polishing step for metal compliance.
For facilities in drought-prone regions or those with corporate mandates for Zero Liquid Discharge (ZLD), the MBR + RO combination is the only viable path. While this involves the highest CAPEX, it maximizes water independence. A common pitfall in this selection is underestimating the impact of silica. Without a robust DAF or chemical clarification stage upstream of the MBR, silica fouling will cause the ROI to collapse due to excessive membrane replacement costs. The decision tree should follow this logic:
- Copper > 200 mg/L? Prioritize Electrochemical Recovery.
- Water Scarcity/ZLD Required? Implement MBR + RO with aggressive silica pre-treatment.
- Limited Footprint? Utilize high-efficiency DAF with compact chemical polishing.
- Strict Discharge Limits (<0.1 mg/L)? Ensure a multi-stage process (DAF + Ion Exchange or MBR).
Frequently Asked Questions
What is the typical payback period for an onsite CMP wastewater treatment system?
The typical payback period is 1.5 to 4 years. Systems with higher copper concentrations (>200 mg/L) and higher flow rates tend to see faster ROI due to increased metal recovery revenue and greater savings over offsite disposal costs.
How does hydrogen peroxide in CMP wastewater affect treatment costs?
Hydrogen peroxide (H2O2) increases OPEX by 25–40%. It must be neutralized before biological treatment or ion exchange to prevent equipment damage, requiring additional chemical dosing of sodium bisulfite or similar reducing agents.
Can DAF systems achieve EPA copper discharge limits (<0.1 mg/L) without downstream polishing?
Generally, no. While DAF is excellent for removing TSS and colloidal silica, it is not designed to remove dissolved copper to the levels required by strict EPA limits. It must be paired with electrochemical recovery, ion exchange, or membrane filtration to meet <0.1 mg/L standards.
What are the maintenance requirements for electrochemical copper recovery systems?
Maintenance is relatively low and includes quarterly electrode cleaning or replacement, annual PLC and sensor calibration, and monthly replenishment of any required process chemicals. Automation significantly reduces the need for manual labor.
How does silica loading impact MBR system performance?
High silica loading causes irreversible fouling on membrane surfaces. Without effective pre-treatment (like DAF), silica can reduce membrane life by 30–50%, increasing annual membrane replacement costs by up to 40%.