A PAM dosing system is an automated chemical injection unit that delivers polyacrylamide flocculant into industrial wastewater. Under typical plant duty it supports 92-97% total suspended solids (TSS) removal when polymer is fully dissolved and aged. This PAM dosing explained guide covers process stages, dry versus liquid trade-offs, comparison with PAC and ACH, and sizing rules used by plant engineers. Systems combine metering pumps, mixing tanks, and sensors to cut chemical use by up to 30% while holding common discharge windows such as TSS < 30 mg/L and COD < 125 mg/L. PLC closed-loop control limits overdosing events that plants have associated with fines near $50,000 per incident, and underdosing that leaves effluent above permit.
PAM Dosing Explained: Five-Stage Process Flow
A PAM dosing system stores polymer, wets and mixes it, ages the solution for 20-60 minutes, then meters 0.1-10 L/h into the wastewater line. Flocs form in 2-5 minutes of gentle contact. Dry powder mixes at 0.1-0.5% w/v and liquid emulsion at 0.5-2%, with anionic shear at or below 300 RPM and cationic shear at or below 500 RPM.
PAM dosing systems automate preparation and delivery of polyacrylamide through five controlled stages. The train starts at chemical storage and ends at injection into the wastewater line, with setpoints taken from real-time flow and turbidity (HydropureWater field data, 2025).
- Chemical Storage: Raw PAM is held as dry powder (typically 25 kg bags or bulk sacks) or as concentrated liquid emulsion (IBCs or bulk tanks). Dry powder offers a 2-year shelf life and needs less floor space. Liquid emulsions last 6-12 months and often need 10-30°C storage to limit separation or degradation.
- Wetting/Mixing: Polymer must hydrate into an active solution. For dry powder, a wetting unit disperses particles before the mix tank. High shear is used only for initial dissolution; later mixing stays gentle. Shear limits are a maximum of 300 RPM for anionic PAM and 500 RPM for cationic PAM. Exceeding those speeds breaks long chains and cuts flocculation efficiency. Mixing ratios are typically 0.1-0.5% w/v for dry powder and 0.5-2% for liquid emulsions.
- Aging: After mixing, the solution ages 20-60 minutes in a dedicated tank so chains uncoil and hydrate. Optimum stability sits between 10-40°C. Anionic PAM works best at pH 6-9; cationic PAM is more effective at pH 4-8.
- Dosing: Activated solution moves to a metering pump. Diaphragm or peristaltic pumps typically deliver 0.1-10 L/h against wastewater flow and target polymer dose. Inline turbidity, flow, and pH sensors feed closed-loop PLC control so the pump tracks load without manual guesswork.
- Flocculation: Dosed PAM enters the wastewater stream just upstream of a flocculation tank or clarifier. Gentle agitation lets polymer bridges build settleable flocs. Retention of 2-5 minutes in the flocculation zone is the usual window before separation.
Common failure points include incomplete dissolution, which leaves gelled polymer and weak flocs; pump cavitation from high-viscosity concentrate; and sensor fouling that needs weekly calibration to keep closed-loop control honest. Most plants we size for continuous duty run aging toward the middle of the 20-60 minute band rather than the absolute minimum.
| Process Stage | Key Parameter | Typical Range/Threshold | Impact of Deviation |
|---|---|---|---|
| Wetting/Mixing | Dry Powder Mixing Ratio | 0.1-0.5% w/v | Too low: incomplete dissolution; Too high: increased viscosity, pump strain |
| Wetting/Mixing | Liquid Emulsion Mixing Ratio | 0.5-2% | Too low: insufficient polymer concentration; Too high: chemical waste |
| Wetting/Mixing | Anionic PAM Shear Speed | Max 300 RPM | Exceeding: polymer chain degradation, reduced flocculation |
| Wetting/Mixing | Cationic PAM Shear Speed | Max 500 RPM | Exceeding: polymer chain degradation, reduced flocculation |
| Aging | Aging Time | 20-60 minutes | Too short: incomplete polymer activation; Too long: polymer degradation |
| Aging | Solution Temperature | 10-40°C | Outside range: reduced stability, altered viscosity, degradation |
| Aging | Anionic PAM pH Compatibility | 6-9 | Outside range: reduced charge effectiveness, poor flocculation |
| Aging | Cationic PAM pH Compatibility | 4-8 | Outside range: reduced charge effectiveness, poor flocculation |
| Dosing | Metering Pump Precision | 0.1-10 L/h | Inaccurate: overdosing (waste) or underdosing (ineffective treatment) |
| Flocculation | Retention Time | 2-5 minutes | Too short: insufficient floc formation; Too long: floc shear, re-dispersion |
PAM vs. Alternatives: Efficiency, Cost, and Compliance Comparison for 2025
PAM dosing systems consistently achieve 92-97% TSS removal in industrial wastewater when polymer type and dose match the solids charge. They often beat PAC and ACH on turbidity reduction and sludge volume when bridging is the limiting step (HydropureWater field data, 2025).
Procurement teams balance removal efficiency, chemical cost per cubic meter, sludge handling, and compliance risk. The table below keeps the same comparison ranges used in plant screening:
| System Type | TSS Removal Efficiency | Reaction Time | Chemical Cost ($/m³) | Sludge Volume | Compliance Risk | Key Use Case |
|---|---|---|---|---|---|---|
| PAM Dosing | 92-97% | 2-5 min | $0.15-$0.40 | 20-40% reduction vs. PAC | Low (excels in COD/TSS reduction with proper control) | High-TSS industries (textile, mining, pulp & paper), enhanced clarification |
| PAC Dosing | 85-90% | 30-60 sec | $0.20-$0.50 | Higher (more inorganic sludge) | Moderate (rapid turbidity removal, but less effective for organic COD) | Rapid clarification (food processing, municipal), pre-treatment |
| ACH Dosing | 70-80% | 1-2 min | $0.25-$0.60 | Moderate (similar to PAC, but can be pH-sensitive) | Moderate (effective coagulant, but typically needs polymer for optimal flocculation) | Specialized coagulation (certain industrial effluents, color removal) |
| DAF System (Mechanical) | 90-95% | 5-15 min (with chemicals) | $0.30-$0.80 (includes energy) | Low to Moderate (effective for FOG, less dense sludge) | Low (highly effective for FOG and light solids, often combined with chemicals) | FOG-heavy streams (dairy, meat packing), low-density solids removal. Consider a high-efficiency DAF system for PAM-treated wastewater. |
PAM fits textile dyeing, mining, and pulp and paper trains where high suspended solids need robust, settleable flocs. PAC is preferred when reaction time of 30-60 seconds matters more than sludge mass, as in many food plants. DAF units handle fats, oils, and grease (FOG) in dairy and meat packing by floating light solids after chemical conditioning.
Hidden costs shift the choice. PAM needs dissolution and aging tanks, which raise footprint and CAPEX. PAC is faster but often produces more inorganic sludge and higher disposal bills. DAF adds energy for microbubble generation. EPA 2024 enforcement framing in the source material cites non-compliance fines that can reach $50,000 per day; automated metering reduces dose drift that drives those exceedances.
Dry Powder vs. Liquid PAM Systems: Engineering Trade-offs and Facility Constraints
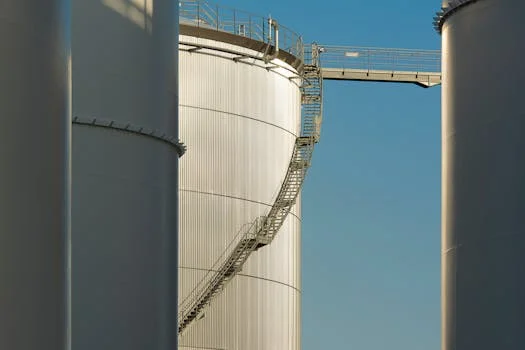
Dry powder versus liquid PAM selection turns on storage space, labor, and chemical stability, not brochure claims. Each path must match plant constraints (HydropureWater analysis, 2025).
Dry powder PAM typically keeps a shelf life up to 2 years when stored dry and needs 20-30% less storage space than liquid. It still needs wetting and mixing hardware, which can be automated or manual, and humidity or temperatures above 40°C can cake the powder.
Liquid PAM emulsions are easier to transfer as plug-and-play feeds, yet they need temperature-controlled tanks to avoid separation or freezing below 5°C. Shelf life is shorter at 6-12 months. Liquid trains often show lower CAPEX because fewer dissolution tanks are required, but tanks need cleaning and more frequent refill because active polymer per kilogram is lower. Raw material pricing in field data sits near $2.50-$4.00/kg for dry powder and $1.80-$3.00/kg for liquid emulsion (HydropureWater field data, 2025); compare on active polymer, not bag price alone.
| Feature | Dry Powder PAM System | Liquid PAM System |
|---|---|---|
| Storage Needs | 20-30% less space, moisture-controlled | Requires temperature-controlled tanks (5-30°C), more space |
| Shelf Life | Up to 2 years | 6-12 months |
| Labor Requirements | Higher (loading, wetting unit maintenance); can be automated | Lower (bulk transfer); requires periodic tank cleaning |
| Chemical Stability | Degrades at >40°C, sensitive to humidity | Separates at <5°C, requires agitation if stored long-term |
| Chemical Cost (raw material) | $2.50-$4.00/kg | $1.80-$3.00/kg (lower active content per kg) |
| CAPEX | Higher (dissolution tanks, wetting units) | Lower (simpler setup) |
| OPEX | Lower chemical cost per active kg, higher labor/maintenance | Higher chemical cost per active kg, lower labor/maintenance |
| Decision Matrix | Choose if space is limited, labor is available for maintenance, and long-term storage is needed. | Choose if quick deployment, minimal manual intervention, and consistent supply are critical. Consider a PLC-controlled PAM dosing skid for industrial wastewater treatment for liquid systems. |
Real-World Case Study: Textile Plant Cuts Chemical Costs by 30% with Intelligent PAM Dosing
A textile plant in Bangladesh treating 1,500 m³/day of colored, turbid wastewater cut chemical cost by 30% and held discharge limits after moving to an automated PAM dosing train. The site had relied on manual PAC dosing before the upgrade (HydropureWater case study, 2024).
Two problems dominated operations. Effluent TSS averaged 45 mg/L against a 30 mg/L limit, and chemical cost sat near $0.45/m³. Manual PAC swings produced overdosing waste or underdosing failures and raised sludge volume and disposal cost.
The retrofit used inline turbidity sensors at clarifier inlet and outlet with PLC control of PAM dose. Anionic PAM mix speed was capped at 300 RPM, and aging held at 45 minutes. Sensors used auto-calibration routines to limit drift.
Within three months, TSS stayed below 22 mg/L. Chemical cost fell to $0.32/m³, about $70,000/year in polymer spend alone at that flow. Better flocs cut sludge volume by 25%, which lowered disposal cost and eased load on the downstream sludge dewatering press for PAM-generated flocs. Avoided compliance exposure was estimated near $150,000/year in the case record.
Field lessons were narrow: hold shear under the polymer limit, protect aging time, and keep sensors calibrated. Those three items drove most of the OPEX and compliance gain.
How to Select a PAM Dosing System: Cost-Optimized Decision Framework
Selecting a PAM dosing system starts with influent data, then dosing rate, component size, automation level, and vendor lifecycle support. Skipping jar tests is the fastest way to buy the wrong pump and tank set (HydropureWater best practices, 2025).
- Step 1: Define Influent Characteristics. Record TSS range, pH, temperature, and average plus peak flow. High TSS with negatively charged particles often needs cationic PAM; lower pH or positively charged solids may favor anionic PAM. Confirm whether a pH adjustment system for optimal PAM flocculation is required before polymer.
- Step 2: Calculate Required Dosing Rate. Use Q = (C × F) / (1000 × E), where Q is dosing rate (L/h), C is polymer concentration from jar tests (mg/L), F is wastewater flow (m³/h), and E is polymer activity as a fraction (for example 0.1 for 10% activity). Jar tests set C for the actual wastewater, not a catalog default.
- Step 3: Size the System Components. From peak dosing rate and peak flow, size pumps, tanks, and mixers:
- Pump Capacity: Metering pumps should provide 20-30% headroom above peak calculated dose for load swings and future flow growth.
- Tank Volume: Dissolution and aging tanks must support 20-60 minutes aging at peak flow, plus batch reserve. Multi-tank layouts keep continuous feed while one tank ages.
- Mixing Power: Provide enough initial shear for wetting without exceeding polymer limits (for example max 300 RPM for anionic PAM).
- Step 4: Evaluate Automation Needs. Match labor, dose precision, and fine risk to manual, semi-automatic, or full PLC control. A PLC-controlled PAM dosing skid for industrial wastewater treatment with inline sensors usually pays back through lower chemical waste and fewer underdose events.
- Step 5: Assess Vendor Support and Lifecycle Costs. Score warranty, spare parts lead time, training, energy use, and maintenance access. Downtime cost often exceeds a cheaper skid with weak support.
Selection checklist:
- Does the skid include inline turbidity and flow sensors for closed-loop control?
- Can tanks and polymer handle expected temperature swings in the room and in the wastewater?
- Is polymer ionic type compatible with wastewater charge and pH?
- Are wear parts stocked, and is technical support reachable within your maintenance window?
- Can operators calibrate pumps and sensors without specialized tooling?
- Is energy use for mixers and pumps acceptable against the plant OPEX budget?
- Does the design path meet regional compliance standards for PAM dosing systems?
What drives stainless steel process skid cost?
Stainless steel process skid cost is driven mainly by capacity, material grade, instrumentation density, and automation level rather than frame steel alone. For PAM duty, skid-mounted packages in the source range of $20,000 to $100,000 move up when tanks, mixers, and PLC I/O increase with peak L/h dose. Adders include hygienic finishes, explosion-rated electrics where solvents are present, and spare pump redundancy. A compact liquid emulsion skid usually sits lower in that band than a dry-powder train with wetting and aging tanks.
What does an MBBR process flow diagram show?
An MBBR process flow diagram shows screened influent entering a biofilm carrier reactor, then solids separation before discharge or reuse. PAM dosing is not the biological step; it sits upstream or downstream when clarifier or DAF solids need polymer bridging after the carriers. Plants that only need secondary BOD removal may stop at MBBR clarification, while high-TSS industrial trains still size a polymer skid against jar-test dose. If the site is municipal package treatment rather than a polymer-only retrofit, an Underground Package Sewage Treatment Plant (WSZ Series) can house biological stages with separate chemical dosing as required.
How does an MBR process flow diagram differ?
An MBR process flow diagram replaces secondary clarification with membrane solid-liquid separation after biological treatment. PAM may still be used ahead of the membranes or on waste sludge when floc strength improves dewaterability, but dose must stay low enough to avoid membrane fouling. Compared with PAM-plus-clarifier flowsheets, MBR drawings emphasize recirculation, membrane air scour, and permeate pumping rather than flocculation detention of 2-5 minutes. Keep polymer selection tied to sludge handling goals, not as a substitute for membrane integrity.
ROI Calculator: PAM Dosing System Cost-Benefit Analysis for Industrial Facilities
Automated PAM dosing explained in cost terms usually recovers CAPEX through lower chemical use, less sludge mass, and fewer permit exceedances. Procurement teams can walk the same arithmetic with plant-specific inputs (HydropureWater financial model, 2025).
CAPEX for a skid-mounted PAM dosing system commonly spans $20,000 to $100,000 by capacity, materials, and automation. OPEX savings often close that gap inside 1-3 years when sludge and compliance effects are counted.
| ROI Calculation Field | Input/Example Value | Description |
|---|---|---|
| 1. Current Chemical Cost ($/m³) | $0.40 | Cost of current flocculant/coagulant per cubic meter of treated wastewater. |
| 2. Projected PAM Cost ($/m³) | $0.28 | Estimated cost of PAM per cubic meter of treated wastewater after optimization (typically 20-30% reduction). |
| 3. Daily Flow Rate (m³/day) | 1,000 | Average daily volume of wastewater treated. |
| 4. Sludge Disposal Cost ($/ton) | $150 | Cost to dispose of one ton of dewatered sludge. |
| 5. Current Sludge Volume (tons/day) | 5 | Daily volume of sludge generated with current system. |
| 6. Projected Sludge Volume (tons/day) | 3.75 | Daily volume of sludge with PAM (20-40% reduction, here 25%). |
| 7. Compliance Fine Risk ($/year) | $150,000 | Estimated annual cost of potential non-compliance fines. |
| 8. Annual Chemical Savings | $43,800 | (Current Chemical Cost - Projected PAM Cost) × Daily Flow Rate × 365 days |
| 9. Annual Sludge Disposal Savings | $54,750 | (Current Sludge Volume - Projected Sludge Volume) × Sludge Disposal Cost × 365 days |
| 10. Total Annual Savings (OPEX) | $98,550 | Sum of Chemical Savings and Sludge Disposal Savings. |
| 11. Avoided Fines (Compliance Benefit) | $150,000 | Direct financial benefit from consistent compliance. |
| 12. Total Annual Financial Benefit | $248,550 | Total Annual Savings + Avoided Fines. |
| 13. Estimated CAPEX for PAM System | $75,000 | Initial investment for the automated PAM dosing system. |
| 14. Payback Period (Years) | 0.30 | CAPEX / Total Annual Financial Benefit (in this example, less than a year). |
In that worked example, a 1,000 m³/day plant moving from $0.40/m³ to $0.28/m³ saves $43,800/year on chemicals. A 25% sludge cut adds $54,750/year at $150/ton disposal. With $150,000/year compliance exposure removed from the risk register, total annual benefit reaches $248,550 against a $75,000 CAPEX, a 0.30-year payback in the model.
This page is for plant engineers, EPC contractors, and procurement managers sizing polymer preparation and metering on industrial clarifiers or DAF trains. Buyers seeking only biological package plants without a flocculant step should start from biological process selection instead. For a duty-based dosing skid shortlist tied to your flow and jar-test dose, submit the duty data through our request-quote form for PAM dosing system sizing.
Frequently Asked Questions
What mixing speed avoids PAM shear degradation?
Keep anionic PAM at or below 300 RPM and cationic PAM at or below 500 RPM during dissolution. Higher tip speeds break polymer chains and weaken bridging. Use high shear only for the brief wetting step, then drop to gentle mixing for the rest of the batch. Confirm the limit against the polymer data sheet for the grade you stock.
How do I fix incomplete flocculation in PAM dosing?
Incomplete flocculation usually traces to short aging, excess shear, wrong ionic type, or off-spec pH. Hold aging at least 20 minutes, verify mixer RPM, and re-run jar tests when influent chemistry shifts. Check temperature against the 10-40°C solution window. For a deeper fault tree, use the detailed troubleshooting guide for PAM dosing systems.
Can PAM dosing systems treat high-TDS wastewater?
Yes, but TDS above about 5,000 mg/L often needs higher polymer dose or pretreatment because ionic strength weakens charge and bridging. Cationic PAM is frequently stronger in high-TDS streams, yet jar tests still set the grade and dose. Watch viscosity and pump NPSH when concentration rises.
What maintenance does a PAM dosing system need?
Calibrate inline turbidity and flow sensors weekly to keep closed-loop dose accurate. Lubricate and inspect metering pumps monthly for wear and seal leaks. Clean tanks quarterly to limit polymer film and biological growth. On dry powder units, check the wetting unit and screw feeder daily for bridging or blockage.
How does PAM compare with PAC for heavy metal removal?
PAM is a flocculant for TSS and organic solids bridging, not a primary metal precipitant. PAC or ACH usually precipitates dissolved metals first; PAM then enlarges the metal-hydroxide flocs for settling. For metal-heavy wastewater, sequence coagulant then polymer rather than relying on PAM alone.