An MBR system for sewage treatment combines activated-sludge biology with microfiltration or ultrafiltration membranes (pore size 0.1–0.4 µm). Typical permeate quality is TSS < 1 mg/L and BOD < 5 mg/L, while plant footprint is often 50–70% smaller than a conventional activated sludge (CAS) train of the same capacity. Most municipal designs run mixed liquor suspended solids (MLSS) at 8,000–12,000 mg/L and drop the secondary clarifier. The two main layouts are submerged (internal) and side-stream (external) membrane bioreactors, with different energy, cleaning, and capital profiles.
What Is an MBR System for Sewage?
An MBR system for sewage replaces gravity clarification with a 0.1–0.4 µm membrane barrier after biological treatment. Municipal designs typically hold MLSS at 8,000–12,000 mg/L, HRT at 4–12 hours, and SRT at 15–30 days. Permeate is commonly TSS < 1 mg/L, BOD < 5 mg/L, and turbidity < 0.2 NTU, supporting non-potable reuse after site-specific polishing.
Urban plants adopt MBR when land is scarce, discharge limits are tight, or reuse is part of the water balance. In one published municipal example, a 500 m³/day plant in Shanghai cut footprint from about 400 m² to 120 m² after converting to MBR, a roughly 70% space saving versus its prior CAS layout (wateracademia.com). That scale of land release is why brownfield upgrades and dense campuses often shortlist MBR early.
Effluent quality is the other driver. MBR trains routinely hold TSS < 1 mg/L and BOD < 5 mg/L, while CAS without tertiary filtration more often leaves TSS at 10–30 mg/L and BOD at 10–20 mg/L. That gap matters against China GB 18918-2002 Class 1A, EU Urban Waste Water Directive 91/271/EEC, and California Title 22 non-potable reuse pathways. According to US EPA (2016), recycled water from decentralized MBR scenarios can avoid about 0.94–0.96 m³ of drinking water per cubic meter of wastewater treated when reuse displaces potable supply.
Users span municipal sewage works and industries with high organic or pathogen loads. Semiconductor fabs often pair MBR with specialized pretreatment for streams such as TMAH; see semiconductor TMAH wastewater treatment solutions for high-tech sectors. Food processors, hospitals, and pharmaceutical plants also use MBR when CAS settling is unreliable or reuse is planned. Industrial influents usually carry higher COD, BOD, and TSS than domestic sewage, so pretreatment and flux derating become design gates rather than afterthoughts.
| Parameter | MBR Effluent (Typical) | Conventional Activated Sludge (CAS) Effluent (Typical) |
|---|---|---|
| Total Suspended Solids (TSS) | < 1 mg/L | 10–30 mg/L |
| Biochemical Oxygen Demand (BOD₅) | < 5 mg/L | 10–20 mg/L |
| Turbidity | < 0.2 NTU | 2–5 NTU |
| Pathogen Removal (Viruses) | > 6-log | 1–2-log |
| Footprint Reduction vs. CAS | 50–70% | 0% (Baseline) |
How MBR Systems Work: Biology Plus Membrane Separation
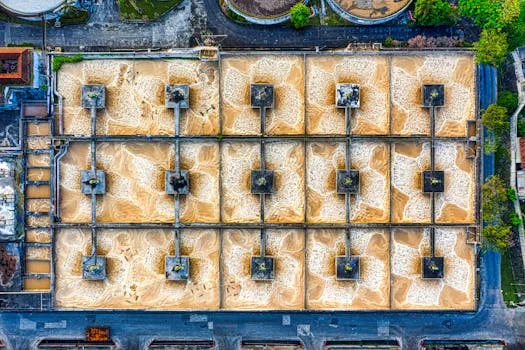
MBR systems couple an activated-sludge reactor with a physical membrane barrier, so solids separation no longer depends on sludge settleability. Wastewater moves through aerobic and anoxic zones where microbes remove organics and nutrients. Because MLSS sits at 8,000–12,000 mg/L rather than the 2,000–4,000 mg/L band common in CAS, HRT can stay in the 4–12 hour window while SRT stretches to 15–30 days for stable nitrifiers.
Membranes replace the secondary clarifier. Microfiltration or ultrafiltration pores of 0.1–0.4 µm retain biomass, suspended solids, and most pathogens. That barrier is more consistent than gravity settling when filaments or high solids upset sludge volume index. HydropureWater’s MBR Membrane Bioreactor Wastewater Treatment System packages this biology-plus-membrane train for municipal and industrial sewage in a compact footprint.
Two hydraulic layouts dominate. Submerged MBR immerses modules in the aeration tank and pulls permeate by suction; it is the default for many municipal plants because air scour doubles as mixing and energy use is lower. Side-stream MBR pumps mixed liquor through an external membrane loop at higher cross-flow shear. Plants with sticky industrial solids or aggressive cleaning needs often prefer the external loop even though recirculation power rises. HydropureWater DF series PVDF flat sheet membrane modules for MBR applications are used in both layouts when flat-sheet packing and chemical resistance are specified.
Membrane polymer choice sets chemical and mechanical limits. Polyvinylidene fluoride (PVDF) is the workhorse for municipal service, with typical service lives of 5–10 years when pretreatment and cleaning stay on schedule. Polyethylene (PE) modules can be cost-effective on milder feeds. Ceramic membranes suit harsh industrial chemistry at higher capital cost. Under submerged modules, coarse-bubble scour at about 0.2–0.5 Nm³/m²·h keeps cake from locking onto the surface while also feeding oxygen demand.
Most plants we size for municipal sewage run toward the lower end of the municipal flux band once peak-day and winter viscosity are booked. Over-optimistic design flux is the fastest path to chronic high transmembrane pressure (TMP) and emergency cleans.
MBR Engineering Specs: Design Parameters and Effluent Ranges
Municipal sewage MBR designs usually start from influent COD 250–800 mg/L, BOD 150–400 mg/L, TSS 100–350 mg/L, total nitrogen (TN) 20–85 mg/L, and total phosphorus (TP) 4–15 mg/L. Those envelopes shift upward for food, pharma, or combined industrial contributions, so jar tests and pilot flux trials matter before freezing membrane area.
Permeate targets remain tight across that influent band: TSS < 1 mg/L, BOD < 5 mg/L, turbidity < 0.2 NTU, and often > 6-log virus removal when integrity is maintained. That quality is why MBR permeate is a common feed to UV or RO for higher-tier reuse rather than a polishing problem after clarifiers.
Membrane design knobs include pore size 0.1–0.4 µm, municipal flux about 15–30 LMH, industrial flux about 10–20 LMH, and sustainable TMP roughly 0.1–0.5 bar. Chemical cleaning every 3–6 months is typical for well-screened municipal feeds; dirty industrial feeds can shorten that interval. OEM datasheets—not generic catalog pages—govern module-specific limits for flux, TMP, pH, and oxidant dose when comparing products such as Toray hollow-fiber lines against flat-sheet PVDF cassettes.
Biology setpoints follow the same high-solids logic: MLSS 8,000–12,000 mg/L, F/M about 0.05–0.15 kg BOD/kg MLSS·d, SRT 15–30 days, and HRT 4–12 hours. Energy use is configuration-dependent. Submerged trains commonly land near 0.6–1.2 kWh/m³; side-stream trains often sit at 1.5–3.0 kWh/m³ because of recirculation pumps (wateracademia.com). According to US EPA (2016), unit energy demand falls as plant scale rises, and aerobic MBR scenarios that credit displaced potable water can show net energy benefits starting near the 1 MGD (~3,785 m³/day) scale under the study assumptions.
| Parameter Category | Specific Parameter | Typical MBR Range |
|---|---|---|
| Influent Characteristics (Municipal Sewage) | COD | 250–800 mg/L |
| BOD | 150–400 mg/L | |
| TSS | 100–350 mg/L | |
| Total Nitrogen (TN) | 20–85 mg/L | |
| Total Phosphorus (TP) | 4–15 mg/L | |
| Effluent Quality (Typical) | TSS | < 1 mg/L |
| BOD | < 5 mg/L | |
| Turbidity | < 0.2 NTU | |
| Pathogen Removal (Viruses) | > 6-log | |
| Membrane Specifications | Pore Size | 0.1–0.4 µm |
| Flux Rate (Municipal) | 15–30 LMH | |
| Flux Rate (Industrial) | 10–20 LMH | |
| Transmembrane Pressure (TMP) | 0.1–0.5 bar | |
| Operational Parameters | Mixed Liquor Suspended Solids (MLSS) | 8,000–12,000 mg/L |
| F/M Ratio | 0.05–0.15 kg BOD/kg MLSS·d | |
| Sludge Retention Time (SRT) | 15–30 days | |
| Hydraulic Retention Time (HRT) | 4–12 hours | |
| Chemical Cleaning Frequency | Every 3–6 months | |
| Energy Consumption | Submerged MBR | 0.6–1.2 kWh/m³ |
| Side-Stream MBR | 1.5–3.0 kWh/m³ |
Submerged vs. Side-Stream MBR: Comparison and Decision Framework
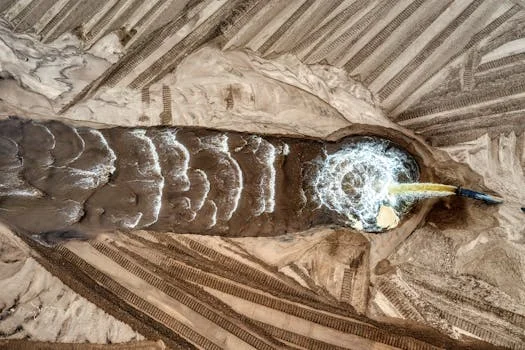
Submerged versus side-stream selection hinges on influent solids, fouling risk, available footprint, and who will maintain the plant. Both configurations can meet the same permeate specs when membranes stay within design TMP. The differences show up in energy, piping, and how cleaning is staged.
| Parameter | Submerged MBR | Side-Stream MBR |
|---|---|---|
| Footprint | Very compact (membranes in bioreactor) | Slightly larger (external membrane tank) |
| Energy Consumption | Lower (0.6–1.2 kWh/m³), primarily for aeration | Higher (1.5–3.0 kWh/m³), includes recirculation pumps |
| CAPEX | Generally lower (simpler pumping, less piping) | Higher (external pumps, more complex piping) |
| OPEX | Lower (less energy, easier maintenance) | Higher (more energy, potentially more complex maintenance) |
| Membrane Fouling Risk | Moderate (coarse bubble aeration for scouring) | Lower (higher shear, backwash capabilities) |
| Maintenance Complexity | Simpler (modules easily accessible, in-situ cleaning) | More complex (external loop, more pumps/valves) |
| Scalability | Good (add more modules to existing tanks) | Good (add more external membrane units) |
| Effluent Quality | Excellent | Excellent |
| Suitability (Typical) | Municipal sewage, domestic wastewater, space-constrained sites, water reuse. | Industrial wastewater with high TSS/COD, variable loads, specific fouling potential. |
| Chemical Cleaning Frequency | Every 3–6 months | Every 1–3 months (more aggressive cleaning possible) |
Use this checklist before freezing the process flow diagram:
- Influent screen and solids: Stable municipal sewage with moderate TSS usually favors submerged MBR. High FOG, fibrous solids, or sharp industrial spikes push toward stronger pretreatment and sometimes a side-stream loop.
- Effluent and reuse class: Both layouts can deliver reuse-grade turbidity and TSS; integrity testing and UV/RO polishing decide potable-adjacent duties, not the tank arrangement alone.
- Footprint: When civil area is the binding constraint, submerged modules inside the bioreactor remain the densest option.
- CAPEX vs OPEX: Submerged plants usually bid lower on pumps and pipe racks. Side-stream plants can still win if offline cleaning without draining the biology is worth the recirculation power.
- Maintenance culture: In-situ cassette lifts suit plants with crane access and trained operators. External skids suit sites that want membrane work outside the aeration tank.
- Peak flow strategy: Confirm wet-weather or batch-dump peaks against maximum allowable flux and equalization volume before cutting membrane area.
A dense urban municipal plant with steady domestic sewage almost always starts as submerged MBR. A pharmaceutical batch plant with variable COD and solvent traces more often keeps membranes outside the biology so cleaning chemistry stays aggressive without shocking the biomass.
What Does an MBR Wastewater Treatment Plant Cost?
MBR wastewater treatment plant cost is driven by capacity, configuration, pretreatment depth, and civil scope. For submerged municipal packages, indicative CAPEX ranges are about $0.8M–$1.5M at 500 m³/day, $1.5M–$3.0M at 2,000 m³/day, and $5.0M–$10.0M at 10,000 m³/day; side-stream trains of the same flow often bid higher because of external pumps and pipework.
Those ranges cover equipment, tanks, installation, and commissioning at a mid-complexity site. Membrane modules, bioreactor volume, blowers, and permeate pumps dominate equipment spend. Civil cost drops versus CAS because clarifiers disappear, yet excavation, buildings, and electrical rooms still move the total. A community of about 2,500 people at 150–200 L/person·day produces roughly 375–500 m³/day, which maps nearest the 500 m³/day CAPEX band above when equalization and fine screening are included.
For budgeting per megalitre per day (MLD), 1 MLD equals 1,000 m³/day. Interpolating the table below puts many submerged municipal projects on the order of several million USD per MLD before local labor, import duties, or desert climate packages are layered on. Saudi or other GCC bids should start from these engineering envelopes, then apply regional civil rates, power tariffs, and redundancy rules rather than a single “per MLD” sticker price.
CAPEX Breakdown
Equipment, civil works, installation, and commissioning make up CAPEX. Membranes, tanks, pumps, and aeration usually lead the equipment line. Site geotech, building finishes, and electrical switchgear can swing totals as much as the membrane brand. Phased modular trains reduce day-one capital when future population growth is uncertain.
OPEX Breakdown
OPEX is mostly energy, membrane replacement, cleaning chemicals, labor, and sludge handling. Energy alone spans about 0.6–3.0 kWh/m³ depending on submerged versus side-stream duty. Membrane replacement every 5–10 years at roughly $50–$150/m² of membrane area annualizes into a visible line item. Citric acid and sodium hypochlorite cleans every few months add chemical cost. Municipal total OPEX often lands near $0.20–$0.60 per cubic meter treated; at 1,000 m³/day that is about $73,000–$219,000 per year.
| Cost Category | Submerged MBR (Typical Ranges) | Side-Stream MBR (Typical Ranges) |
|---|---|---|
| CAPEX (Total Plant Cost) | ||
| 500 m³/day Plant | $0.8M – $1.5M | $1.0M – $2.0M |
| 2,000 m³/day Plant | $1.5M – $3.0M | $2.0M – $4.0M |
| 10,000 m³/day Plant | $5.0M – $10.0M | $6.0M – $12.0M |
| OPEX (Per m³ Treated Water) | ||
| Energy Consumption | 0.6–1.2 kWh/m³ | 1.5–3.0 kWh/m³ |
| Membrane Replacement (annualized) | $0.05–$0.15/m³ | $0.07–$0.20/m³ |
| Chemical Cleaning | $0.01–$0.03/m³ | $0.02–$0.05/m³ |
| Labor & Maintenance | $0.05–$0.10/m³ | $0.07–$0.12/m³ |
| Total OPEX (Typical) | $0.20–$0.40/m³ | $0.30–$0.60/m³ |
How Do MBR and CAS Capital and Operating Costs Compare?
MBR versus CAS capital and operating cost evaluation should use equal effluent quality, not equal secondary-only trains. MBR CAPEX is often higher for membranes and controls, yet CAS needs larger tanks, clarifiers, and frequently tertiary filters or disinfection to approach MBR turbidity and pathogen performance. Land value and reuse credits can erase much of the day-one premium on constrained sites.
On operating cost, submerged MBR energy at 0.6–1.2 kWh/m³ usually exceeds simple CAS aeration, while side-stream duty at 1.5–3.0 kWh/m³ widens the gap further. Against that, MBR avoids clarifier polymers, cuts sludge mass through longer SRT, and can monetize reuse. For a 1,000 m³/day plant (365,000 m³/year), reclaiming 500 m³/day of potable offset at $1.50/m³ yields about $273,750 per year before counting avoided non-compliance penalties. Field payback periods of roughly 3–7 years appear when land savings and reuse both apply (HydropureWater project evaluations). For a broader plant-cost walkthrough, see detailed cost breakdowns for wastewater treatment plants in 2025.
ROI Checklist
- Footprint and land: Price the square meters released versus CAS clarifiers and tertiary filters.
- Reuse value: Credit displaced potable or process water at the local tariff.
- Compliance risk: Quantify fines or forced shutdowns if CAS cannot hold the permit without add-ons.
- Sludge and upsets: Longer SRT and membrane solids capture usually stabilize operations versus bulking events.
Cost-Saving Levers
Strong pretreatment pays first. Fine screens plus a rotary mechanical bar screen cut ragging and protect membrane life. Energy-efficient blowers, DO control, and VFDs on pumps trim the largest OPEX line. Modular cassette additions defer CAPEX until flow actually arrives. An integrated MBR Membrane Bioreactor Wastewater Treatment System can also reduce field piping and commissioning hours on mid-size municipal packages.
Common MBR Challenges and Practical Fixes
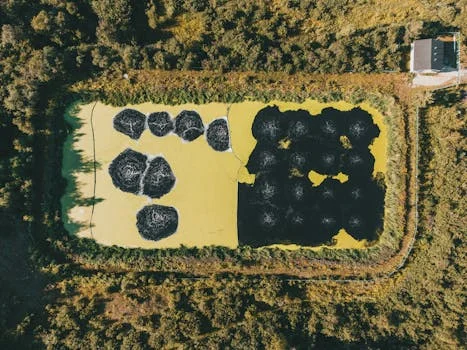
Membrane fouling remains the daily fight: organic gels, inorganic scale, and biofilms all raise TMP. Countermeasures are coarse-bubble scour, scheduled relaxation or backwash, citric acid or NaOCl recovery cleans, and upstream solids removal. Industrial FOG loads often need Dissolved Air Flotation (DAF) before the bioreactor so the membrane never becomes the grease trap.
Energy use tracks aeration and pumping. High-efficiency blowers, intermittent aeration where process allows, and honest flux design keep kWh/m³ inside the submerged 0.6–1.2 band. Chasing peak flux without equalization simply moves cost from CAPEX into power and chemical cleans.
Integrity failures show up as turbidity spikes or failed pressure-decay tests. Avoid hydraulic shocks, keep TMP inside 0.1–0.5 bar for routine duty, and document every chemical clean. Waste sludge from high-MLSS reactors is denser; a plate and frame filter press for sludge dewatering cuts haulage volume before disposal.
Who This Is For / Next Step
This guide is for plant engineers, EPC process leads, and procurement teams comparing MBR against CAS for municipal sewage or high-strength industrial wastewater when footprint, reuse, or tight TSS/BOD limits dominate the decision. Look elsewhere if the site has abundant land, loose secondary-only permits, and no reuse case—CAS with simple tertiary polish may still win on power alone. If you need a capacity-matched CAPEX/OPEX sheet for a defined influent, request a sizing review through our project inquiry form with flow, COD/BOD/TSS, and reuse targets.
Frequently Asked Questions
What is the typical lifespan of MBR membranes?
PVDF MBR membranes typically last 5–10 years when fine screening, air scour, and chemical cleaning stay within design limits. Feed quality and recovery-clean discipline move a plant toward the low or high end of that band. Ceramic modules can run longer in harsh chemistry but cost more up front.
What does an MBR plant cost for about 2,500 people?
At 150–200 L/person·day, 2,500 people produce roughly 375–500 m³/day of sewage. That capacity aligns with submerged CAPEX near $0.8M–$1.5M and side-stream CAPEX near $1.0M–$2.0M for mid-complexity sites, excluding unusual civil or import premiums. Equalization, fine screens, and sludge handling must be priced separately if not in the package.
How do MBR and CAS operating costs differ?
Submerged MBR energy often runs 0.6–1.2 kWh/m³ versus lower CAS aeration when no tertiary filters are counted. Municipal MBR total OPEX commonly falls around $0.20–$0.40/m³ for submerged duty and $0.30–$0.60/m³ for side-stream duty. Fair comparisons add CAS tertiary filtration, disinfection, and land when reuse-grade effluent is required.
Is pre-treatment necessary for an MBR system?
Yes. Fine screens of about 1–3 mm are standard to keep rags and grit off the membrane surface. Industrial plants may also need DAF, grease traps, or coagulation before biology. Weak pretreatment shortens membrane life faster than any other O&M mistake we see in the field.
How does MBR support water reuse?
MBR permeate with TSS < 1 mg/L, BOD < 5 mg/L, and turbidity < 0.2 NTU already meets many non-potable reuse thresholds for irrigation, process water, or toilet flushing after local disinfection rules are checked. According to US EPA (2016), decentralized MBR reuse can avoid about 0.94–0.96 m³ of drinking water per cubic meter treated when potable displacement is credited. Higher-tier reuse still needs UV, RO, or advanced oxidation as the permit requires.