Industrial ozone generator specifications for water treatment cover output capacity, feed-gas type, specific energy, cooling duty, and CT-based disinfection credit. Corona-discharge units span about 5 g/h for compact skids to 20,000 g/h for large municipal trains. Oxygen-fed packages typically draw 8–12 kWh/kg O₃, while air-fed units often need 16–20 kWh/kg O₃ under comparable duty. Cooling water is commonly sized at 3–10 L/min per kW of generator power when liquid-cooled cells are used, and corona-cell service life is usually quoted at 5,000–10,000 hours when feed-gas dew point stays below −60°C.
Ozone Generator Specifications for Capacity and Dose
Ozone generator capacity for water treatment is set by peak flow (m³/h), measured ozone demand (mg/L), and the CT residual needed for the target log credit. Output is quoted in g/h or lb/day on a stated feed gas. Oxygen-fed corona units typically deliver 6–12% wt O₃ at 8–12 kWh/kg O₃; air-fed units stay near 1–3% wt at 16–20 kWh/kg O₃.
Why Spec Mismatch Causes Disinfection Failures
Operational failures in ozone disinfection often start when generator output is matched to flow alone and ignores influent chemical oxygen demand (COD). In one industrial audit, a municipal plant treating 2,000 m³/h of secondary effluent saw about 30% E. coli exceedances while the ozone stage ran at 100% capacity. The installed 100 g/h unit could not overcome an influent COD of 300 mg/L, which acted as an ozone sink before pathogens received adequate contact time.
According to EPA pathogen CT practice for wastewater and drinking-water disinfection, organisms such as Escherichia coli and Salmonella need defined concentration × time values for inactivation. In that audit case, residual contact time fell below 0.2 mg/L·min, well under the 4–10 mg/L·min band often used for roughly 99% bacterial kill under plant conditions. Emergency chlorine make-up rose about 40%, raising trihalomethane (THM) formation and regulatory exposure.
The same undersized train then ran at maximum voltage almost continuously. Corona cells fouled early, and dielectric failure followed within six months. Most plants we size for industrial COD spikes run dose trials at the lower end of the generator turndown band first, then add spare capacity for peak ozone demand rather than relying on continuous full-load duty.
What Is the Working Principle of Ozone Generators?
Industrial ozone generators for water treatment produce O₃ mainly by corona discharge: high-voltage alternating current across a dielectric gap splits O₂, and roughly 80–90% of the electrical energy becomes heat rather than ozone. That heat load makes cooling water temperature and flow part of the process design, not an accessory. Ambient-air or PSA oxygen feed, dew-point control, and cell materials determine both concentration and specific energy.
| Capacity Range (g/h) | Feed Gas Type | Energy Consumption (kWh/kg O₃) | Cooling Water Flow (L/min) | Footprint (m²) |
|---|---|---|---|---|
| 5–50 (Compact) | Ambient Air / PSA O₂ | 16–22 (Air) / 9–12 (O₂) | 0.5–2.0 (or Air Cooled) | 0.2–0.5 |
| 50–500 (Industrial) | PSA Oxygen (90%+) | 8–12 | 3–10 per kW | 1.0–2.5 |
| 500–20,000 (Municipal) | Liquid O₂ / High-Cap PSA | 7–10 | 10–50 per kW | 5.0–25.0+ |
Oxygen-fed generators are typically 2–3× more energy-efficient than air-fed systems because nitrogen is largely removed, cutting NOx formation and wasted ionization energy. For healthcare polishing duty, a compact ozone disinfection system for healthcare wastewater often uses air cooling or a closed-loop chiller so cell temperature stays controlled. Keep cooling-water inlet below about 35°C; above that threshold, ozone yield can fall by as much as 20% from thermal decomposition. Corona cells commonly last 5,000–10,000 hours, and high-quality dielectric tubes can reach about 15,000 hours when dew point remains below −60°C.
For packaged tank or reuse loops, an Ozone Generator & Water Tank Sterilization System pairs generator output with contact volume so residual and off-gas destruct stay inside the same skid boundary. At municipal scale, published EPA project data still cite generators near 6,380 lb/day, where a 1 kWh/kg efficiency gain can shift annual power cost by tens of thousands of dollars.
Matching Generator Capacity to Water Quality
Required generator output (g/h) equals flow rate (m³/h) × target dosage (mg/L) after the matrix ozone demand is known from bench or pilot tests. A 1,000 m³/h stream that needs 2 mg/L for color removal therefore needs at least 2,000 g/h of deliverable ozone at the design feed-gas purity. Always state whether the quoted g/h figure is on air or on 90%+ oxygen.
| Contaminant Target | Typical Ozone Dose (mg/L) | Required Contact Time (min) | Efficiency Improvement via Pre-treatment |
|---|---|---|---|
| Bacteria (E. coli) | 0.5–1.5 | 2–5 | High (TSS removal) |
| Viruses / Giardia | 2.0–4.0 | 5–10 | Moderate |
| Iron (Fe) / Manganese (Mn) | 0.4 per mg/L Fe; 0.9 per mg/L Mn | 3–6 | Critical (Filtration) |
| COD / TOC Reduction | 1.5–3.0 per mg/L COD removed | 15–30 | Essential (DAF system for pre-ozone solids removal) |
Pre-treatment is still the cheapest way to cut generator size. High TSS shields pathogens and burns ozone on non-target solids. A pressure flotation system for pre-ozone solids removal can cut the needed ozone dose by up to 50% when it removes organic solids before the contactor. That often allows a smaller generator and lower power draw.
Bromate control belongs in the same sizing memo. Where bromide is present, ozone can form bromate (BrO₃⁻). The EPA drinking-water MCL remains 10 µg/L. Mitigation options used on plants we support include pH control below about 6.5 and ammonia addition to limit hypobromite oxidation. For wastewater discharge questions around dose versus residual, see also ozone out put acceptable level on waste water.
Oxygen-Fed vs Air-Fed Generators
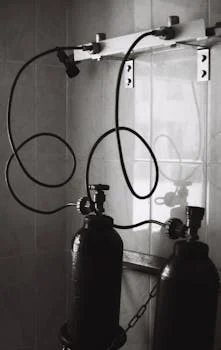
Air-fed ozone generators keep CAPEX lower because they need only a compressor and dryer, but they produce 1–3% wt ozone and form nitric acid quickly if the air is not dry. Oxygen-fed trains raise concentration to 6–12% wt and cut specific energy roughly in half, at the cost of PSA or liquid oxygen supply.
| Parameter | Oxygen-Fed (PSA or Liquid) | Air-Fed (Ambient/Compressed) | Notes |
|---|---|---|---|
| Ozone Concentration | 6–12% wt | 1–3% wt | O₂-fed allows smaller contact tanks |
| Energy Efficiency | 8–12 kWh/kg | 16–22 kWh/kg | EPA data confirms 50% energy reduction |
| Maintenance Interval | 8,000+ hours | 2,000–4,000 hours | Air-fed requires frequent dryer service |
| Operating Cost | Lower (High Efficiency) | Higher (Low Efficiency) | O₂-fed requires oxygen supply cost |
| Best For | Industrial / Municipal | Small Scale / Low Budget | PSA O₂ is common for mid-range |
Large-flow plants usually recover the oxygen-supply cost through power savings. A municipal plant in Barcelona treating about 5,000 m³/h moved from air-fed to oxygen-fed duty and reported about 40% lower energy use and a 30% smaller footprint. Higher gas-phase concentration (about 10% vs 2% wt) also improved Venturi mass transfer and reduced contactor volume.
PSA oxygen at 90–95% purity is the usual mid-market feed. Those systems typically need about 10 m³ of compressed air per 1 m³ of product oxygen. If dew point rises above −60°C, residual nitrogen plus moisture can form nitric acid and attack stainless corona hardware.
Regulatory Compliance for Ozone Water Treatment
Regulatory compliance for ozone systems is judged by pathogen log credit and disinfection by-product control, not by generator brand alone. Ozone leaves little lasting residual in a distribution network, so plant CT and DBP limits drive the design envelope.
| Region | Standard | Target Pathogen Reduction | Bromate Limit (µg/L) | Residual Monitoring |
|---|---|---|---|---|
| United States | EPA Safe Drinking Water Act | 4-log Virus / 3-log Giardia | 10 µg/L | Required (ORP or Amperometric) |
| Global | WHO Guidelines | 99.99% Inactivation | 10 µg/L | 0.5 mg/L recommended |
| European Union | Directive 2020/2184 | Varies by Member State | 10 µg/L (5 µg/L goal) | Strict DBP monitoring |
| China | GB 5749-2022 | Standardized Disinfection | 10 µg/L | Mandatory daily testing |
According to 40 CFR 141.72 (eCFR current through September 2026), filtered and unfiltered surface-water systems must achieve at least 3-log (99.9%) Giardia lamblia and 4-log (99.99%) virus inactivation and/or removal. EPA CT tables still list about 1.43 mg/L·min of ozone CT for 3-log Giardia at 10°C (pH 6–9). At 0.5 mg/L residual ozone, that equals roughly 2.86 minutes of effective contact time.
According to the OSHA PEL cited in the NIOSH Pocket Guide, workplace ozone is limited to 0.1 ppm (0.2 mg/m³) as an 8-hour TWA, so off-gas destruct and ambient monitors are mandatory. Thermal or catalytic destruct units convert unused O₃ back to O₂ before venting. Food-plant wash-water duty needs the same CT and DBP discipline; ozone treatment for food processing wastewater guidance keeps pathogen and DBP limits aligned with product-contact rules.
Selection Framework: Seven Engineering Steps
Selecting an industrial ozone generator follows a fixed sequence so the train is neither undersized nor overbought:
- Define water-quality goals: disinfection log credit, Fe/Mn/COD oxidation, or micropollutant polish.
- Measure ozone demand: bench or pilot dose to the required residual, not a catalog rule of thumb.
- Use peak hourly flow (m³/h): size for the peak hour, not average daily flow.
- Choose feed gas: oxygen-fed (PSA or LOX) above about 100 m³/h or for high COD; air-fed only for small, budget-limited duties.
- Lock generator technology: corona discharge for industrial scale; compare glass versus ceramic dielectrics.
- Check site constraints: cooling-water temperature, footprint, and whether high-frequency power density is needed.
- Compare five-year TCO: energy, oxygen, dielectric kits, and destruct catalyst—not purchase price alone.
Procurement red flags: reject quotes that omit feed-gas purity. A “100 g/h” unit on 90% O₂ may deliver only about 30 g/h on air. Confirm an integrated destruct unit and at least 12 months of corona-cell warranty. Validate CT with EPA ozone CT tables before purchase.
What Does an Industrial Ozone Generator Cost?
Industrial ozone generator cost is dominated by energy and maintenance over five years, not by the purchase invoice. Energy often accounts for 50–70% of lifecycle cost, while capital is roughly 20–30%.
| Generator Capacity (g/h) | Estimated Capital Cost ($) | Annual Operating Cost ($) | 5-Year TCO ($) | Cost per kg O₃ Produced ($) |
|---|---|---|---|---|
| 50 g/h | $8,000 – $15,000 | $1,200 – $2,500 | $14,000 – $27,500 | $3.50 – $5.00 |
| 500 g/h | $30,000 – $60,000 | $8,000 – $15,000 | $70,000 – $135,000 | $2.00 – $3.50 |
| 5,000 g/h | $120,000 – $250,000 | $45,000 – $90,000 | $345,000 – $700,000 | $1.20 – $2.10 |
Payback Period (years) = Capital Cost / Annual Savings. A plant replacing liquid chlorine with a $100,000 ozone package and saving $30,000 per year in chemical and hazmat handling sees about a 3.3-year payback. In states with tight discharge permits, such as Minnesota’s MPCA ozone compliance benchmarks, avoided fines can shorten that period. Budget also for cooling-water conditioning, dielectric spares, and ambient ozone sensor calibration. An industrial laundry in the Midwest reported about 60% lower chemical cost and a 2-year payback after replacing bleach cycles with high-concentration ozone.
Troubleshooting Five Common Generator Failures
Low ozone output, high energy draw, and short cell life almost always trace back to wet feed gas, weak cooling, or poor contactor hydraulics. Start diagnostics at the dew-point reading before opening the power cabinet.
| Symptom | Probable Cause | Recommended Action |
|---|---|---|
| Low Ozone Output | High feed gas dew point; cell fouling | Replace desiccant; clean corona cell with IPA |
| High Energy Draw | Insufficient cooling; aged dielectric | Check cooling water flow/temp; replace tubes |
| Ozone Leak Detected | Fittings loose; destruct unit failed | Pressure test lines; replace catalyst in destruct unit |
| Short Cell Lifespan | Oil/dust in gas; voltage spikes | Install 0.01 micron filters; check power stabilizer |
| Inconsistent Kill Rate | Short-circuiting in contact tank | Add baffles; check Venturi injector for clogs |
Keep dew point below −60°C with a calibrated hygrometer. Weekly checks should cover leak tests and cooling flow. Annual work should replace dielectrics and calibrate the destruct unit. Never store ozone with chlorine in the same tank; earlier EPA guidance noted chlorate formation risk when the two oxidants are mismanaged together.
Who This Is For and Next Step
Plant engineers, EPC process leads, and procurement teams use this selection guide when sizing corona-discharge ozone for municipal or industrial water. Look elsewhere if you only need UV ozone under about 10 g/h or a consumer air-cleaner device. When flow, COD, and CT targets are ready, request a duty-specific sizing review through our ozone generator inquiry form with peak flow, feed-gas preference, and residual goals listed.
Frequently Asked Questions
What is the difference between corona discharge and UV ozone generators?
Corona discharge, used in roughly 90% of industrial water systems, splits O₂ with high-voltage electrodes and typically reaches 1–10% conversion efficiency. UV generators use 185 nm lamps and usually deliver only 0.1–0.5% efficiency, so they suit duties under about 10 g/h. UV hardware is simpler, but it lacks the mass-transfer power needed for large-scale disinfection contactors.
How do I calculate the ozone dose for my wastewater?
Required output (g/h) = Flow (m³/h) × Target dose (mg/L) after ozone demand is measured. For wastewater, add matrix demand—often about 0.5 mg/L O₃ per 100 mg/L COD—to the disinfection residual, commonly 1.0–2.0 mg/L. Always state whether the generator rating is on air or on 90%+ oxygen.
What is the lifespan of an ozone generator?
Corona cells typically last 5,000–10,000 hours, and dielectric tubes last about 10,000–15,000 hours under clean feed gas. Life shortens quickly if dew point rises above −60°C or if cooling-water hardness exceeds about 100 ppm as CaCO₃. Oxygen purity at 90%+ O₂ usually extends cell life versus ambient air feed.
Can ozone generators treat pharmaceutical wastewater?
Yes, but recalcitrant organics often need 5–10 mg/L ozone and longer contact times than municipal disinfection. A practical layout uses an MBR system for pharmaceutical wastewater pre-treatment to cut bulk COD before ozone polishing. Confirm bromate risk if bromide is present in the source water.
How do I dispose of ozone off-gas safely?
Route unused ozone through a destruct unit before venting. Thermal units typically hold gas near 350°C for about 3 seconds; catalytic units using MnO₂ or palladium often operate at 50–100°C. Keep ambient monitors tied to the OSHA PEL of 0.1 ppm as an 8-hour TWA so occupied areas stay inside the workplace limit.