Gauteng Municipal Sewage Treatment Plant Upgrade Costs
Gauteng municipal sewage treatment plant upgrade costs for an existing works usually fall between R15–45/m³ of daily capacity. A new plant typically costs R30–80/m³ of daily capacity. An MBR retrofit is typically R40–80/m³, and DAF pretreatment R10–25/m³ at design flow.
Quoted Gauteng municipal sewage treatment plant upgrade costs leave out permitting delay, community opposition and a deferred-maintenance backlog. Most Gauteng retrofits we price sit in the lower half of R15–45/m³ when the concrete is sound and only aeration and clarification are rebuilt. A collapsed clarifier or a new inlet works pushes the same site toward the top of that band. The rand figures below are capital per cubic metre of installed daily capacity, not rand per cubic metre treated in a year.
Operating cost uses a different unit. Energy is typically 0.3–0.6 kWh/m³ of wastewater treated. Chemical dosing is typically R2–5/m³. Sludge disposal is often R500–1,200/ton, and the tonne rate moves with cake dryness and haul distance. Biogas from sludge digestion can return about 0.3–0.5 kWh/m³ of treated wastewater, which is why a digester is judged on payback, not on the capital band alone.
| Cost Component | Typical Range (ZAR) | Notes |
|---|---|---|
| CAPEX (New Plant) | R30–80 / m³ | Varies significantly by technology and scale. |
| CAPEX (Upgrade/Retrofit) | R15–45 / m³ | Focus on improving existing infrastructure. |
| CAPEX (MBR Retrofit) | R40–80 / m³ | High-performance, compact solution. |
| CAPEX (DAF Pretreatment) | R10–25 / m³ | Effective for high-TSS influent. |
| OPEX (Energy) | 0.3–0.6 kWh / m³ | Can be offset by biogas energy recovery. |
| OPEX (Chemicals) | R2–5 / m³ | For disinfection, coagulation, etc. |
| OPEX (Sludge Disposal) | R500–1,200 / ton | Highly dependent on dewatering efficiency and transport. |
What drives the rand per cubic metre?
The rand per cubic metre moves first with how far today's flow and effluent sit from the licence, not with the equipment brand. Use the seven drivers below before a council number is frozen. A national build-up with a compliance and return calculator is in Wastewater Treatment Plant Cost in South Africa 2026: Engine.
- Installed daily capacity, and the share by which inflow exceeds design.
- The gap between current ammonia and phosphorus and the licence limit.
- Path choice: civil repair, DAF pretreatment at R10–25/m³, or an MBR retrofit at R40–80/m³.
- Sludge haulage at R500–1,200/ton after the dewatering step.
- Power at 0.3–0.6 kWh/m³, minus any biogas credit of 0.3–0.5 kWh/m³.
- Sewer spillage and vandalism, which turn a works-level upgrade into a network programme.
- Permitting time and the maintenance backlog, which the unit rate does not include.
Funding sources include DWS grants, Green Drop-linked incentives for improved performance, and private-sector partnerships. Biogas energy recovery often shows a payback of 3–7 years, compliance-driven upgrades often show a return in 5–10 years, and water reuse initiatives can return value in 4–8 years. Those clocks start only after commissioning. Tshwane's system collapse is the worked example of a backlog the unit rate misses: deferred maintenance, a long licence renewal and community opposition cost more than the mechanical package, so price them as separate lines.
Gauteng's Sewage Treatment Crisis: 2025 Data Snapshot
Gauteng's municipal sewage works are failing faster than they are being fixed. According to the 2025 Green Drop Report, released on 31 March by the Department of Water and Sanitation, half of Johannesburg's six wastewater treatment works fall in the critical condition category, requiring national intervention. Tshwane's system collapse has led to extensive raw sewage pollution. Nationally, only approximately 125 out of South Africa's 955 municipal wastewater treatment plants are operating efficiently, so the DWS effluent standards most upgrades chase, COD below 75 mg/L and TSS below 25 mg/L, are being missed province-wide.
| Municipality/Region | Report/Source | Key Findings | Impact |
|---|---|---|---|
| Johannesburg | Green Drop Report 2025 | 50% of plants in critical state. Total design capacity: 1.1 billion L/day. | Risk of untreated sewage discharge, potential waterborne disease outbreaks. |
| Tshwane | DWS / Media Reports (2026) | System collapse leading to raw sewage pollution. | Severe health risks to residents, environmental degradation. |
| Emfuleni Municipality | DWS / Court Cases (2025) | Persistent raw sewage discharge into the Vaal River. | Major pollution of a key water source, ecological damage, public health concerns. |
| South Africa (National) | DWS / Industry Analysis (2025) | ~125 out of 955 plants operating efficiently (~13%). | Widespread non-compliance, strain on water resources, significant environmental burden. |
The health and environmental consequences are measurable. E. coli levels in Gauteng rivers often exceed safe limits, creating risks of cholera outbreaks and damaging aquatic ecosystems. Municipalities face fines for non-compliance of up to R10 million per incident under the National Environmental Management Act (NEMA). Failing infrastructure also deters tourism and raises healthcare expenditure through waterborne disease. Against other provinces, Gauteng's position shows a national problem: only a small fraction of plants meet efficiency standards.
Three named Johannesburg works show how fast a score can fall.
green drop report 2025 johannesburg plant failure
Johannesburg plant failure in the 2025 Green Drop Report is not one bad works, it is half a fleet. Of the metro's six wastewater treatment works, half fall in the critical condition category, requiring national intervention. The metro's most recent score is 48.8%, in the poor performance category (GroundUp, 2026). The six plants were designed for about 1.1 billion litres of sewage per day, and half of them now sit in the worst band at the same time.
Earlier guidance in this series treated a Green Drop score of 90% or higher as the top band and a score below 50% as critical risk. The 2025 public reading puts the whole Johannesburg metro at 48.8%, just inside that lower band. A works-level score is what moves a plant onto an intervention list, so tender documents should quote the works score, not the metro average.
Most Johannesburg plants we size for this metro still have reactors in the ground. The failure is usually maintenance, screens, aeration and clarifier collectors, not an empty site. Half a fleet in critical state means three works need intervention at once, and the budget has to price all three concurrently, or the fourth failure arrives before the first repair is commissioned.
Technical Specifications of Gauteng's Municipal Sewage Treatment Plants
Gauteng municipal influent is a strong domestic sewage, not a thin municipal average. Typical Chemical Oxygen Demand (COD) is 500–1,200 mg/L, Biochemical Oxygen Demand (BOD) 200–500 mg/L, and Total Suspended Solids (TSS) 300–800 mg/L. Ammonia as nitrogen runs 30–80 mg/L and phosphorus 5–15 mg/L. Most plants we size for Gauteng domestic flow see COD nearer 500–800 mg/L in a dry week; the 1,200 mg/L end shows up after a first flush, so equalisation has to be real.
| Parameter | Typical Influent Range (mg/L) | DWS Effluent Limit (mg/L) | Green Drop Critical Risk Threshold (Example) |
|---|---|---|---|
| COD | 500–1,200 | < 75 | > 150 |
| BOD | 200–500 | < 50 | > 100 |
| TSS | 300–800 | < 25 | > 50 |
| Ammonia (as N) | 30–80 | < 10 (varies with plant type and season) | > 20 |
| Phosphorus (as P) | 5–15 | < 5 (for sensitive receiving waters) | > 10 |
| E. coli | Highly Variable | < 1,000 CFU/100 mL | > 10,000 CFU/100 mL (indicative) |
The practical question, how is wastewater treated in midrand south africa, has the same municipal answer used across Johannesburg. Coarse screens take rags. Grit removal takes sand. Primary settlement or flotation takes settleable solids. Biological reactors oxidise COD and, where the sludge age is long enough, ammonia. Clarifiers or membranes split the solids, disinfection cuts indicator organisms, and sludge is thickened, digested or dewatered.
Midrand drains toward the Jukskei and Hennops side of the metro, so the discharge limit in the water use licence may be tighter than the general planning numbers above. Confirm the outfall and the licence before copying a generic 75 mg/L COD target into a specification.
Johannesburg's six plants have a combined design capacity of 1.1 billion litres per day, which is 1,100 ML/d, or 1,100,000 m³/d, of design capacity, not measured inflow. The historical secondary process across Gauteng is conventional activated sludge, with lagoons at some older or smaller sites. Membrane bioreactors and moving-bed biofilm reactors are the usual upgrade path when TSS and nutrients will not meet the licence inside the old footprint. MBR systems produce a reuse-grade solids result in that tighter footprint; lagoons remain a weak choice where the licence demands low ammonia.
dws effluent compliance municipal wastewater gauteng
DWS effluent compliance for municipal wastewater in Gauteng is set by each works' water use licence, and the planning numbers in the table above, COD below 75 mg/L, TSS below 25 mg/L and E. coli below 1,000 CFU/100 mL, are the general band, not the permit. The 2024 DWS guidelines tighten ammonia and phosphorus where the receiving water body is sensitive. Johannesburg's 2025 metro score of 48.8% is itself a compliance signal: a works in the critical band attracts public reporting, a mandatory improvement plan and possible DWS intervention.
A water use licence carries discharge volumes, quality limits and operational parameters at the same time. Licences are refused or revoked for three repeat reasons: treatment capacity below the real flow, poor operating results, and monitoring a regulator cannot trust. Grab samples that skip ammonia, or a missing accredited-lab trail, sink more applications than process choice does.
Disinfection still has to hit the microbiological number in the licence. chlorine dioxide generators are one stable dosing route where a chemical barrier is accepted; match the dose to the residual limit in the licence. The national rule set behind these instruments is covered in none compliance of wastewater treatment in south africa; this page stays with the Gauteng municipal upgrade decision.
ammonia removal upgrade tshwane wastewater works
An ammonia removal upgrade on a Tshwane wastewater works has to close the gap from influent ammonia of 30–80 mg/L to the limit written in the licence, below 10 mg/L in the general band and tighter where the outfall is sensitive. Nitrification needs a long enough sludge age, enough oxygen and a winter check, because nitrifiers slow as temperature falls. Most nitrifying activated-sludge plants we review on Gauteng domestic sewage hold ammonia only when the sludge age sits at the long end of the design.
When is ammonia removal required?
Ammonia removal is required the moment the licence limit sits at or near the general 10 mg/L band while the feed is still 30–80 mg/L. Carbon removal alone will not do that job. A short sludge age can still cut COD and miss ammonia, and if the plant already sits at the top of the 0.3–0.6 kWh/m³ energy band, extra air for nitrification has to be justified against measured power, not against a brochure figure.
Tshwane's raw-sewage pollution, described in the snapshot as system collapse, is a collector problem and a works problem together. Upgrading the biological reactor while pump stations spill does not move river ammonia. Fix the long-term spillage first, then spend on the works: longer sludge age in the existing activated sludge, an MBBR add-on where tanks cannot grow, or a membrane retrofit where footprint and reuse case support R40–80/m³. The critical-risk example of effluent ammonia above 20 mg/L in the standards table is a failed works, not a design target.
Compliance Risks and Regulatory Requirements for Gauteng Plants
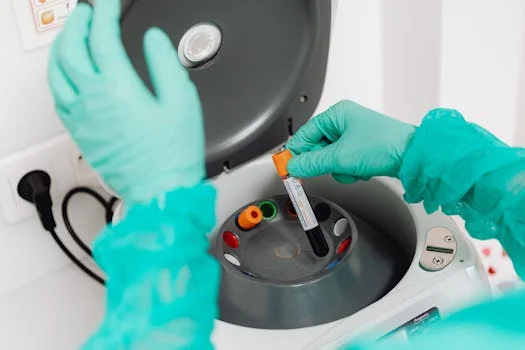
Compliance for a Gauteng works is four instruments at once: the Green Drop score, the water use licence, NEMA and the municipal bylaw. Public reporting, a forced improvement plan and loss of operating autonomy follow a poor Green Drop result. Licence suspension can stop the discharge, and criminal liability sits under NEMA when pollution is the offence, with fines that can reach R10 million per occurrence.
| Regulation/Standard | Governing Body | Key Compliance Metrics | Consequences of Non-Compliance |
|---|---|---|---|
| Green Drop Report Criteria | Department of Water and Sanitation (DWS) | Operational management, effluent quality, infrastructure condition, wastewater treatment process. | Public reporting, mandatory improvement plans, potential fines, loss of operational autonomy. |
| DWS Effluent Discharge Standards | Department of Water and Sanitation (DWS) | COD, BOD, TSS, Ammonia, Phosphorus, E. coli, etc. | Fines (up to R10M/incident), legal action, environmental rehabilitation orders. |
| National Environmental Management Act (NEMA) | Department of Forestry, Fisheries and the Environment (DFFE) | Pollution prevention, waste management, environmental impact. | Criminal charges, significant fines, civil liability. |
| Water Use Licenses (WULs) | Department of Water and Sanitation (DWS) | Compliance with licensed discharge volumes, quality, and operational parameters. | License suspension or cancellation, operational shutdown. |
The regulatory direction of travel is toward tighter nutrient removal and reuse. For now, design the reuse stream to the user specification and the river outfall to the water use licence, and keep the two numbers apart in the budget. Effective disinfection is part of both paths, and the dosing route above is one proven barrier.
vaal river pollution emfuleni sewage infrastructure
Vaal River pollution from Emfuleni sewage infrastructure is the province's largest single intervention. According to the DWS statement of 27 May 2025, the department's total estimated cost of the intervention is R7.6 billion, over a seven-year period, including completion of the major capital works. That programme figure covers upgrades of the Emfuleni wastewater works. It is not a rand-per-cubic-metre unit rate, and it should not be forced into the R15–45/m³ retrofit band.
Progress reported in the same statement is specific. The refurbishment of four pump stations has been completed and they are now fully functional, and the department has completed the replacement of fifty collapsed sewer lines in Emfuleni. On capacity, Sebokeng has been increased by 50 ML per day to 150 ML per day, with designs done for a further 50 ML upgrade. Rietspruit sits at a current capacity of 36 ML per day with completed designs to raise it by 50 ML/day. Leeukuil is designed to increase by 15 ML/day from a current 36 ML per day, and Meyerton is moving from 10 ML per day to 25 ML/day.
Read those numbers as one programme's scope, not as Gauteng averages. Most of the remaining spend is capacity, not another round of unblocking. A process tender that ignores collector condition will not hold the Vaal, because the collector and the works failed together. Budget sewer refurbishment and works capacity as two lines, or the river stays brown after the reactors are new.
Equipment Checklist for Gauteng Municipal Sewage Treatment Upgrades
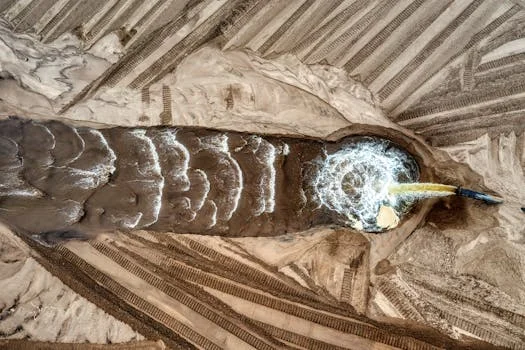
Pretreatment starts with a mechanical bar screen that still turns when the rag load peaks; the GX Series is the screen family used for that duty. Grit removal follows, then an equalisation tank sized for the peak hour, not the daily average. Most Gauteng pretreatment upgrades we size choose flotation when incoming TSS sits in the 300–800 mg/L band and the existing clarifier is already buried. DAF systems take that high-solids feed more reliably than an overloaded lamella.
Secondary treatment is where the ammonia decision lands. Conventional activated sludge stays the default where tanks and clarifiers have spare volume and the sludge age can be lengthened. Sequencing batch reactors fit smaller or swinging loads. A membrane retrofit is the compact route when effluent solids and the reuse case justify R40–80/m³; the national membrane discussion belongs on mbr wastewater treatment systems in south africa: 2026 engineering guide with costs, compliance & roi, not on this Gauteng cost page.
Tertiary duty is disinfection plus any nutrient step the licence still misses after the bioreactor. chlorine dioxide generators cover the disinfection duty where a chemical barrier is accepted, and nutrient polishing is a separate unit. Sludge is the cost line that surprises procurement: a plate-and-frame press such as the HydropureWater Plate and Frame Filter Press, or a belt press, cuts the mass hauled at R500–1,200/ton. Anaerobic digestion remains the biogas path, with the 0.3–0.5 kWh/m³ credit and the 3–7 year payback already stated.
Automation is part of the upgrade, not a later extra. PLC chemical dosing, a SCADA link and a simple alarm on blower failure keep a small operating team inside the licence overnight. For integrated, compact treatment, underground integrated sewage treatment plants offer a space-saving option on a small Gauteng catchment. Specify the Underground Package Sewage Treatment Plant (WSZ Series) for that package duty, not as a substitute for a 400 ML/day metro works.
When the pretreatment choice is still open, the comparison in DAF vs. lamella clarifiers for Gauteng's pretreatment needs sets out why flotation is favoured on higher solids loads.
Who Should Use These Upgrade Figures
Municipal process engineers, EPC contractors and procurement managers pricing a Gauteng sewage works should use these bands. The figures apply to municipal domestic sewage under a South African water use licence. A factory effluent with a different salt or metals load needs its own mass balance. If you cannot name the licensed ammonia limit, you are not ready to buy membranes.
Next step: assemble design flow, twelve months of effluent results, the water use licence limits and the latest Green Drop works score. Send that pack with a request for an upgrade budget check before the council item is written.
Frequently Asked Questions
How many municipal wastewater treatment plants are there in Gauteng, and what is their general efficiency?
Approximately 120 municipal wastewater treatment plants operate in Gauteng, and only about 15% of them meet Green Drop efficiency standards on that older count. The 2025 reading shifts attention to works-level results: half of Johannesburg's six works fall in the critical condition category. Nationally, roughly 125 of 955 plants operate efficiently. Count the works in your own metro and read each licence before pricing an upgrade.
Is the water in Gauteng contaminated by sewage?
Yes, water sources in Gauteng are often contaminated by sewage, particularly in areas served by failing treatment plants. The 2025 Green Drop Report indicated E. coli levels exceeding DWS limits in 60% of tested samples, posing risks for drinking water safety and recreational use. Works condition tells you which reach is at risk: Ennerdale's inflow exceeds 200% of design capacity, so its receiving stream carries the overload. Judge the river by the works on it, not by one provincial average.
What is the largest municipal wastewater treatment plant in Gauteng, and what technology does it use?
The Northern Works in Johannesburg is one of the largest wastewater treatment plants in South Africa, with a design capacity of 400 ML/day. It primarily uses activated sludge and anaerobic digestion, though performance has been hit by infrastructure failure. Its 2021 Green Drop score was 77%; the 2025 reading put it at 30%. The licensed flow, not the nameplate, is what an upgrade budget must be sized against.
What are the three main types of municipal sewage treatment plants used in South Africa?
The three main types are activated sludge, membrane bioreactors (MBR) and sequencing batch reactors (SBR). Activated sludge is the widely used Gauteng secondary process. MBR is increasingly adopted for reuse and high-quality effluent, at R40–80/m³ of retrofit capital. SBR suits smaller or variable loads. Lagoons are also used but are generally less efficient for meeting modern standards. Pick the type from licence ammonia and solids limits, not from a vendor label.
What is the typical cost to upgrade a municipal sewage treatment plant in Gauteng?
Upgrades typically cost R15–45/m³ of daily capacity. Enhancing an existing activated sludge plant with MBR technology runs R40–80/m³, and adding DAF pretreatment R10–25/m³. A new works is R30–80/m³. These are capital bands per cubic metre of installed daily capacity; energy at 0.3–0.6 kWh/m³, chemicals at R2–5/m³ and sludge disposal at R500–1,200/ton sit on top as operating cost.
Further Reading
Explore these in-depth articles on related wastewater treatment topics: