An RO desalination vs alternatives review starts with three hard numbers. Seawater reverse osmosis (SWRO) with energy recovery typically uses 2.5–4.0 kWh/m³ at open-ocean salinity near 35,000 mg/L TDS and about 40–50% recovery. Brackish water RO (BWRO) often uses 0.5–1.5 kWh/m³ at 2,000–10,000 ppm TDS. Thermal multi-stage flash (MSF) still needs about 5–8 kWh/m³ of electricity plus large heat input, with recovery commonly limited to 10–20%.
Which Desalination Technology Fits Municipal and Industrial Duty?
Reverse osmosis is the default when feed TDS is below 40,000 ppm with grid or PV power and the goal is lowest-cost potable or process water. Thermal MSF or MED fit feeds above about 50,000 ppm TDS or sites with abundant waste heat. Membrane distillation suits brine concentration and ZLD trains where osmotic pressure would stall RO.
Earlier market summaries often cited reverse osmosis near 65% of installed desalination capacity. According to the IEA (2026), reverse osmosis and other membrane plants now account for more than 80% of installed capacity globally and over 60% in the Middle East and North Africa. The World Bank (2025) reports the same 2025 split as about 65% RO in MENA and 89% RO in the rest of the world. Global online capacity was reported near 99 million m³/day in 2023; MENA alone held about 46% of online capacity by 2025 (World Bank, 2025).
Consider a coastal food plant needing 5,000 m³/day of product water. If the site once relied on thermal desalination beside a power plant, a move to RO can cut OPEX by about 40% over a 10-year horizon when fuel and carbon costs are market-priced. Wrong technology selection still wastes energy and shortens equipment life through scaling or corrosion.
The four main options—RO, thermal distillation (MSF/MED), solar desalination, and membrane distillation (MD)—serve different niches. RO remains the workhorse for large municipal and industrial plants. Solar methods serve remote off-grid loads. MD is advancing for high-salinity industrial wastewater and ZLD.
Reverse Osmosis Desalination: Engineering Specs and Process Parameters
Seawater reverse osmosis (SWRO) systems achieve 45–55% recovery rates for feedwater with Total Dissolved Solids (TDS) between 35,000 and 45,000 ppm, while brackish water RO (BWRO) can reach 75–85% recovery. These benchmarks rely on thin-film composite (TFC) membranes that provide high salt rejection (up to 99.8%) at lower operating pressures than older generations. For seawater, osmotic pressure typically drives operating pressures between 55 and 80 bar.
Energy consumption is the primary differentiator for RO. Modern plants equipped with Energy Recovery Devices (ERDs), such as isobaric pressure exchangers, consume only 2.5–4.0 kWh/m³ for seawater. That remains far below the 5–8 kWh/m³ electrical load often quoted for thermal methods. Membrane life typically ranges from 3 to 7 years for seawater and 5 to 10 years for brackish water when pretreatment is tight. Failure to control Silt Density Index (SDI) or biofouling can cut membrane life to less than 18 months.
Effective pretreatment is non-negotiable for Industrial Reverse Osmosis (RO) Water Treatment System trains. The train usually combines multi-media filtration, ultrafiltration (UF), and PLC-controlled chemical dosing for RO pretreatment for scale inhibitors and pH control. Engineers often evaluate pretreatment options for RO desalination systems to keep feedwater SDI below 3.0. After the membranes, remineralization and disinfection with On-site ClO₂ generation for RO permeate post-treatment help meet WHO or EPA potable targets.
| Parameter | Seawater RO (SWRO) | Brackish Water RO (BWRO) |
|---|---|---|
| Feedwater TDS (ppm) | 35,000 – 45,000 | 2,000 – 10,000 |
| Recovery Rate (%) | 45% – 55% | 75% – 85% |
| Energy Use (kWh/m³) | 2.5 – 4.0 (with ERD) | 0.5 – 1.5 |
| Operating Pressure (bar) | 55 – 80 | 10 – 25 |
| Membrane Lifespan (yrs) | 3 – 7 | 5 – 10 |
Thermal Desalination: Multi-Stage Flash (MSF) and Multiple-Effect Distillation (MED)
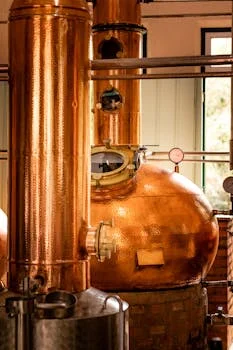
Multi-stage flash (MSF) distillation consumes between 5 and 8 kWh of electrical energy per cubic meter, plus a large thermal energy input, resulting in recovery rates of only 10–20%. Despite that demand, MSF remains useful where waste heat is abundant and feedwater salinity exceeds the effective RO range, for example above 50,000 ppm TDS. The process heats seawater and flashes it through chambers at falling pressure; vapor then condenses as distillate.
Multiple-Effect Distillation (MED) is a more efficient thermal alternative, consuming 4–6 kWh/m³ with recovery rates of 20–35%. Because MED operates at lower temperatures (typically below 70°C), it sees less scaling and corrosion than MSF. Lower temperature also allows lower-grade waste heat, which suits many industrial sites. Both thermal methods produce more brine than RO—often 1.5 to 2 times the volume—and brine may leave at temperatures up to 40°C, so cooling ponds or heat exchangers are needed to limit thermal impact on receiving waters.
Thermal plant maintenance is specialized. High-temperature, high-salinity duty needs corrosion-resistant alloys such as duplex stainless steel or titanium for heat-exchanger tubes. Mechanical life can reach 20–30 years, longer than the typical 15–20 year life of an RO plant. High OPEX and brine heat load still push thermal units into niches where energy is nearly free or feed quality is exceptionally poor.
Solar Desalination: Passive vs. Active Systems and Scalability
Passive solar desalination systems typically yield between 3 and 5 liters of distillate per square meter per day, which fits only small emergency or household duty. Solar stills use the greenhouse effect to evaporate water and condense it on a cover. They need no electricity and have negligible OPEX, but the footprint blocks industrial scale: a 1,000 m³/day plant would need more than 200,000 m² of still area.
Active solar desalination, specifically photovoltaic-powered RO (PV-RO), scales better, with modular capacities from about 10 to 100 m³/day. According to IRENA 2024 data cited in prior plant studies, PV-RO water cost often ranges from $0.50 to $2.00/m³, higher than grid-connected RO ($0.10–$0.30/m³) but competitive where diesel is the only power option. Intermittency is the main design constraint. Battery or large product storage to hold 24/7 duty can raise CAPEX by 30–50%.
In high-irradiance regions such as North Africa, the Southwestern United States, or Australia, solar-assisted RO is a practical hybrid. Daytime solar and night-time grid power hedge energy price swings. Land area for PV arrays remains a constraint for urban or space-limited industrial sites.
Membrane Distillation: Emerging Alternative for High-Salinity or Industrial Wastewater
Membrane distillation (MD) achieves salt rejection rates exceeding 99.9% while operating at atmospheric pressure and temperatures as low as 60–90°C. Unlike RO, which is limited by osmotic pressure, MD is thermally driven: a hydrophobic membrane passes water vapor and rejects liquid. That allows recovery rates of 60–90%, even on high-salinity brines that would stall RO or demand unsafe pressures.
The energy profile of MD is unique. It needs substantial thermal energy but can use low-grade waste heat from boilers, solar thermal collectors, or geothermal sources. That makes MD a strong ZLD candidate in oil and gas produced-water service, where salts and hydrocarbons are high. By concentrating brine past RO limits, MD cuts the volume sent to trucks or thermal crystallizers.
Current MD challenges include membrane wetting—pores fill with liquid and rejection collapses—and CAPEX often 2 to 3 times higher than RO for the same capacity. As membranes improve and brine mineral recovery (lithium, magnesium) gains value, MD is moving from pilots into circular-water flowsheets.
RO Desalination vs Alternatives: Cost Comparison and ROI Framework
Capital expenditure for reverse osmosis plants currently ranges from $1,000 to $2,500 per m³/day of capacity, lower than the $1,500 to $3,000 required for MSF or the $2,500 to $5,000 for emerging membrane distillation systems. Older vendor guidance often quoted potable RO near $0.30/m³. According to the World Bank (2025), 17 RO plants awarded in MENA between 2019 and 2025 show a median combined water cost of US$0.52 per m³. Broader OPEX bands of $0.30–$0.60/m³ still apply in many regions, with membrane replacement, chemicals, and labor adding about $0.05–$0.15/m³.
Regional energy prices decide the ranking. In the Middle East, falling fuel subsidies have accelerated the shift from thermal units to RO. In Europe, high labor and power costs favor high-efficiency RO with automation. ROI must include water sales or avoided purchase cost, brine disposal risk, and any mineral-recovery revenue—not only CAPEX.
| Technology | CAPEX ($/m³/day) | OPEX ($/m³) | Energy (kWh/m³) | Typical Application |
|---|---|---|---|---|
| Reverse Osmosis (RO) | $1,000 – $2,500 | $0.30 – $0.60 | 2.5 – 4.0 | Municipal, Industrial |
| Thermal (MSF) | $1,500 – $3,000 | $0.50 – $1.00 | 5.0 – 8.0 | Co-located Power Plants |
| Thermal (MED) | $1,200 – $2,500 | $0.40 – $0.80 | 4.0 – 6.0 | Industrial Waste Heat |
| Solar PV-RO | $2,000 – $4,000 | $0.50 – $1.50 | Solar/Battery | Off-grid, Remote |
| Membrane Distillation | $2,500 – $5,000 | $0.70 – $1.50 | Waste Heat | ZLD, Brine Concentration |
Understanding how desalination fits into broader wastewater treatment strategies changes plant sizing. An integrated scheme that reclaims 50% of process water before desalination needs a smaller RO train and lower CAPEX. Specifying an Industrial Reverse Osmosis (RO) Water Treatment System after reuse also reduces brine volume that must leave the site.
How to Choose the Right Desalination System: Decision Checklist
Desalination technology selection starts with measured feedwater TDS, available energy form, and local brine rules. If feedwater TDS is below 40,000 ppm and the goal is potable water, RO is usually the lowest-cost path. If TDS exceeds 50,000 ppm, as in some inland salt lakes or industrial brines, osmotic pressure may exceed practical RO membrane limits, so thermal or MD options enter the shortlist.
Next, map energy. If low-grade waste heat at 60–90°C is available, MED or membrane distillation may beat RO on OPEX despite higher CAPEX. Then check brine rules. Under zero liquid discharge mandates, pair RO with an MD concentrator or evaporation pond. Finally, weigh capacity and expansion: RO is modular by rack, while thermal plants are large fixed blocks that are hard to expand later.
Desalination Decision Logic:
- If feedwater TDS < 40,000 ppm and grid power is available: Select RO with Energy Recovery Devices.
- If feedwater TDS > 45,000 ppm and waste heat is available: Select MED or Membrane Distillation.
- If the location is off-grid with high solar irradiance: Select Photovoltaic-powered RO (PV-RO).
- If the goal is Zero Liquid Discharge (ZLD): Select RO for initial concentration followed by MD for final brine reduction.
- If feedwater is highly contaminated with organics or oils: Prioritize robust pretreatment (UF/MMF) before any membrane process.
- If carbon intensity is capped in the offtake contract: Prefer electrified RO that can take renewable power over heat-driven MSF.
- If land is scarce: Avoid passive solar stills; favor compact RO skids over large thermal halls when feed quality allows.
Who this is for: plant engineers, EPC contractors, and procurement managers sizing seawater or brackish trains for municipal or industrial duty. Who should look elsewhere: buyers seeking only household solar stills or laboratory MD research packages. Next step: send a feedwater analysis (TDS, SDI, organics, temperature) so the train can be sized before CAPEX quotes lock in.
Frequently Asked Questions
What are the main disadvantages of reverse osmosis desalination?
RO membranes foul and scale unless pretreatment and cleaning are disciplined, which adds chemicals and downtime. The process also produces a concentrated brine stream that must meet discharge or ZLD rules. Because SWRO depends on electricity—typically 2.5–4.0 kWh/m³ with ERDs at seawater salinity near 35,000 mg/L TDS—power price swings flow straight into operating cost over the plant life.
Is reverse osmosis better than thermal desalination?
Reverse osmosis is one desalination method, not a substitute for the whole category. For most municipal and industrial feeds below about 40,000 ppm TDS, RO uses far less energy than MSF or MED and needs a smaller plant footprint. Thermal methods still win when waste heat is nearly free or salinity exceeds practical RO pressure limits around 50,000 ppm TDS.
What is the difference between solar desalination and reverse osmosis?
Solar desalination uses solar energy as the primary driver, either as heat in stills or as PV power for pumps. Standard RO usually draws grid electricity for high-pressure pumping. Passive solar stills yield only about 3–5 liters per square meter per day, while PV-RO is an active membrane plant that can serve 10–100 m³/day when storage covers night hours.
How much does a desalination plant cost to build?
Costs scale with capacity and site works. A small modular RO system around 500 m³/day may cost about $500,000, while a 50,000 m³/day municipal plant can exceed $50 million before intake and brine systems. Expect CAPEX near $1,000–$2,500 per m³/day of installed RO capacity for the core membrane train in most markets.
Can RO desalination treat industrial wastewater for reuse?
Yes, RO is widely used to polish industrial wastewater for reuse when oils, metals, and organics are removed first. Without UF or multi-media filtration and chemical control, fouling collapses flux and can shorten membrane life below 18 months. Pairing reuse ahead of desalination also shrinks the RO train and the brine volume that must leave the site.