
Why Artesia Refineries Are Re-Examining the CAS Baseline
For petroleum wastewater in Artesia, New Mexico, conventional activated sludge (CAS) remains the EPA-recognized baseline under 40 CFR Part 419, but a membrane bioreactor (MBR) delivers measurably higher effluent quality, a roughly 60% smaller footprint, and more complete degradation of recalcitrant phenols and hydrocarbons because it operates at a higher solids retention time. The trade-off is higher energy use from membrane fouling control and the need for upstream oil and grease removal (typically DAF) to protect the membranes.
40 CFR Part 419, re-evaluated in EPA's 2019 Detailed Study of the Petroleum Refining Category (EPA 821-R-19-008), is the only federal rule that names the biological train a refinery must meet. It currently regulates eight parameters: BOD₅, TSS, COD, oil and grease, phenolic compounds, ammonia, sulfide, and total chromium (the sole metal in the ELG). The same study documents the end-of-pipe BAT train as API separator → equalization → activated sludge or aerated lagoon → polishing pond or multimedia filter — a configuration unchanged since the 1982 re-promulgation. For indirect discharges, PSES/PSNS add 100 mg/L daily-maximum limits for oil and grease and ammonia-as-N across all five subparts, plus 1 mg/L total chromium under PSNS.
Artesia's small topping and cracking refineries typically fall under Subparts A and B, and many are co-located with Permian Basin produced-water treatment skids. Effluent routes split between NMED-permitted Pecos River watershed discharge and Class II injection wells, which sit under a separate but overlapping regulatory framework. Two forces are now pushing operators to revisit the 40-year-old CAS baseline: tightening effluent quality on oil and grease, ammonia, and emerging contaminants (PFAS, microplastics), and growing on-site water-reuse demand for cooling-tower makeup and boiler-feed pretreatment. The EPA's 2019 pilot work in Section 5.5.2 of the Detailed Study evaluated microfiltration downstream of activated sludge specifically to enable reuse — a configuration that previews where MBR fits.
How Each System Treats Petroleum-Specific Contaminants
Refinery wastewater is not municipal wastewater: free oil, emulsified hydrocarbons, sulfide, ammonia from sour-water stripping, phenols, and traces of chromium are the molecules that decide whether a biological train succeeds or fails. Each system handles them differently.
Free and emulsified oil. CAS tolerates a well-operated API/CPI upstream separator, but emulsified oil and FOG slip through and smother floc, hurt settling, and ride out with the clarifier overflow. MBR does not tolerate FOG at all — oil is the dominant membrane-foulant on refinery duty, and a submerged PVDF module cannot survive direct oily feed. Both systems therefore require a properly sized DAF oil and grease pretreatment step ahead of the bioreactor. The DAF is not optional for MBR; it is the membrane's insurance policy.
Phenolic compounds and PAHs. Recalcitrant aromatics need specialist biomass with long enough SRT to express the right enzyme systems. CAS operating at 5–15 days SRT partially mineralizes phenols but routinely bleeds 0.5–2 mg/L out the clarifier. MBR operating at 20–60 days SRT holds the slow growers in the reactor and more completely degrades phenols and PAHs — the higher-SRT / recalcitrant-pollutant mechanism documented by Mannina et al. (2019). For refineries targeting reuse, this is the single most important difference.
Sulfide and ammonia from sour water. Both systems nitrify, but nitrifiers grow slowly and are easily washed out of a clarifier-based CAS train. MBR's physical barrier retains biomass regardless of floc quality, so ammonia breakthrough under hydraulic or toxic shock is less likely. With Part 419's ammonia limit looming for both direct and indirect discharges, that margin is real.
Total chromium. Both CAS and MBR achieve similar biosorption because removal is largely a sorption phenomenon on biomass. The MBR difference is the absolute barrier: no sloughed floc can carry chromium past a 0.1–0.4 µm membrane, so MBR effluent shows less variability around the 1 mg/L PSNS chromium ceiling.
Microplastics and emerging contaminants. Lares et al. (2018), cited within the Mannina et al. plant-wide model, found MBR effluent at roughly 0.4 microplastics/L versus about 1.0/L for CAS — a 2–3× improvement that becomes material as NMED and EPA tighten watchlists for produced-water and refinery reuse streams.
Side-by-Side Parameters: MBR vs CAS for Refinery Duty
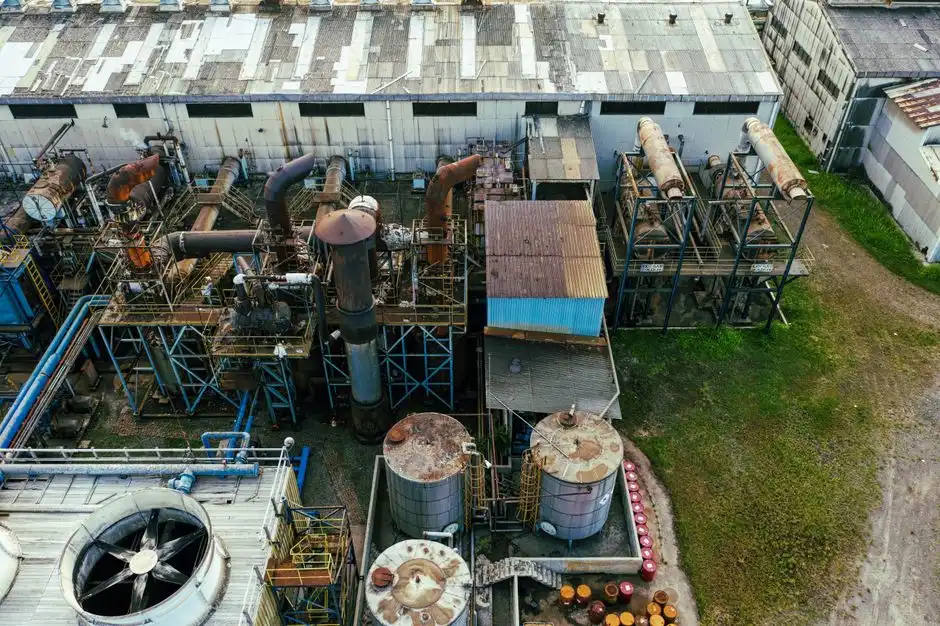
The table below consolidates refinery-duty operating ranges for the parameters that drive equipment selection. Numbers reflect typical engineering values drawn from EPA 821-R-19-008 and the Mannina et al. (2019) plant-wide model; site-specific CAPEX requires a vendor quotation.
| Parameter | Typical CAS range | Typical MBR range | Refinery-duty implication |
|---|---|---|---|
| Solids retention time (SRT) | 5–15 days | 20–60 days | Higher MBR SRT supports specialist biomass for phenol/PAH degradation and stable nitrification. |
| MLSS | 2,000–4,000 mg/L | 8,000–12,000 mg/L | Higher biomass in MBR reduces reactor volume; demands robust DO control and scour aeration. |
| Effluent TSS | 10–30 mg/L | <1–5 mg/L (0.1 µm membrane) | MBR delivers near-reuse TSS without a polishing filter; CAS usually needs multimedia polish to meet reuse specs. |
| Effluent COD | 60–120 mg/L | <30–50 mg/L typical | MBR comfortably under most reuse thresholds for cooling-tower makeup; CAS often misses. |
| Oil & grease (after upstream DAF) | 5–15 mg/L | <2–5 mg/L | MBR gives wider safety margin against the 100 mg/L PSES/PSNS indirect-discharge ceiling. |
| Footprint ratio | 1.0× baseline | ≈ 0.4× of CAS | MBR roughly 60% smaller — decisive on footprint-constrained Artesia sites. |
| Energy demand | Lower (process aeration only) | Higher (process + scour aeration) | MBR scour air is the dominant kWh; not offset by lower BOD loading on refinery duty. |
| Waste sludge yield | Higher | Lower (longer SRT, more mineralization) | MBR cuts downstream sludge dewatering CAPEX, partly offsetting higher power cost (Mannina et al., 2019). |
| Artesia CAPEX | Site-specific | Site-specific — request vendor quotation | Authoritative public CAPEX data for Artesia refineries is not available; treat any vendor number as preliminary. |
Which row matters most depends on the binding constraint: footprint, reuse quality, CAPEX, or OPEX. A 60% smaller reactor block only matters if the site is constrained; an effluent TSS of <5 mg/L only matters if the water is destined for a cooling tower rather than a NPDES outfall.
Operating Trade-Offs: Fouling, Energy, and Sludge
MBR's day-to-day reality on refinery duty is membrane fouling management. Four mechanisms compete: oil fouling (mitigated by upstream DAF and periodic CIP), scaling from hardness (controlled by anti-scalant and relaxed-cycle operation), biological fouling and cake formation (controlled by air-scour and maintenance cleans), and gel-layer fouling from extracellular polymers. A well-tuned submerged PVDF system runs relaxation cycles of 8–10 minutes on / 1–2 minutes off, with chemical CIP every 4–12 weeks depending on feed.
The energy penalty is structural, not operational. MBR aeration demand is dominated by membrane scour, not BOD oxidation — so even at low organic loading the blowers run. Operators should budget for this rather than be surprised by it. Comparing the two systems on a plant-wide basis, Mannina et al. (2019) report direct GHG emissions of 0.85 kg CO₂eq/m³ for CAS versus 0.91 kg CO₂eq/m³ for MBR — MBR is slightly higher on direct emissions, but lower sludge yield and reduced chemical demand often flip the result on indirect emissions.
The sludge line is the offset most procurement evaluations miss. MBR waste sludge is more mineralized and produced at lower yield because of the long SRT, reducing downstream thickening, dewatering, and disposal cost. For a refinery already paying for sludge hauling to a UIC well or off-site disposal, that delta is not trivial. A practical pretreatment decision — DAF sizing and chemistry in particular — is detailed in our DAF vs IAF comparison for industrial wastewater.
Decision Matrix: When to Pick MBR, When to Stay with CAS
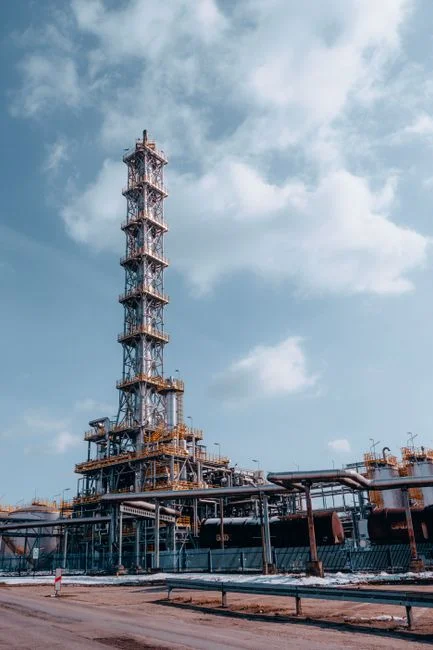
The matrix below maps refinery conditions to a defensible technology choice. It is meant to be lifted into an internal memo and adapted site-by-site.
| Site / driver condition | Pick MBR | Stay with CAS | Hybrid (CAS + downstream membrane) |
|---|---|---|---|
| Footprint-constrained brownfield | Strong fit — 60% smaller reactor block. | Not a fit. | Only if existing CAS basins are reusable. |
| Effluent must meet reuse specs (cooling tower, boiler feed pretreatment) | Strong fit — <5 mg/L TSS, <50 mg/L COD typical. | Marginal — usually needs tertiary filtration. | Viable if reuse targets are modest. |
| Minimal CAPEX is the priority | Not a fit. | Strong fit — lowest first cost, widely supported by local operators. | Viable retrofit. |
| Influent oil & grease control is unreliable | Not a fit — FOG will destroy membranes. | Tolerates upsets better. | Tolerates upsets better. |
| Discharge to robust POTW with pretreatment program | Over-specified. | Strong fit. | Rarely needed. |
| Anticipated PFAS / microplastic limits | Strong fit — physical barrier + 0.4 MP/L vs 1.0 MP/L effluent. | Weak — relies on floc capture. | Moderate — adds a barrier downstream of CAS. |
| Long amortization horizon (>15 years) | Strong fit — Karim & Mark (2017) found MBR favored over >67-year horizon via lower sludge OPEX. | Favored at short horizon. | Intermediate. |
| Skilled operators are scarce | Not a fit — membrane maintenance demands trained staff. | Strong fit. | Moderate. |
One rule cuts across every row: an MBR must be paired with a properly sized DAF upstream. Free and emulsified oil above roughly 50 mg/L will foul a submerged PVDF module within hours. The DAF is the cheapest insurance on the flowsheet and the single most common cause of premature MBR failure when it is undersized or chemically mis-tuned — see the DAF sizing guidance in this petroleum pretreatment compliance guide for context on how comparable plants are handling it. The hybrid option — adding a membrane step downstream of an existing CAS train — is the configuration EPA piloted in 2019 (Section 5.5.2 of EPA 821-R-19-008) and is the right answer when CAPEX is constrained but reuse targets are rising.
40 CFR Part 419 Compliance Checklist for Artesia Dischargers
40 CFR Part 419 regulates only eight parameters under BAT/BPT — BOD₅, TSS, COD, oil and grease, phenols, ammonia, sulfide, and total chromium — with PSES/PSNS adding 100 mg/L oil and grease and ammonia-as-N for indirect discharges across all five subparts (EPA 821-R-19-008, 2019). Against that list, both CAS and MBR typically clear BOD₅, TSS, and sulfide comfortably, but the binding parameters are oil and grease, phenols, ammonia, and chromium.
CAS effluent ranges from the parameter table above (TSS 10–30 mg/L, COD 60–120 mg/L, oil and grease 5–15 mg/L after DAF) sit close to the limits for many Artesia Subpart A and B refineries, leaving little margin for slug loads. MBR ranges (TSS <1–5 mg/L, COD <30–50 mg/L, oil and grease <2–5 mg/L) sit well below, providing the safety margin refineries need when the upstream DAF is briefly out of service or a desalter upset pushes emulsified oil through. For ammonia, both systems can meet the PSES 100 mg/L ceiling, but MBR's biomass retention makes it more robust against cold-weather and toxic-shock washout of nitrifiers.
For refineries discharging to a POTW, the local pretreatment program still controls. NMED and POTW pretreatment limits are often tighter than the federal floor, particularly on metals and oil and grease, so an MBR's absolute barrier is real insurance against slug loads that would otherwise trigger a pretreatment violation. Two operational points often missed in vendor proposals: DMR-quality data should be the basis for any performance comparison, and any CAPEX number quoted without site-specific influent characterization, DAF sizing, and sludge-handling integration should be treated as preliminary. A refinery considering an integrated MBR system should require a refinery-specific pilot or a guaranteed performance range based on actual influent, not municipal defaults.
Frequently Asked Questions
Is conventional activated sludge still the EPA-recognized baseline for refinery wastewater?
Yes. Under 40 CFR Part 419, EPA's end-of-pipe BAT train is API separator → equalization → activated sludge or aerated lagoon → polishing pond or multimedia filter (EPA 821-R-19-008, 2019). MBR is treated as a "new or improved" technology evaluated in the 2019 Detailed Study, not a BAT baseline, which means it can be proposed as an alternative but is not the federal default.
Does an MBR need a DAF upstream on refinery duty?
Yes — non-negotiable. Free and emulsified oil is the dominant membrane-foulant on refinery feed, and a submerged PVDF module will foul within hours if FOG is not stripped first. A properly sized DAF (typically targeting <50 mg/L oil-in-water to the bioreactor) is standard practice and the most common cause of premature MBR failure when it is undersized.
What effluent quality can an MBR realistically deliver for refinery reuse?
On refinery duty, an MBR following a well-operated DAF typically delivers TSS <1–5 mg/L, COD <30–50 mg/L, and oil and grease <2–5 mg/L, with roughly 0.4 microplastics/L in the effluent versus about 1.0/L for CAS (Mannina et al., 2019; Lares et al., 2018). That profile usually meets cooling-tower makeup specifications without a separate polish step.
How do CAS and MBR compare on energy and greenhouse gas emissions?
On a plant-wide basis, Mannina et al. (2019) report direct GHG emissions of 0.85 kg CO₂eq/m³ for CAS versus 0.91 kg CO₂eq/m³ for MBR. MBR is slightly higher on direct emissions because of scour aeration, but its lower sludge yield and reduced chemical demand often flip the result when indirect emissions are included.