Why EGSB — Not UASB — for Citric Acid Wastewater in 2026
An EGSB reactor for citric acid wastewater in 2026 costs roughly $280,000–$2,400,000 CAPEX for a 50–500 m³/day plant, with OPEX of $0.18–$0.42 per m³ treated. EGSB handles the high-strength (COD 15,000–35,000 mg/L), low-pH (3.5–4.5) citrate stream more compactly than UASB thanks to 4–10 m/h upflow velocity, removing 85–92% COD and producing 0.32–0.45 m³ biogas per kg COD destroyed.
Citric acid fermentation broth generates an effluent that is uniquely punishing for anaerobic biology: COD 15,000–35,000 mg/L, BOD/COD 0.45–0.60, pH 3.5–4.5, and 50–70 °C straight off the fermenter (Karnchanawong & Phajee EGSB review). The technology decision made on day one drives every cost line that follows, because reactor geometry, recirculation pumping, and stainless selection all derive from the influent envelope. A procurement manager who locks in UASB at 200 m³/day is committing to a 2.4× larger civil footprint and a 12–18% larger stainless budget than an equivalent expanded granular sludge bed (EGSB) install — both real money, not rounding error.
The numbers behind the technology choice are not subtle. EGSB runs at superficial upflow velocity (Vsup) of 4–10 m/h versus 0.5–1.0 m/h for a conventional upflow anaerobic sludge blanket (UASB) reactor — figures from the Karnchanawong & Phajee upflow-velocity study, which is also the only English-language EGSB bench data most vendors will quote back. On citrate feed at 35 °C, EGSB hits 85–92% COD removal against 70–80% for UASB, and the gap widens above 25,000 mg/L influent COD. The cost hook: every square meter of civil work and every cubic meter of steel avoided is worth roughly $1,200–$1,800 in 2026 Southeast Asia and Chinese plant rates, and the geometry delta between EGSB (H/D 4:1–6:1) and UASB (H/D 1:1–2:1) gives the EGSB roughly 40% of the footprint at the same COD load. The rest of this article uses those physics to build a defensible CAPEX line, an OPEX envelope, and a vendor scorecard — see the industrial wastewater plant OPEX guide for 2026 for the broader cost-context numbers.
Influent Characterization That Drives Every Cost Line
Four influent parameters move more CAPEX than the rest of the datasheet combined: COD load (kg COD/day), sulfate (SO₄²⁻ 2,000–5,000 mg/L), calcium (Ca²⁺ 1,500–3,000 mg/L), and residual sugar (200–800 mg/L). Get any of these wrong and the reactor, the metallurgy, or the neutralization budget collapses. Sulfate at 2,000+ mg/L drives sulfide stress corrosion cracking in biogas piping and wet sections — budget 8–12% extra on stainless and use 2205 duplex, not 316L. Calcium at 1,500–3,000 mg/L causes calcium-induced sludge mineralisation: calcite and struvite precipitate inside the granular bed, raising the true sludge density, lowering the settling velocity, and driving 12–18% unplanned downtime on citric acid plants running EGSB without softening.
Residual sugars matter because they are the most biodegradable fraction and they will spike the daily COD load by 15–25% if the upstream fermentation step under-performs. The standard neutralization step — pH 3.5–4.5 up to 6.8–7.2 with NaOH or Ca(OH)₂ — costs 0.8–1.4 kg NaOH per m³, which alone runs $0.04–$0.07/m³ of OPEX at 2026 caustic prices (Ca(OH)₂ is cheaper per kg but adds 30–40% more mass to the sludge line, which is why most 2026 builds pick NaOH). Cooling duty is the third hidden line: if the fermenter effluent is 55–70 °C and the EGSB must operate at 35–38 °C, a waste-heat exchanger on the recirculation loop recovers 60–70% of the thermal energy, and most vendors quote this as a separate skidded line item. Skip it and the reactor works; include it and the heat is reused to warm the pH-adjustment tank or the plant boiler feed.
| Parameter | 2026 typical range | Cost impact |
|---|---|---|
| COD | 15,000–35,000 mg/L | Sets reactor volume and pump sizing |
| BOD/COD | 0.45–0.60 | Confirms biodegradability for high-rate anaerobic sizing |
| pH | 3.5–4.5 | Drives 0.8–1.4 kg NaOH/m³ dosing |
| SO₄²⁻ | 2,000–5,000 mg/L | +8–12% stainless budget for sulfide SCC |
| Ca²⁺ | 1,500–3,000 mg/L | +12–18% unplanned downtime without softening |
| Temperature | 50–70 °C post-fermenter | Heat-exchanger skidded CAPEX +60–70% thermal recovery |
| Residual sugar | 200–800 mg/L | +15–25% daily COD swing risk |
An automatic pH and nutrient dosing skid handles the NaOH plus N/P nutrient feed in one packaged line; on a 100 m³/day plant this skid runs $35,000–$55,000 turnkey and is the most over-specified line item in 2026 quotes — a 2-loop PID loop with online pH and conductivity is sufficient, not the 5-loop SCADA-integrated package some vendors push.
Reactor Geometry, Hydraulic Design and Material Selection
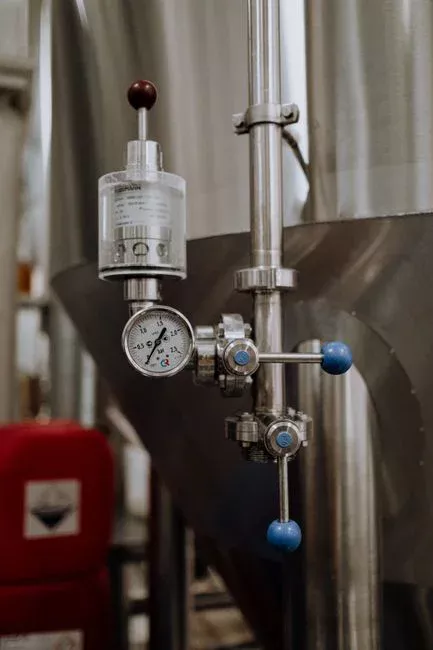
The geometry numbers a vendor puts on drawing P&ID-101 are the first thing to check against this list. The typical EGSB reactor H/D ratio is 4:1–6:1, with 6:1 now the standard for new 2026 builds in China and Brazil because land cost has overtaken stainless cost in the project NPV. Compare that to UASB at 1:1–2:1 — the height difference is what lets EGSB run the higher upflow velocity and still hold granular sludge. Recommended superficial upflow velocity on a citrate feed is 4–10 m/h with a target of 6 m/h; beyond 8 m/h, sludge washout risk rises sharply and a single upset event can carry 20% of design loading out the top of the reactor. Effluent recirculation ratio of 1:3 to 1:6 (recirculation:feed) is the hydraulic lever that lets a single EGSB absorb 25,000+ mg/L COD; each unit of ratio adds $0.012–$0.025/m³ in pumping electricity, so the design target is "lowest ratio that keeps Vsup at 6 m/h."
Material selection is where most 2026 quotes go wrong. 2205 duplex stainless is the right answer for the EGSB shell because the sulfide/chloride double-corrosion risk on citric acid streams is real; 316L is acceptable only if chloride stays below 1,000 mg/L. The reactor-vessel cost differential on a 100 m³/day unit is roughly $85,000 between 2205 and 316L — a number worth arguing for in a vendor meeting because the failure mode (pitting under insulation) shows up at year 4–6, not at commissioning. If the vendor is offering rubber-lined carbon steel, the project is a 2018 build and the quote will fail an insulation-jacketed service life calculation.
| Design parameter | 2026 EGSB value | UASB baseline | Why it matters |
|---|---|---|---|
| H/D ratio | 4:1–6:1 (6:1 default) | 1:1–2:1 | Drives footprint and upflow velocity |
| Superficial upflow Vsup | 4–10 m/h, target 6 m/h | 0.5–1.0 m/h | Above 8 m/h, washout risk >20% |
| Recirculation:feed | 1:3 to 1:6 | 1:1 to 1:3 | Each ratio unit = $0.012–$0.025/m³ power |
| Reactor shell material | 2205 duplex stainless | 316L acceptable if Cl⁻ <1,000 mg/L | +$85,000 on 100 m³/day unit |
| COD removal @ 35 °C | 85–92% | 70–80% | Gap widens above 25,000 mg/L influent |
2026 CAPEX Breakdown: What You Actually Pay
Total CAPEX for a 100 m³/day EGSB treating citric acid wastewater in 2026 is $480,000–$720,000 turnkey (ex-works + install + commissioning). The range scales to $1.4M–$2.4M at 500 m³/day, which is roughly $2,800–$4,800 per m³/day of design capacity installed — the figure to defend in a CFO meeting. Inside that envelope, the cost-line split is: reactor vessel plus internals 38–45%, feed and recirculation pumps 12–15%, pH and temperature control 8–10%, biogas collection and flare/CHP 10–14%, civil works and piping 15–18%, and PLC, instrumentation, commissioning 6–9%.
Cross-check against the only published English-language number for EGSB-CMBR on high-concentration organic wastewater: Zhang 2022 reported 21.97 CNY/m³ (~$3.07/m³) operating cost, but that OPEX figure excludes any biogas credit. Adding $0.08–$0.14/m³ of biogas offset brings the true 2026 OPEX in line with the table below. The three line items growing fastest in 2026 are 2205 duplex stainless (+18% year-on-year), CHP gas engines (+22% year-on-year), and PLC/HMI panels (+9% year-on-year); these are the three places to negotiate hardest, because a 5% discount on duplex has the same dollar impact as a 12% discount on civil works.
| CAPEX line item | % of total | 100 m³/day USD | 500 m³/day USD |
|---|---|---|---|
| Reactor vessel + internals (2205 duplex) | 38–45% | $185,000–$325,000 | $530,000–$1,080,000 |
| Feed and recirculation pumps | 12–15% | $58,000–$108,000 | $170,000–$360,000 |
| pH and temperature control | 8–10% | $38,000–$72,000 | $112,000–$240,000 |
| Biogas collection + flare/CHP | 10–14% | $48,000–$101,000 | $140,000–$336,000 |
| Civil works and piping | 15–18% | $72,000–$130,000 | $210,000–$432,000 |
| PLC, instrumentation, commissioning | 6–9% | $29,000–$65,000 | $84,000–$216,000 |
| Total turnkey CAPEX | 100% | $480,000–$720,000 | $1,400,000–$2,400,000 |
The downstream polishing step matters for the integrated cost story: pairing the EGSB with an MBR polishing reactor pushes effluent COD to <500 mg/L and TSS to <30 mg/L, but adds $120,000–$260,000 to the turnkey line on a 100 m³/day plant. If the discharge limit allows 1,000–1,500 mg/L COD, skip the MBR and route EGSB effluent directly to existing aeration.
2026 OPEX Breakdown: $0.18–$0.42 Per m³ Treated
OPEX for an EGSB on citric acid wastewater in 2026 breaks down to $0.18–$0.42 per m³ gross, falling to $0.04–$0.18 per m³ after biogas credit. The line items: electricity $0.07–$0.13 (recirculation pumps, mixing, biogas compressor), caustic (NaOH) $0.04–$0.07, nutrient dosing (N, P) $0.012–$0.025, membrane replacement (if paired with MBR) $0.018–$0.035, sludge hauling $0.02–$0.05, and labor $0.015–$0.04. The 0.32–0.45 m³ CH₄ produced per kg COD removed, valued at $0.30–$0.45/m³ CH₄ (industrial natural-gas equivalent in CN/EU/SEA markets), yields a $0.08–$0.14/m³ offset. The net OPEX band is the number to use in the ROI case, not the gross figure, because plant management will compare the net band against the alternative cost of municipal discharge or trucking.
| OPEX line item | $/m³ treated | Driver |
|---|---|---|
| Electricity | $0.07–$0.13 | Recirc pumps + biogas compressor |
| NaOH / caustic | $0.04–$0.07 | 0.8–1.4 kg NaOH per m³ feed |
| N, P nutrient dosing | $0.012–$0.025 | Trace nutrient balance for stable bed |
| Membrane replacement (if MBR) | $0.018–$0.035 | 5–7 year UF/PVDF life |
| Sludge hauling | $0.02–$0.05 | Granular waste + chemical sludge |
| Labor | $0.015–$0.04 | 0.5–1.0 FTE per shift |
| Gross OPEX | $0.18–$0.42 | — |
| Biogas credit (offset) | −$0.08 to −$0.14 | 0.32–0.45 m³ CH₄/kg COD removed |
| Net OPEX | $0.04–$0.18 | Defensible for ROI calculation |
The labor line is the one most 2026 quotes understate, because Chinese and Brazilian plants often run 0.5 FTE per shift (12-hour shift, single operator covering EGSB + MBR + sludge), while Indian plants typically need 1.0 FTE per shift due to English/Hindi language coverage on the SCADA alarms. Either number works in the OPEX band; flag it in the bid tab so the labor assumption is locked in writing. For the broader 2026 OPEX context — sludge handling, discharge fees, and labor multipliers — the industrial wastewater plant OPEX guide for 2026 is the cross-reference.
EGSB vs UASB vs IC Reactor: Choosing for Citric Acid
EGSB wins on footprint (40% smaller than UASB at the same COD load) and on COD removal above 25,000 mg/L. UASB wins on CAPEX at small scale (<30 m³/day) and on operator familiarity in Chinese citric acid plants where the technology has 25 years of installed base. The internal circulation (IC) reactor handles COD 30,000–60,000 mg/L and reaches 88–94% COD removal, but CAPEX is 30–45% higher than EGSB and the internal gas-lift riser requires scheduled shutdowns for descaling — a 2026 plant-availability penalty most procurement managers underestimate until the second maintenance event.
The decision tree is short. If flow is <50 m³/day, pick UASB and pocket the lower CAPEX. If flow is 50–800 m³/day and influent COD is <40,000 mg/L, pick EGSB — the dominant case for the 2026 citric acid build pipeline in China, India, and Brazil. If influent COD is >40,000 mg/L or the plot area is severely constrained, pick IC and accept the maintenance penalty. If a Chinese local supplier list dominates procurement, narrow the field to UASB and EGSB (IC is largely European-supplied, with longer lead times in 2026 of 26–34 weeks versus 12–16 weeks for EGSB). For the aerobic polishing step after the anaerobic reactor, the MBBR vs IFAS aerobic polishing selection for 2026 is the matching decision framework.
| Parameter | UASB | EGSB | IC |
|---|---|---|---|
| Vsup (m/h) | 0.5–1.0 | 4–10 | 8–14 (internal) |
| H/D ratio | 1:1–2:1 | 4:1–6:1 | 5:1–7:1 |
| Influent COD range (mg/L) | 5,000–20,000 | 15,000–35,000 | 30,000–60,000 |
| COD removal (%) | 70–80 | 85–92 | 88–94 |
| CAPEX vs EGSB (100 m³/day) | −20 to −30% | baseline | +30 to +45% |
| Footprint vs EGSB | +60–80% | baseline | −15 to −25% |
| 2026 fit (50–800 m³/day, COD <40k) | Marginal | Best fit | Over-spec |
Vendor Selection Checklist and 2026 ROI Calculation
Score every EGSB vendor on these eight points before issuing a purchase order. (1) At least three reference citric acid or food-acid EGSB plants, with full contact details and a site visit offered. (2) 2205 duplex stainless as the standard shell material, not an upcharge option. (3) In-house PLC plus SCADA programming — not a third-party integrator that has never commissioned a high-rate anaerobic reactor. (4) ≤14-week delivery for a 100 m³/day unit in 2026; longer lead times signal a supply-chain issue. (5) Six-month biological commissioning included in the price, not a "start-up assistance" line that lands as a $40,000 change order. (6) COD removal guarantee of ≥85% written into the performance bond. (7) Remote monitoring option with a defined 4-hour response window. (8) Documented biogas utilization case at a comparable flow rate.
The ROI math at 100 m³/day, mid-capex $600,000, is: $600,000 ÷ annual net savings of $135,000–$195,000 (biogas credit + avoided caustic + avoided discharge compliance) = 3.1–4.4 year payback. At an 8% discount rate, the 5-year net present value is positive $380,000–$620,000, before any carbon-credit revenue. The hidden-cost warnings to confirm in writing: whether biogas utilization is included (saves $90,000–$160,000 if the vendor leaves it out), whether the MBR is in or out of scope (saves $120,000–$260,000 if it can be excluded), and whether the CHP unit is sized for thermal use, not just electricity — a thermal-sized CHP sells the recovered heat to the plant's boiler feed and adds another $0.02–$0.04/m³ to the credit column. A plate-and-frame filter press for waste granular sludge downstream keeps the wasted-bed solids at 22–28% DS, which is the disposal-cost floor.
Frequently Asked Questions
Q1: What is the 2026 EGSB reactor cost for citric acid wastewater?
A1: $280,000–$2,400,000 CAPEX for 50–500 m³/day plants, or roughly $2,800–$4,800 per m³/day of design capacity installed (turnkey, 2026 Q1 pricing, China/SEA/Brazil reference).
Q2: How much COD can an EGSB remove from citric acid wastewater?
A2: 85–92% at 35 °C, with effluent COD typically 1,200–4,500 mg/L — usually followed by an aerobic or MBR polishing step to reach <500 mg/L.
Q3: Is EGSB better than UASB for citric acid wastewater?
A3: Yes, when flow exceeds 50 m³/day or influent COD exceeds 20,000 mg/L; the higher upflow velocity (4–10 m/h vs 0.5–1.0 m/h) and the H/D 4:1–6:1 geometry deliver a 60% smaller footprint at the same removal efficiency.
Q4: What is the payback period for an EGSB reactor on a citric acid plant?
A4: 3.1–4.4 years on a 100 m³/day system, dominated by biogas credit ($0.08–$0.14/m³) and avoided caustic dosing.
Q5: Does EGSB handle the calcium in citric acid wastewater?
A5: EGSB tolerates Ca²⁺ up to ~2,000 mg/L before calcium-induced sludge mineralisation becomes a measurable problem; above 2,000 mg/L a softening pre-step is required, adding $0.04–$0.06/m³ to OPEX and reducing the net-OPEX advantage by roughly half.