Why 2026 Is the Inflection Year for PFAS Removal Technology
The global PFAS treatment market is valued at US$2.1 billion in 2026 and is forecast to reach US$3.0 billion by 2033 at a 5.2% CAGR, with North America holding a 39% share. That share is anchored by three hard drivers: the EPA's 2024 national drinking water standards, US$10 billion in federal remediation funding, and active DoD cleanup mandates spanning hundreds of military installations. Region-by-region, separation technologies (granular activated carbon, ion exchange, and membranes) still dominate mature regulatory markets, while destruction technologies (electrochemical oxidation, plasma, supercritical water oxidation) are gaining ground in AFFF and landfill-leachate applications worldwide.
For an industrial buyer, the timing matters more than the size. Treatment trains specified in 2026 will operate for 15–25 years, well past the next two regulatory tightening cycles. The EPA's 4 ppt MCL for PFOA and PFOS is already being mirrored in proposed EU drinking water limits, in Australia, and in several Canadian provinces. Landfill refuse data reinforces why leachate treatment is a 2026 priority: PFOA dominates landfill solids with a median concentration above 10 μg/kg (ScienceDirect, 2025), meaning every tonne of stabilized waste is also a long-duration PFAS reservoir. Decisions about whether to commit CAPEX to a separation-only train or to a separation-plus-destruction hybrid made in the next 12 months will be very difficult to reverse.
The Three PFAS Treatment Families: Separation, Destruction, and Hybrid Systems
PFAS treatment technologies fall into three operational families, and confusing them is the most common error in vendor proposals. Separation technologies concentrate PFAS into a smaller waste stream rather than eliminating it. Destruction technologies break the C–F bond and mineralize the compounds. Hybrid systems pair a separation front-end with a destruction back-end to balance CAPEX against residuals liability.
Separation covers granular activated carbon (GAC), powdered activated carbon (PAC), anion exchange resin, and nanofiltration/reverse osmosis. GAC is the workhorse: Lee et al. (2024) reported 92.5–95.3% removal across six C4–C8 PFAS species in spiked deionized water at a 20 mg/L GAC dose (per Chemosphere, ScienceDirect). That number collapses in real surface water and groundwater because dissolved organic matter (DOM) and competing inorganic anions block adsorption sites through electrostatic repulsion and pore blocking. PAC is suited to seasonal or emergency dose rather than continuous polishing. Anion exchange resin achieves lower effluent concentrations than GAC on short-chain PFAS but generates a brine regeneration stream. NF/RO produces a permeate below 10 ng/L for most species but concentrates PFAS 5–10× in the reject.
Destruction technologies — electrochemical oxidation, plasma, supercritical water oxidation (SCWO), sonochemical, and UV/sulfite — target the C–F bond. EC and SCWO are the most commercially mature for high-concentration point sources; plasma and sonochemical remain largely pilot-scale. UV/sulfite works for short-chain species but is ineffective on long-chain PFAS without pre-concentration. Hybrid configurations (GAC or IX pre-concentration feeding a destruction unit) are where 2026 procurement interest is concentrated, because they let operators defer destruction CAPEX while still meeting near-term MCLs.
| Family | Typical Technologies | Output | Best-Fit Stream |
|---|---|---|---|
| Separation | GAC, PAC, anion exchange, NF/RO | Concentrated waste stream | Drinking water, low-TDS industrial effluent |
| Destruction | EC oxidation, SCWO, plasma, UV/sulfite | Mineralized effluent + CO₂/F⁻ | AFFF concentrates, landfill leachate, industrial brines |
| Hybrid | GAC/IX + destruction | Concentrate destroyed on-site | High-concentration, high-liability sites |
Regional Breakdown: Where Each Technology Wins in 2026
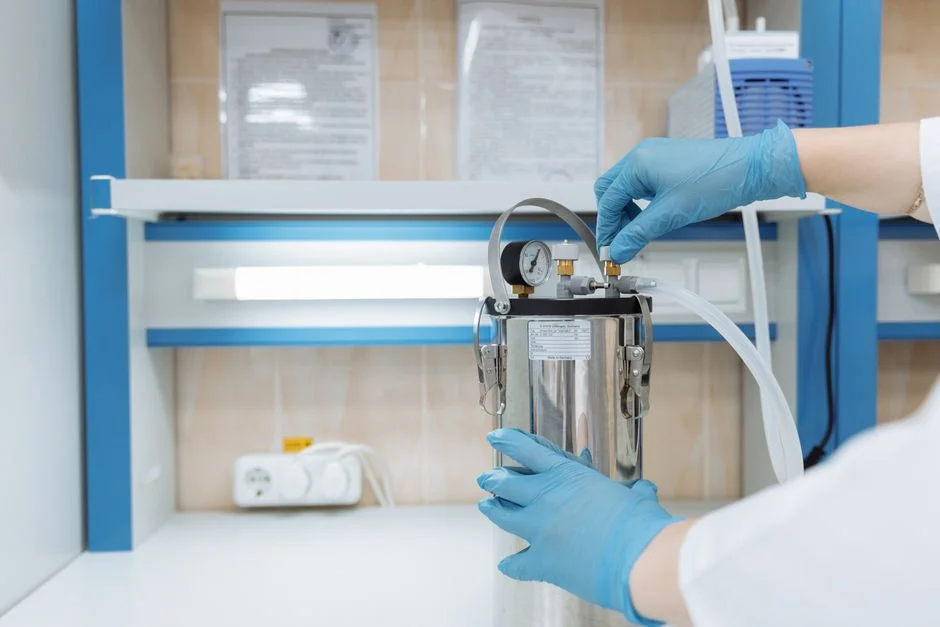
North America holds 39% of the 2026 market and remains separation-heavy: GAC and ion exchange dominate municipal PFAS installations, with destruction technology scaling fast for AFFF and DoD sites. The EPA's 4 ppt MCL for PFOA and PFOS, combined with state-level rules in Michigan, New Jersey, and California, has produced the deepest vendor ecosystem and the longest equipment lead times.
Europe is in a regulatory surge. The proposed EU PFAS restriction covers more than 10,000 substances and is pushing utilities toward ion exchange and membrane systems for drinking water, while pilot destruction plants are operating in the Netherlands and Germany. Industrial buyers in the EU should expect IX and RO to displace GAC over the next 36 months as analytical methods mature.
Asia-Pacific splits into three sub-markets. China is tightening industrial discharge PFAS limits in 2026, with focus on textile, paper, and fluorochemical parks. Japan and Australia are adopting EPA-aligned MCLs and defaulting to GAC for cost reasons. Southeast Asia is pre-regulatory, with semiconductor and electronics manufacturing driving voluntary PFAS treatment in new fab builds. Turnkey containerized systems from Chinese and European OEMs are gaining share across the region.
Middle East & Africa is pre-regulatory but active. GCC petrochemical corridors and South African mining operations are specifying PFAS treatment for process water and stormwater reuse. Procurement here is dominated by containerized hybrid skids rather than custom-built plants, because lead time and footprint matter more than per-cubic-meter cost. For a broader read on how water reuse economics are shifting in parallel, see this water reuse regional analysis 2026 industrial buyer's guide.
| Region | 2026 Market Posture | Dominant Technology | Regulatory Driver |
|---|---|---|---|
| North America | Mature, 39% global share | GAC + IX; destruction scaling for AFFF/DoD | EPA 4 ppt MCL, US$10B federal funding |
| Europe | Regulatory surge | IX, RO, pilot destruction | Proposed EU PFAS restriction, EU drinking water directive |
| Asia-Pacific | Fragmented, fast-growing | GAC default; hybrid pilots in China/Australia | China industrial discharge limits, Japan/AU MCL alignment |
| Middle East & Africa | Pre-regulatory, industrial-led | Containerized hybrid skids | Petrochem and mining ESG requirements |
Contamination Source to Technology Match: Decision Matrix
The right technology depends less on the contaminant and more on the source matrix. Industrial discharge from textile, paper, metal-plating, and semiconductor fabs is almost always co-contaminated with high COD, surfactants, and suspended solids. A DAF pre-treatment skid followed by GAC or ion exchange, with a polishing RO stage, is the current default for plants targeting sub-ppt effluent. A PLC-controlled chemical dosing system upstream of the GAC contactor protects media life by stabilizing pH and precipitating competing anions.
AFFF sites and military installations produce high-concentration point sources (often mg/L range) where separation-only trains become liability engines — every kilogram of spent media is a future disposal cost. Electrochemical oxidation and SCWO are the preferred destruction routes, sized for 1–10 m³/day pilots. AFFF source zones are also where an MBR upstream biological stage can be skipped in favor of direct chemical oxidation.
Landfills and leachate are PFOA-dominant with a complex matrix of high TDS, ammonia, and humic substances. Hybrid trains (UF → IX → destruction) are emerging as best-in-class because UF protects the IX resin and the destruction unit handles the concentrated brine. Wastewater treatment plants with biosolids concerns are piloting GAC polishing on side-stream combined with PFAS-foam fractionation, though this remains pre-commercial at municipal scale.
| Contamination Source | Recommended Train | Why |
|---|---|---|
| Industrial discharge (textile, paper, plating, semi) | DAF/coagulation → GAC or IX → RO polish | Co-contamination requires pre-treatment; RO polish for sub-ppt |
| AFFF / military installations | Direct EC oxidation or SCWO | High concentration makes separation-only a long-term liability |
| Landfill leachate | UF → IX → destruction (hybrid) | PFOA-dominant, high TDS; UF protects IX |
| WWTPs with biosolids concerns | Side-stream GAC + foam fractionation pilots | Targets recirculating load before biosolids uptake |
CAPEX and OPEX Reality Check: What Buyers Actually Pay in 2026
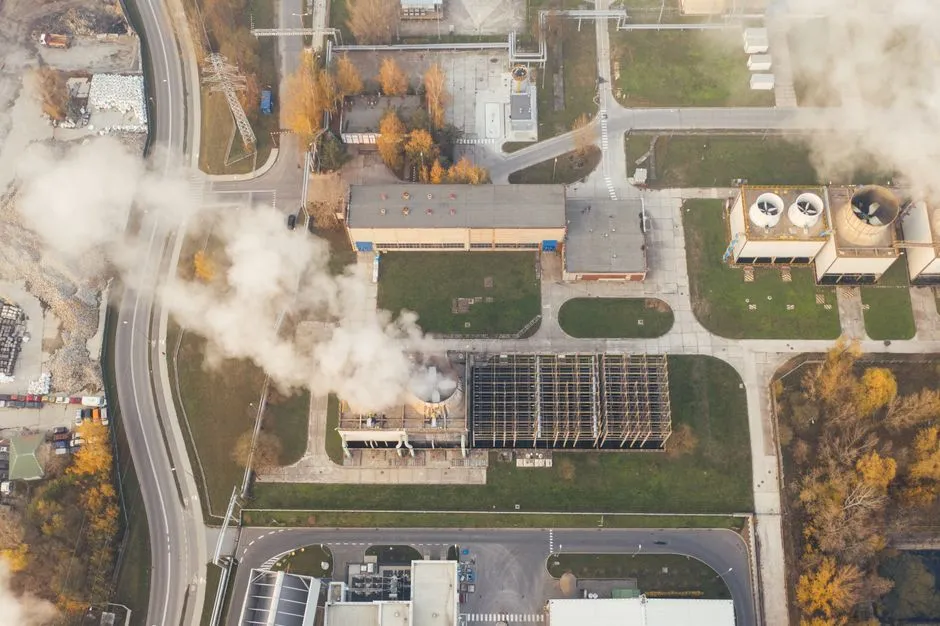
Quoted vendor numbers vary widely, but 2026 procurement benchmarks for the four most common configurations cluster as follows. A containerized GAC skid sized for 10–50 m³/day of sub-ppt polishing runs US$80K–$350K in CAPEX, with OPEX dominated by media replacement at US$3–$8 per kg of GAC. Service life depends on influent DOM and competing anions, not on PFAS loading alone.
An industrial ion exchange system at 50–500 m³/day runs US$200K–$1.2M in CAPEX, with OPEX driven by brine regeneration frequency and resin life of 3–5 years. Electrochemical oxidation pilots for high-concentration AFFF (1–10 m³/day) cost US$500K–$2.5M in CAPEX, with OPEX of US$2–$6 per m³ at energy consumption of 25–45 kWh/m³. Hybrid destruction trains carry the highest CAPEX but eliminate the long-term residuals liability that increasingly shapes ROI calculations in regulated jurisdictions. For a parallel read on membrane cost drivers shaping 2026 specs, see this Membrane Technology Market Drivers 2026: 7 Forces Reshaping Industrial Wastewater breakdown.
| System | Capacity | CAPEX (US$) | OPEX Driver |
|---|---|---|---|
| Containerized GAC skid | 10–50 m³/day | 80K–350K | Media replacement US$3–$8/kg |
| Industrial IX system | 50–500 m³/day | 200K–1.2M | Brine regen, resin 3–5 yr life |
| EC oxidation pilot | 1–10 m³/day | 500K–2.5M | Energy 25–45 kWh/m³, US$2–$6/m³ |
| Hybrid destruction train | Site-specific | Highest | Eliminates residuals liability |
What Mid-Regulation Regions Should Do Now
Industrial buyers in China, the GCC, Southeast Asia, and Latin America face a different problem from their NA/EU peers: PFAS rules are still forming, but vendor lead times for the most mature destruction technologies are already extending as North American and European orders absorb 2026 production capacity. Four actions are defensible today.
First, specify treatment trains with upgradeable destruction capacity rather than committing to separation-only CAPEX. Second, pre-test influent across the full C4–C14 PFAS spectrum, not just PFOA/PFOS, because 2027–2028 regulations in China, Korea, and the GCC are expected to mirror EPA's broader analyte list. Third, audit the supply chain for PFAS-containing process aids — surfactants, fluoropolymer coatings, mist suppressants — to reduce influent loading at source, which is almost always cheaper than end-of-pipe treatment. Fourth, engage with hybrid-OEM vendors now while lead times remain moderate; for context on COD-driven decisions that often run in parallel, see the Best Technology for COD Removal in Industrial Wastewater (2026 Guide).
Frequently Asked Questions
What is the size of the global PFAS treatment market in 2026? The global PFAS treatment market is valued at US$2.1 billion in 2026, forecast to reach US$3.0 billion by 2033 at a 5.2% CAGR, with North America holding a 39% share.
How effective is granular activated carbon for PFAS removal? GAC achieves 92.5–95.3% removal for C4–C8 PFAS in spiked deionized water at a 20 mg/L dose (Lee et al., 2024); real-surface-water performance drops materially because dissolved organic matter and competing anions block adsorption sites.
Which PFAS treatment technology fits AFFF site remediation? High-concentration AFFF sources favor destruction — electrochemical oxidation or supercritical water oxidation — over separation-only trains, because spent media from GAC/IX becomes a long-term disposal liability.
What does a containerized PFAS removal skid cost in 2026? A 10–50 m³/day containerized GAC skid runs US$80K–$350K in CAPEX with OPEX of US$3–$8 per kg of media; electrochemical oxidation pilots at 1–10 m³/day run US$500K–$2.5M in CAPEX and US$2–$6 per m³ in OPEX at 25–45 kWh/m³ energy use.
Which region is the fastest-growing PFAS treatment market in 2026? North America holds the largest share at 39%, but Asia-Pacific is the fastest-growing as China tightens industrial discharge PFAS limits in 2026 and Japan/Australia adopt EPA-aligned MCLs.