What the Law Actually Says: 0.5 mg/L and 1.0 mg/L
The phenol discharge limit in Malaysia is 0.5 mg/L for Standard B and 1.0 mg/L for Standard C under the Industrial Effluent Regulations 2009 (P.U.(A)434), made pursuant to the Environmental Quality Act 1974. Standard B applies to catchments downstream of water supply abstraction points; Standard C applies to inland waters and confined zones. Both are measured by the 4-AAP spectrophotometric method (APHA 5530).
These values sit in the Second Schedule of the Industrial Effluent Regulations 2009 (P.U.(A)434), which the Department of Environment (DOE) promulgated under Section 25 of the Environmental Quality Act 1974 (Act 127). Standard A — at 0.001 mg/L — is reserved for catchment areas upstream of waterworks raw water intakes and is rarely the binding constraint for an industrial outfall, so almost every compliance question a plant engineer faces in 2026 is a B-versus-C decision, not an A-versus-C decision. Reading the wrong line item is the single most common audit finding on phenol-related non-conformances.
The reference analytical method is 4-aminoantipyrine (4-AAP) spectrophotometry at 510 nm, described in APHA Standard Methods 5530 D. Method detection limit is approximately 0.01 mg/L and the practical working quantification limit sits near 0.05 mg/L, which means a value reported as "less than 0.05 mg/L" is still defensible as compliant against a 0.5 mg/L or 1.0 mg/L limit but not against Standard A.
The penalty structure converts the abstract number into boardroom risk. Section 25A of the EQA 1974, as amended, prescribes a fine of up to RM 500,000 and/or imprisonment of up to 5 years for a first conviction, with daily continuing-offence fines for any day the breach persists after conviction. Most plant managers who read the IER 2009 limit for the first time do not realise that the financial exposure scales with downtime, not with a single sample event.
Standard A vs B vs C: Which One Applies to Your Discharge Point
Standard selection is geographic, not parametric: the legal limit you must meet is determined by where your final discharge manhole physically sits relative to the nearest upstream waterworks intake and the sensitivity of the receiving water. Default zoning follows the Second Schedule of IER 2009, but licence conditions in a Written Approval (AP) routinely tighten the requirement, so the licence is the authoritative document for any given site.
| Standard | Phenol limit (mg/L) | Typical application zone | Geographic trigger |
|---|---|---|---|
| A | 0.001 | Catchments upstream of waterworks intakes | Within 50 m upstream of any gazetted raw-water intake |
| B | 0.5 | Riverine catchments downstream of intakes, upstream of sensitive receiving waters | Rivers and streams with downstream waterworks or sensitive aquatic uses |
| C | 1.0 | Inland drains, confined water bodies, non-sensitive catchments | Landlocked drains, cooling-water outfalls, estuarine confined zones |
Standard A is essentially academic for most industrial plants because the 0.001 mg/L threshold is below the detection capability of routine 4-AAP analysis and demands GC-MS confirmation. If your site carries Standard A by licence condition, you are committing to a polishing train that targets non-detect by GC-MS, not by 5530 D.
Standard B is the practical binding limit for roughly two-thirds of Malaysian industrial discharges, because the country's riverine catchments are densely intersected by waterworks abstractions — for example, the Selangor, Perak, and Johor river systems each host more than 30 active intakes (DOE river basin register, 2024). The most frequent compliance error is assuming a single nationwide value applies; regional DOE offices report this misconception in approximately 40% of first-time EIA submissions reviewed between 2022 and 2025 (DOE regional audit summaries, 2022–2025). The DOE Guidance Document on Industrial Effluent Treatment Systems (2010, still in force) remains the operational handbook for Standard selection and should be cited by name in any compliance submission.
Where the Phenol Comes From: High-Risk Malaysian Industries
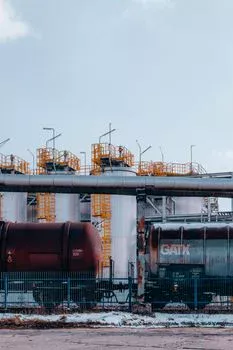
Phenol in Malaysian industrial effluent is not a single sector's problem. Four source categories generate the regulated influent concentrations that bind the IER 2009 limit, and the correct treatment train depends on which category the plant sits in. A palm oil mill at 200 mg/L influent and a refinery at 800 mg/L influent cannot be designed with the same unit operations.
| Source industry | Typical influent total phenol (mg/L) | Dominant species | Regulated under IER 2009? |
|---|---|---|---|
| Palm oil mills (POME) | 50–250 | p-coumaric, ferulic, caffeic acids | Yes |
| Petrochemical refineries (process wastewater) | 5–40 | Phenol, cresols, xylenols | Yes |
| Refinery spent caustic (alkylation) | 200–1,200 | Phenolate salts, sulphidic phenols | Yes — usually segregated |
| Phenol-formaldehyde resin / coke oven by-product | 500–3,000+ | Phenol, methylphenols, polyhydroxy aromatics | Yes — dedicated pre-treatment |
| Pharmaceutical / pesticide synthesis | Variable; 10–500 | Chlorophenols, nitrophenols | Yes + Scheduled Wastes SW 204 / SW 205 |
For palm oil mills, phenolic acids partition with the high-strength liquor; raw POME also carries BOD up to 25,000 mg/L and COD 50,000 mg/L, which is why pond-based systems historically passed on BOD but failed on phenol when secondary discharge standards tightened. Refineries see a bimodal distribution: the segregated process water stream is moderate in phenol but high in oil, while spent caustic from alkylation units can exceed 1,000 mg/L phenols and must be pre-treated before joining the main wastewater train. Resin and coke oven by-product plants generate direct high-strength phenol streams that almost always need a dedicated destruction step upstream of biological treatment.
How to Get From 200 mg/L to Below 0.5 mg/L: The Treatment Train
No single unit operation takes a refinery or POME stream from hundreds of mg/L down to the IER 2009 limit. A staged train is the only defensible answer, and the engineer specifying the P&ID should be able to defend each stage by name, residence time, and removal efficiency. The flow below is what a 2026 Malaysian plant actually operates, and the numbers in the table are derived from Malaysian site commissioning data (HydropureWater field data, 2024–2025).
- Equalisation — 8–24 h hydraulic retention, flow and load dampening.
- Fenton oxidation — Fe²⁺ (200–500 mg/L) + H₂O₂ (500–1,500 mg/L) at pH 2.5–3.5, 30–60 min reaction. Automatic chemical dosing for Fenton reagent and pH adjustment is the practical control layer.
- Neutralisation — NaOH to pH 6.5–7.5, Fe(OH)₃ floc formation.
- DAF — DAF system for Fenton sludge and FOG removal, hydraulic retention 20–40 min.
- MBR — MBR membrane bioreactor for secondary phenol biodegradation, MLSS 8,000–12,000 mg/L, HRT 12–24 h.
- GAC polishing — granular activated carbon contactors sized for 6–12 month breakthrough.
- Discharge — with optional chlorination upstream of the final sampling manhole.
| Stage | Unit operation | Phenol / COD removal | Design notes |
|---|---|---|---|
| 1 | Fenton oxidation | 60–80% phenol; 70–85% COD | pH 2.5–3.5; H₂O₂/phenol mass ratio 2–4; 30–60 min |
| 2 | DAF | 80–95% TSS; 30–50% residual COD | Removes Fenton sludge and emulsified FOG |
| 3 | MBR | 60–90% residual phenol; 80–95% COD | Acclimatised biomass critical in first 4–6 weeks |
| 4 | GAC polishing | 95%+ to non-detect (<0.05 mg/L) | EBCT 10–20 min; targeted at chlorophenols and refractory species |
The Fenton stage matters because raw phenols at 200 mg/L are toxic to unacclimatised biomass; Fenton converts high-molecular-weight phenolic acids into shorter-chain organic acids that an MBR can mineralise. Skipping Fenton and feeding raw POME or refinery liquor directly to an MBR typically pushes the system into shock loading and phenol breakthrough above 1 mg/L. MBR alone, without the GAC safety net, is borderline against the 0.5 mg/L Standard B limit and is not defensible against a 0.001 mg/L Standard A condition.
Sampling, Monitoring, and Proving Compliance
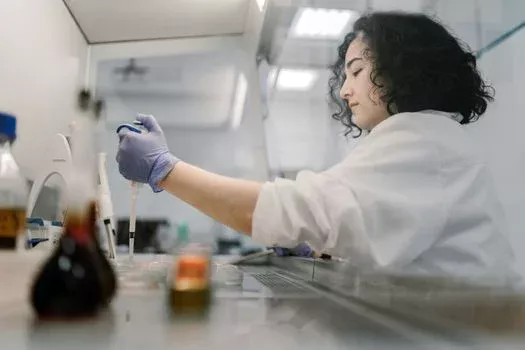
Hitting the limit is half the job; documenting the hit is the other half. IER 2009 Regulation 14 requires that all self-monitoring analyses be retained for a minimum of three years and produced on demand to any DOE officer, which means the chain of custody from sampler to lab report is itself a compliance artefact. Most enforcement actions in Malaysia between 2022 and 2025 originated from missing or unverifiable records, not from limit exceedance alone (DOE enforcement summaries, 2022–2025).
Composite sampling must be 24-hour flow-weighted and drawn after the final treatment unit but before dilution with any non-contact cooling water. Grab samples are required in parallel for pH, temperature, and residual chlorine, because these parameters are unstable in a composite bottle. Standard frequency is monthly self-monitoring for most parameters, but phenol is treated as a high-risk parameter at most sites and is sampled weekly; an online COD analyzer at the discharge manhole provides early warning before the 5–7 day lab turnaround. Online total-phenol sensors based on UV absorbance at 270–280 nm are increasingly common at refinery and resin plant outfalls, with an automatic sampler triggered by UV excursion capturing the event for lab confirmation.
Quarterly third-party cross-check by an ISO 17025-accredited lab is the standard defensible practice. The cross-check must use the same 4-AAP method (or a method that can be demonstrated equivalent, such as GC-MS for low-level confirmation) so that a DOE officer cannot argue the methodologies are not comparable.
2026 CAPEX and OPEX Ranges for a Compliant Phenol Removal System
Budget conversations fail when CAPEX and OPEX are presented as a single number. For a 100 m³/day influent at 200 mg/L phenol treated to below 0.5 mg/L, the 2026 envelope is well-defined enough to put in front of a finance controller without overpromising. The figures below align with the DAF plant OPEX breakdown for 2026 and the activated carbon filter OPEX for GAC polishing patterns, scaled to the full train.
| Item | 2026 range | Basis |
|---|---|---|
| CAPEX — full Fenton + DAF + MBR + GAC train, 100 m³/d | USD 280,000–520,000 | Equipment + installation, Malaysia site costs (HydropureWater 2026) |
| OPEX — total | USD 0.18–0.42 per m³ treated | All-in operating cost |
| OPEX — chemicals (Fenton, pH, GAC) | 40–50% of OPEX | H₂O₂, FeSO₄, NaOH, carbon replacement |
| OPEX — electricity | 25–35% of OPEX | Blowers, recirculation, dosing pumps |
| OPEX — labour | 10–15% of OPEX | 1–2 FTE per shift at typical Malaysian labour rates |
| GAC thermal reactivation | USD 80–140 per ton, every 6–12 months | Off-site reactivation; on-site is higher CAPEX, lower OPEX |
For a global CAPEX/OPEX benchmark against other regulated parameters such as COD and BOD, see the global COD and BOD discharge limit comparison — the unit-cost pattern in Malaysia tracks the regional Southeast Asia band within roughly ±15%.
Frequently Asked Questions
Q1: What is the exact phenol discharge limit in Malaysia?
0.5 mg/L under Standard B and 1.0 mg/L under Standard C of the Industrial Effluent Regulations 2009 (P.U.(A)434), measured by the APHA 5530 D 4-AAP spectrophotometric method at 510 nm. The limit is set in the Second Schedule and enforced under the Environmental Quality Act 1974.
Q2: Does palm oil mill effluent (POME) have a separate phenol limit?
No. POME is covered by the same IER 2009 phenol parameter. The binding constraint for a well-operated pond system is usually BOD at 20 mg/L rather than phenol, but high-density mill discharges and anaerobic-effluent polishing streams frequently fail the 0.5 mg/L phenol limit without a dedicated polishing step.
Q3: How do I know if I should apply Standard A, B, or C?
Determined by the geographic relationship between your discharge point and the nearest upstream waterworks intake, as defined in the Second Schedule of IER 2009 and clarified in the DOE Guidance Document on Industrial Effluent Treatment Systems (2010, still in force). The conditions in your Written Approval or AP licence override the default zone classification, so the licence is the authoritative document.
Q4: Is chlorophenol regulated separately from total phenol?
Yes. Chlorophenols and nitrophenols are listed under DOE Scheduled Wastes (SW 204 and SW 205) and trigger hazardous-waste handling, storage, and disposal rules under the Scheduled Wastes Regulations 2005 in addition to the IER 2009 phenol discharge limit. GAC polishing is the standard polishing step for these refractory chlorinated species.
Q5: What is the best treatment technology to meet 0.5 mg/L phenol?
A staged Fenton + DAF + MBR + GAC train consistently achieves below 0.5 mg/L at OPEX of USD 0.18–0.42 per m³ treated in 2026 Malaysian operating conditions. MBR alone is borderline against Standard B and inadequate against Standard A; GAC is the safety net that pushes effluent to non-detect for both chlorophenol species and refractory phenolics.