PFAS Removal Technology Choices for Industrial Plants in 2026
No single PFAS removal technology meets every industrial effluent target in 2026. Plants separate PFAS with GAC, anion exchange, or RO/NF, then destroy spent media or concentrate. Separation alone leaves a C–F-bearing secondary waste that still needs handling. Standalone destruction on raw wastewater is rarely the lowest-cost path at plant scale.
Per- and polyfluoroalkyl substances (PFAS) cover more than 12,000 fluorinated organic compounds in industrial and municipal waters. They are defined by carbon–fluorine (C–F) bonds with dissociation energies around 485 kJ/mol. That bond strength is why conventional biological wastewater treatment fails on PFAS. Chlorine, ozone, and UV-AOP at typical drinking-water doses also fail to mineralize PFAS at meaningful rates. The molecule must move into a smaller stream or have its backbone broken chemically. Those two jobs rarely share one piece of hardware on a plant site.
According to the EPA's Technologies for Reducing PFAS in Drinking Water guidance, GAC and anion exchange resin (AER) can be 100% effective for a limited service window. That window depends on chain length, bed depth, flow rate, temperature, background organic matter, and competing ions. Tetra Tech's 2025 review of innovative PFAS treatment makes the matching point on the destruction side. Short-chain PFAS such as PFBA (C4), PFPeA (C5), and PFHxA (C6) resist both adsorption and many destruction chemistries. Some advanced oxidation processes can form shorter-chain PFAS or regulated fluorinated intermediates. The four families — GAC, IX, RO/NF, and destruction — each win in a different region of chain length, effluent target, and concentrate disposal.
Master Comparison: GAC vs IX vs RO/NF vs Destruction at a Glance
A procurement reader needs all four families side-by-side before any deep-dive into design tables. The comparison table below integrates destruction with the three separation options used on industrial sites. It also shows short-chain performance next to long-chain results, plus a CAPEX band per m³/day of installed capacity. Use it to choose which sections to read next for your feed.
| Technology | Removal mechanism | PFOA/PFOS (long-chain, C8) removal | PFBA/PFPeA (short-chain, C4–C5) removal | Secondary waste stream | Indicative CAPEX (USD per m³/day, 2026) |
|---|---|---|---|---|---|
| Granular activated carbon (GAC) | Hydrophobic adsorption onto micropores | >99% until breakthrough (per EPA) | 20–60% — short chains adsorb poorly | Spent carbon, ~1–5% of treated volume as solid waste | $50–150 |
| Anion exchange resin (IX) | Electrostatic exchange onto quaternary-amine sites | >99% until breakthrough (per EPA) | 40–80% — resin selectivity drops with chain length | Spent brine regenerant, 5–10% of treated volume | $80–200 |
| Nanofiltration / low-pressure RO | Size exclusion + charge repulsion | >99% rejection across C4–C14 | 85–99% — RO closes the gap; NF partially misses <200 Da | Concentrate brine, 15–25% of feed volume | $200–500 |
| Destruction (SCWO, electrochemical, UV/sulfite, eBeam) | C–F bond cleavage (thermal, electrolytic, radiolytic, reductive) | ≥99.99% (4-log) destruction when properly designed | Variable — UV/sulfite and SCWO effective; eBeam demonstrated for soils/sediments (Tetra Tech / DoD ESTCP, 2025) | Off-gas (HF scrubbing required), spent electrolyte, no aqueous PFAS effluent | $500–2,000 |
SL Environmental Law Group's 2025 review lists GAC, IX, and NF/RO as the three core PFAS trains for water utilities. This article adds the destruction column because every separation train produces concentrate or spent media. That secondary stream must still be handled under hazardous-waste or destruction rules. Handling cost is the dominant 10-year OPEX line on most industrial PFAS projects we review. Most plants we size for industrial discharge run at the lower end of each CAPEX band until concentrate disposal is priced in.
Which PFAS Removal Technologies Suit Industrial Wastewater?
Industrial wastewater PFAS trains differ from drinking-water contactors mainly by higher TOC, oils, surfactants, and competing anions. The same four technology families still apply on those harder matrices. Pre-treatment quality and waste routing usually decide which family wins the bid. Match the GAC, IX, membrane, and destruction options below to your chain-length mix and disposal route before locking a vendor package.
Granular Activated Carbon (GAC): The Mature Default for Long-Chain PFAS
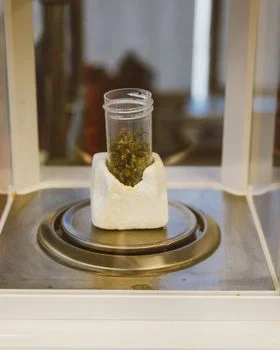
GAC works by hydrophobic adsorption of PFAS onto carbon micropores. Long-chain PFAS (PFOA, PFOS, PFNA, PFHxS — C6 to C14) partition into pores in the 0.5–2 nm range. Short-chain PFAS are too water-soluble and too small to fill those pores efficiently. GAC performance therefore collapses once chain length drops below roughly C6 on industrial contactors. Per the EPA, GAC is 100% effective for a period set by several design variables. Those variables include the PFAS mix, carbon type (bituminous, lignite, coconut-shell), bed depth, flow rate, temperature, background TOC, and competing constituents. That service period is the design variable, not a fixed calendar number.
Industrial GAC contactors for PFAS typically run at an empty bed contact time (EBCT) of 10–20 minutes for PFOA/PFOS service. Bed depth is usually 1.5–3.0 m on industrial pressure vessels. Media changeout intervals of 6–18 months are common on industrial feed with moderate TOC. Backwash every 2–7 days keeps the bed classified and head loss in range. Spent carbon is hazardous once saturated with PFAS. It must be thermally reactivated at 800–900 °C or sent for high-temperature destruction. That recurring OPEX line drives lifecycle cost more than vessel CAPEX. For influent with high suspended solids, specify a multi-media pre-filter ahead of a GAC or RO contactor to keep the carbon bed from blinding. Reference the 2026 activated carbon OPEX breakdown for changeout-cost modeling on industrial duty.
| Parameter | Typical industrial design value |
|---|---|
| EBCT (PFOA/PFOS service) | 10–20 min |
| Bed depth | 1.5–3.0 m |
| Hydraulic loading | 6–12 m/h |
| Media changeout interval | 6–18 months (industrial feed) |
| Backwash frequency | Every 2–7 days |
| Spent-media handling | Thermal reactivation (800–900 °C) or high-temp destruction |
Anion Exchange (IX) Resins: Faster Kinetics, Tighter Footprint, Biofouling Risk
Single-use anion exchange resin removes PFAS by electrostatic exchange on quaternary-amine sites. PFAS anions (PFOA⁻, PFOS⁻, GenX⁻, PFBS⁻) displace chloride or hydroxide on a styrenic or acrylic bead. The mechanism is ion-driven rather than diffusion-driven through micropores. IX therefore reaches >99% removal at 10–20 bed volumes per hour on clean industrial feed. That hydraulic loading is roughly twice a comparable GAC contactor at equal removal. Footprint is typically 30–50% smaller than an equivalent GAC train. Per the EPA, AER is 100% effective for a window set by resin selectivity, bed depth, flow rate, and background organic matter. That window is generally longer than GAC for long-chain PFAS on low-sulfate water. The resin's selectivity coefficient for PFOA over chloride is on the order of 10²–10³. Selectivity collapses as chain length drops and as sulfate, bicarbonate, or natural organic matter rises.
Two operational risks define the IX business case on industrial sites. First is biological fouling inside the resin bed. SL Environmental Law Group's 2025 review flags the lack of a disinfection residual in many IX vessels. Heterotrophic bacteria can build head loss and later slough captured PFAS downstream of the bed. Plan for periodic in-situ disinfection, typically 0.5–1% NaOCl weekly, or keep a feed-water residual. Second, regenerable resins trade spent-carbon solids for a brine waste stream. Brine volume is 5–10% of treated volume and holds 2–8% NaCl plus displaced PFAS. That brine must still be destroyed or solidified under hazardous-waste rules. Pair the IX loop with a PLC-controlled chemical dosing skid for IX regeneration to keep brine strength and pH on setpoint.
| Parameter | Typical industrial design value |
|---|---|
| Service flow rate | 10–20 BV/h |
| Bed depth | 0.8–1.5 m |
| Regeneration brine volume | 5–10% of treated water |
| Brine concentration | 2–8% NaCl + caustic |
| Resin life (single-use) | 3–7 years |
| Competing-ion sensitivity | Sulfate > bicarbonate > chloride (selectivity order) |
Nanofiltration and Reverse Osmosis: >99% Rejection, Concentrate Is the Catch
Nanofiltration and low-pressure reverse osmosis reject PFAS by size exclusion at the membrane. NF pores are about 0.3–0.5 nm, while RO pores are <0.2 nm under operating pressure. Charge repulsion at the membrane surface reinforces rejection for anionic PFAS. NF removes most PFAS of molecular weight ≥200 Da (PFOA at 414 Da, PFOS at 500 Da) at 90–99% rejection. RO removes virtually all PFAS regardless of chain length, with >99% rejection reported for C4 through C14 in peer-reviewed work. npj Clean Water (2023) demonstrated a dual-functional mixed-matrix composite NF membrane for PFOA removal from drinking water. The SL Environmental Law Group review places NF and low-pressure RO with GAC and IX as mainstream PFAS trains.
Membranes are the only separation family that does not weaken on short-chain PFAS in industrial service. RO is therefore the default for effluent targets below 10 ng/L total PFAS, or for feeds dominated by C4–C6 species. The operating penalty is the concentrate stream leaving the array. A unit at 75–85% recovery produces 15–25% of feed as PFAS-loaded brine at 4–7× feed concentration. Low-pressure RO typically runs at 10–30 bar transmembrane pressure on industrial TDS. Specific energy is about 0.5–1.5 kWh/m³ permeate under those conditions. Concentrate management is the real economic decision, not the membrane module itself. The three routes are solidification and hazardous-waste landfill (legacy, increasingly restricted), second-pass high-pressure RO to shrink volume, or feed to SCWO or electrochemical oxidation. For a turnkey package, specify an industrial RO system for PFAS rejection rated for the design recovery and the feed TDS.
| Parameter | Low-pressure RO (industrial) | Nanofiltration (tight NF) |
|---|---|---|
| PFAS rejection (≥C4) | >99% | 85–99% |
| Recovery | 75–85% | 80–90% |
| Concentrate volume | 15–25% of feed | 10–20% of feed |
| Transmembrane pressure | 10–30 bar | 5–15 bar |
| Specific energy | 0.5–1.5 kWh/m³ permeate | 0.3–0.8 kWh/m³ permeate |
Destruction Technologies: SCWO, Electrochemical, UV/Sulfite, and Electron Beam
Destruction breaks the C–F bond instead of moving PFAS into another waste form. Four chemistries are credible at industrial scale in 2026 for concentrate service. Supercritical water oxidation (SCWO) operates above 374 °C and 221 bar on aqueous organics. Water becomes a non-polar solvent, organics oxidize rapidly, and PFAS mineralize to CO₂, F⁻, and sulfate. Electrochemical oxidation (EO) uses boron-doped diamond or mixed-metal-oxide anodes in a flow cell. Hydroxyl radicals and direct electron transfer at the anode surface achieve >99% defluorination on a wide PFAS set when chloride is managed. UV/sulfite generates hydrated electrons (e_aq⁻) that reductively defluorinate PFAS in clear matrices. The chemistry is effective on short chains but sensitive to nitrate and dissolved oxygen. Electron beam (eBeam) uses high-energy electrons to radiolyze water into reactive species. Tetra Tech and the U.S. DoD ESTCP program are operating a mobile eBeam prototype for on-site PFAS-impacted soil and sediment treatment in 2025–2026. That program is the clearest signal that destruction is moving out of the lab.
Each destruction method has a known failure mode on real industrial matrices. Tetra Tech's 2025 review warns that some processes can form shorter-chain PFAS, fluorinated intermediates, or HF gas. Influent characterization and off-gas scrubbing are therefore not optional on any destruction skid. Target destruction is ≥99.99% (4-log) on the parent compound so daughter-product risk stays acceptable. Energy demand is the screening metric on most bids: 5–50 kWh/m³ treated depending on matrix, versus 0.5–1.5 kWh/m³ for an RO permeate. The realistic 2026 model couples destruction to a separation train rather than raw wastewater. Feed RO concentrate, IX brine, or GAC reactivation off-gas into the destruction skid. Do not plan a standalone destruction plant on untreated industrial wastewater.
| Technology | Mechanism | Target destruction | Energy (kWh/m³) | Commercial readiness (2026) |
|---|---|---|---|---|
| SCWO | Thermal hydrolysis + oxidation at >374 °C / 221 bar | ≥99.99% | 15–50 | Commercial (multiple vendors, brine and sludge service) |
| Electrochemical oxidation | Anodic oxidation on BDD/MMO anodes | ≥99.99% | 5–25 | Commercial pilots, scaling to full-scale in 2026 |
| UV/sulfite | Hydrated electron reductive defluorination | ≥99% (matrix-dependent) | 5–15 | Pilot, sensitive to NO₃⁻ and DO |
| Electron beam (eBeam) | Radiolysis of water, secondary radical attack | ≥99% on soils/sediments (Tetra Tech / DoD ESTCP, 2025) | 10–30 | Mobile prototype, soil/sediment service 2025–2026 |
What Is the Best Technology to Remove PFAS from Industrial Wastewater?
The best technology to remove PFAS from industrial wastewater is the train that meets the effluent target at the lowest 10-year cost of concentrate or spent-media handling. Five steps separate a defensible specification from an expensive mistake on industrial projects. Walk them in order before you freeze CAPEX.
- Characterize the influent. Measure total PFAS by USEPA Method 533 or 537.1 on a representative composite. Record chain-length distribution (C4 vs C8 vs C14), background TOC, competing anions (sulfate, chloride, bicarbonate), and flow rate. A short-chain fraction >30% rules out GAC as a standalone polish.
- Define the effluent target. U.S. drinking-water MCLs sit at 4 ng/L for PFOA and 4 ng/L for PFOS under the 2024 final rule. Industrial discharge permits are typically expressed in µg/L — one to three orders of magnitude looser than drinking water. Pretreatment programs and product-stewardship requirements in textile, paper, fluoropolymer, and electroplating plants routinely tighten targets to ng/L. The written target sets the technology floor for the bid.
- Pick the separation train. Long-chain dominated feed with moderate organics and landfill access for spent media points to GAC. The same feed with a tighter footprint and a brine-disposal route points to IX. Mixed chain length or a sub-10 ng/L target points to RO/NF. High flow, no concentrate outlet, or a sustainability mandate points to a destruction-coupled train.
- Specify concentrate or spent-media handling. This OPEX driver usually determines the winner on a 10-year cash-flow view. Solidification plus landfill, second-pass RO volume reduction, and on-site destruction each carry a different cost and regulatory exposure. If oils or surfactants load the feed, a Dissolved Air Flotation (DAF) System upstream of GAC, IX, or RO cuts fouling risk. See also the DAF vs oil-water separator comparison for pre-treatment when free oil is present.
- Pilot for 60–90 days. The parameter tables in this article are screening-level only and assume stable feed. Real feed organics, temperature swings, and transient spikes change breakthrough behavior by 2–3× on many sites. For online monitoring during piloting and full-scale operation, see the PFAS online monitoring sensor pricing guide.
Selection checklist for industrial buyers
- Chain-length split measured (C4–C6 vs ≥C8) on a Method 533/537.1 package
- Effluent target stated in ng/L or µg/L with permit or product-stewardship driver
- Concentrate or spent-media outlet named (landfill, second-pass RO, or destruction)
- Competing anions and TOC quantified for IX and GAC breakthrough modeling
- Oil/surfactant load screened; DAF or oil-water separation specified if needed
- 60–90 day pilot planned before full-scale media or membrane purchase
- 10-year OPEX of waste handling priced, not only installed CAPEX
2026 Cost Bands and Where PFAS Treatment Is Heading
Order-of-magnitude 2026 cost bands per cubic meter per day of installed capacity come from current vendor quotes and recent municipal procurement documents. Treat them as a range to validate with formal quotes from two or more vendors. Do not commit a budget line to the midpoint of a published band. A PFAS removal technology that looks cheap on CAPEX often loses once media changeout or brine destruction is included.
| Technology | CAPEX (USD/m³/day, 2026) | Dominant OPEX driver | Typical 10-year OPEX as % of CAPEX |
|---|---|---|---|
| GAC contactors | $50–150 | Media changeout, thermal reactivation | 150–300% |
| IX resin system | $80–200 | Resin replacement, brine disposal | 120–250% |
| NF / low-pressure RO | $200–500 | Membrane replacement, energy, concentrate disposal | 80–180% |
| Destruction skid (SCWO, EO, eBeam) | $500–2,000 | Energy, electrode wear, off-gas treatment | 100–250% |
Destruction is the area of greatest change across the 2025–2026 project pipeline. Commercial SCWO units already run on PFAS-bearing industrial brines at multiple vendor sites. Electrochemical oxidation is moving from pilot skids to full-scale duty at several U.S. industrial locations. The DoD ESTCP mobile eBeam prototype (Tetra Tech, 2025) is the first credible signal that destruction can sit at the point of generation rather than after hauling. Expect destruction-coupled RO/NF trains to displace standalone GAC/IX in high-flow industrial applications by 2027–2028. Electroplating, fluoropolymer manufacturing, paper, and textile plants will feel that shift first as concentrate-disposal costs rise.
Who This Is For / Next Step
This guide is for plant engineers, EPC contractors, and procurement managers sizing industrial or municipal PFAS trains against ng/L or µg/L targets. It is not a substitute for a site-specific treatability study on unusual precursor mixes. Unknown precursor profiles and no-detect off-gas limits still need dedicated pilot data. If you already have Method 533/537.1 results and a draft effluent target, send flow, chain-length split, and waste-outlet constraints through our PFAS treatment inquiry form for a scoped design package.
Frequently Asked Questions
What is the best single technology for PFAS removal in 2026?
No single unit. The best train pairs a separation step (GAC, IX, or RO/NF) with destruction of the resulting concentrate or spent media. RO gives the broadest chain-length coverage with >99% rejection across C4–C14, but the 15–25% concentrate at 75–85% recovery must still be handled or destroyed.
Does GAC remove short-chain PFAS such as PFBA and PFHxA?
Poorly. Short-chain PFAS (C4–C6) adsorb only 20–60% on GAC and breakthrough within weeks on typical industrial contactors. EPA and state guidance therefore treat GAC as a long-chain (roughly ≥C6) solution, not a standalone short-chain polish.
Can PFAS be destroyed rather than just concentrated?
Yes. Supercritical water oxidation, electrochemical oxidation, UV/sulfite, and electron beam have all demonstrated ≥99% destruction of PFAS at pilot or commercial scale. SCWO and electrochemical oxidation are the most deployment-ready options for industrial brine and concentrate service in 2026.
What influent PFAS level triggers treatment for an industrial discharger?
U.S. industrial discharge permits typically trigger action in the 0.1–10 µg/L total-PFAS range, depending on receiving-water classification. Product-stewardship drivers in textile, paper, and fluoropolymer plants often push internal targets down into the ng/L range even when the permit is looser.
What is the 2024 U.S. drinking-water MCL for PFOA and PFOS?
4 ng/L each, per the EPA PFAS National Primary Drinking Water Regulation final rule (April 2024). HFPO-DA (GenX), PFNA, and PFHxS carry individual MCLs of 10 ng/L under that same final rule. Industrial permits may sit higher in µg/L, but product-stewardship specs often mirror these ng/L drinking-water numbers.