IPA wastewater treatment MBR vs EOx comes down to discharge target: MBR delivers over 99% COD removal for reuse, EOx cuts over 85% of COD at neutral pH while raising flash point above 201°F for sewer discharge.
Why IPA Wastewater Treatment Is a Regulatory and Cost Pressure Point
IPA wastewater treatment fails or pays based on three numbers: acetone at or below 20.7 mg/L daily under EPA 40 CFR Part 439, COD under 50 mg/L for many sewer permits, and a flash point above 140°F for sewer acceptance. MBR serves reuse targets; EOx serves flash-point and budget limits.
A pharmaceutical plant received an EPA violation when acetone, a common IPA-degradation byproduct, exceeded the permitted maximum daily of 20.7 mg/L and maximum monthly average of 8.2 mg/L under 40 CFR Part 439 pretreatment standards. Electronics manufacturers face different pressure. Scrubber blowdown typically runs 70,000–80,000 mg/L COD with flash points below 140°F, so most sites ship it off-site for incineration at $0.50–$1.50 per gallon.
Neat IPA earns that fire-code attention. Wikipedia lists its closed-cup flash point at 13 °C (55 °F) — far below the 140°F sewer threshold — and notes it "is miscible in water", which is why rinse streams carry it everywhere. Dilute streams stay flammable longer than most teams expect before treatment.
The regulatory frame is layered: EPA 40 CFR Part 439 for pharmaceuticals, the EU Industrial Emissions Directive 2010/75/EU, and local POTW limits on acetone and COD. Earlier summaries cited fines near $50,000 per day. Under 40 CFR Part 19 inflation adjustments, Clean Water Act civil judicial penalties under 33 U.S.C. Permit revocation or toxicity events can still follow a treatment-system failure.
IPA Wastewater Treatment MBR vs EOx: How the Technologies Compare
IPA wastewater treatment MBR vs EOx is a discharge-target decision, not an efficiency contest. The question "IPA or EOx which is better" resolves only after the permit limits and the water balance sit on the same table. AOPs join the shortlist when total mineralization is the goal.
An MBR uses submerged 0.1 μm PVDF membranes to deliver >99% COD removal and effluent with <1 μm TSS, suitable for reuse; it needs 0.3–0.6 kWh/m³ of aeration and a membrane swap every 5–7 years. AOPs use hydroxyl radicals (oxidation potential 2.8V) to mineralize IPA to CO₂ and water in 30–60 minutes, but bicarbonate scavenging forces operation at pH 3–4.
EOx oxidizes IPA directly at the electrodes, cutting COD by >85% and pushing the flash point above 201°F so the stream can go to sewer. It runs at neutral pH, though electrodes passivate and need replacement every 2–3 years. For influent above 50,000 mg/L COD, a DAF + EOx train is a common fit; for reuse-quality water, an MBR paired with RO hits 98% recovery. Most plants we size for pharmaceutical APIs run an MBR core with EOx polishing when the sewer flash-point limit is the binding constraint.
| Technology | Mechanism | IPA Degradation Efficiency | Effluent Quality | Key Limitations | Typical Footprint | Energy Use (kWh/m³) | Expected Lifespan |
|---|---|---|---|---|---|---|---|
| MBR (Membrane Bioreactor) | Biological degradation followed by membrane filtration | >99% COD removal | <1 μm TSS, suitable for reuse | Aeration required, membrane fouling/replacement | 60% smaller than conventional | 0.3–0.6 | Membrane: 5–7 years |
| AOPs (Advanced Oxidation Processes) | Hydroxyl radical oxidation | 99% IPA degradation | CO₂, H₂O, low residual organics | Sensitive to scavengers (e.g., bicarbonate), pH dependent | Variable, often skid-mounted | 0.5–1.2 | Reagents, catalyst dependent |
| EOx (Electrochemical Oxidation) | Direct and indirect electrochemical oxidation | >85% COD reduction, flash point increase | Reduced COD, safe for sewer discharge | Electrode passivation/replacement | Compact, modular | 0.2–0.5 | Electrode: 2–3 years |
| DAF + EOx (Hybrid) | Flotation followed by electrochemical oxidation | High COD reduction for concentrated streams | Suitable for sewer discharge/pre-treatment | Requires chemical addition for DAF | Larger than standalone EOx | Variable | Dependent on components |
| MBR + RO (Hybrid) | Biological treatment followed by membrane filtration and reverse osmosis | Near-complete purification | High-purity water for reuse | High CAPEX, complex operation | Larger footprint | Higher due to RO | Membrane: 5–7 years (MBR), RO: 3–5 years |
Engineering Specs for IPA Wastewater Treatment Systems: 2026 Benchmarks
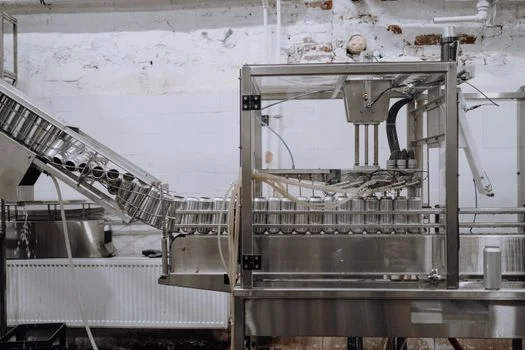
Sizing an IPA wastewater treatment system starts with the influent envelope: 1–3% IPA, which translates to 10,000–80,000 mg/L COD, TSS below 500 mg/L, and pH anywhere from 4 to 10. Effluent targets are tighter: COD under 50 mg/L for many sewer permits and TSS under 10 mg/L. Acetone sits at or below 20.7 mg/L maximum daily and 8.2 mg/L maximum monthly average per EPA 40 CFR Part 439 pretreatment standards, and flash point must clear 140°F for sewer discharge.
For direct-discharge pharmaceutical fermentation under Part 439 BPT, categorical COD limits are higher (maximum daily 1,675 mg/L and monthly average 856 mg/L), so confirm whether your permit is pretreatment or end-of-pipe. MBR units are designed at 15–25 LMH flux, 5–7 year membrane life, and 0.3–0.6 kWh/m³. AOPs need a 10–20 mg/L hydroxyl-radical dose, 30–60 minute reaction time, and 0.5–1.2 kWh/m³.
EOx cells run at 100–300 A/m² current density with 2–3 year electrode life and 0.2–0.5 kWh/m³. Chemical dosing for AOP feed pH adjustment and EOx CIP is handled by a skid-mounted automatic chemical dosing system for IPA wastewater treatment. Dosing accuracy sets both OPEX and the safety margin on this duty.
IPA Wastewater MBR System Sizing Specifications
MBR sizing for IPA duty holds to four numbers: 15–25 LMH design flux, 0.3–0.6 kWh/m³ aeration, 5–7 year membrane life, and 0.1 μm PVDF pores on the submerged modules. Plants we size for pharmaceutical API service run flux at the lower end of the band when the IPA fraction sits at the top of the 1–3% envelope. Equalization upstream smooths the batch dumps that would otherwise shock the biology.
IPA Wastewater Pretreatment 40 CFR 439 Compliance Limits
Part 439 sets the acetone frame for pretreatment compliance. According to US EPA, the rule was promulgated in 1976 and amended in 1983, 1998, and 2003, and its five subcategories run from Fermentation Products (Subpart A) through Extraction, Chemical Synthesis, and Mixing/Compounding to Research (Subpart E). Pretreatment standards cap acetone at 20.7 mg/L maximum daily and 8.2 mg/L maximum monthly average for indirect dischargers to POTWs. Confirm your subcategory before borrowing limits from another plant's permit.
IPA Wastewater Reuse MBR RO System Design
Reuse-grade recovery pairs an MBR system for IPA wastewater treatment with RO, reaching 98% water recovery with permeate COD under 10 mg/L. RO polish also strips residual salts that reuse loops would otherwise accumulate. Membrane budgets should carry both stages: 5–7 years for MBR modules and 3–5 years for RO elements.
| Parameter | Typical Influent Range | Effluent Target (Sewer Discharge) | Effluent Target (Reuse) | MBR (Typical) | AOPs (Typical) | EOx (Typical) |
|---|---|---|---|---|---|---|
| IPA Concentration | 1–3% | N/A (degraded) | N/A (degraded) | N/A (biological degradation) | N/A (oxidation) | N/A (oxidation) |
| COD | 10,000–80,000 mg/L | <50 mg/L (EPA) | <10 mg/L | <10 mg/L | <10 mg/L | <10 mg/L |
| Acetone | Variable (from IPA conversion) | <20.7 mg/L (daily avg), <8.2 mg/L (monthly avg) | <5 mg/L | <5 mg/L | <5 mg/L | <5 mg/L |
| TSS | <500 mg/L | <10 mg/L | <1 mg/L | <1 mg/L | <1 mg/L | <1 mg/L |
| Flash Point | <140°F | >140°F | N/A (high purity) | N/A (high purity) | N/A (high purity) | >201°F |
| Flux Rate | N/A | N/A | 15–25 LMH | N/A | N/A | |
| Reaction Time | N/A | N/A | N/A | 30–60 minutes | N/A | |
| Energy Use | N/A | N/A | 0.3–0.6 kWh/m³ | 0.5–1.2 kWh/m³ | 0.2–0.5 kWh/m³ | |
| Electrode Life | N/A | N/A | N/A | N/A | 2–3 years | |
| Membrane Life | N/A | N/A | 5–7 years | N/A | N/A |
How to Select the Right IPA Wastewater Treatment System
Selection works as a four-step funnel. Step one, characterize: lab testing or a pilot locks in IPA concentration, flow, COD, TSS, and pH. Step two, define the discharge route — sewer, POTW, or on-site reuse — and pin down every limit from EPA, EU directives, and the local authority.
Step three, match technology to range: MBR for COD below 50,000 mg/L when reuse is the goal, AOPs for high-COD streams chasing zero-discharge, and EOx for flash-point correction on a tighter budget. Step four, pilot the top two or three candidates through vendor trials or an independent third party to confirm performance and OPEX.
A useful side decision is whether to delegate equalization and pre-treatment to a DAF pre-treatment unit for IPA wastewater before the main reactor. For wider context on oxidation routes, the IPA Advanced Oxidation: 2026 Specs and 99% Degradation guide goes deeper on AOPs.
Lower-strength streams suit biology instead: the IPA Wastewater Treatment by Contact Oxidation: 2026 Engineering Specs piece covers biofilm reactors for those feeds. Match the reading to your COD band before shortlisting vendors.
| Influent COD Range | Discharge Scenario | Recommended Technology | Key Considerations |
|---|---|---|---|
| 10,000–50,000 mg/L | Sewer Discharge | EOx | Cost-effective, raises flash point, neutral pH operation |
| 10,000–50,000 mg/L | Reuse | MBR | High COD removal, effluent quality for reuse, smaller footprint |
| 10,000–50,000 mg/L | Zero Discharge | MBR + RO | Highest effluent quality for reuse, complex operation |
| >50,000 mg/L | Sewer Discharge | DAF + EOx (Hybrid) | Pre-treatment for high COD, efficient flash point adjustment |
| >50,000 mg/L | Reuse | AOPs (potentially with pre-treatment) | Effective degradation, requires careful scavenger management |
| >50,000 mg/L | Zero Discharge | AOPs or MBR + RO (depending on specific contaminant profile) | AOPs for complete degradation, MBR+RO for highest purity |
Cost Breakdown: CAPEX, OPEX, and ROI for IPA Wastewater Treatment Systems
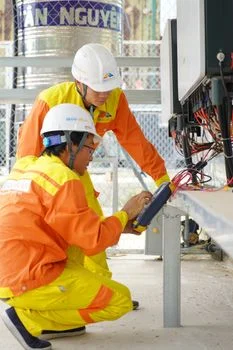
CAPEX scales with capacity and finish: MBR $500K–$2M for 10–1,000 m³/day, AOPs $300K–$1.5M, and EOx $200K–$1M as the lower entry point. OPEX per cubic metre runs $0.20–$0.50 for MBR, $0.30–$0.80 for AOPs, and $0.10–$0.30 for EOx — membrane swaps, reagent and energy, and electrode replacement, respectively.
ROI is driven by three numbers: avoided incineration at $0.50–$1.50 per gallon, water reuse at $0.50–$2.00/m³, and avoided daily compliance fines. One electronics manufacturer reported $1.2M in annual savings after switching from off-site incineration to on-site EOx — a useful benchmark when sizing payback for a 50–200 m³/day stream.
Ready to scope your own numbers? Request a free quote for a sized CAPEX/OPEX package based on your influent profile.
| Technology | Typical CAPEX Range | Typical OPEX Range ($/m³) | Primary ROI Drivers |
|---|---|---|---|
| MBR | $500K – $2M (10–1,000 m³/day) | $0.20 – $0.50 | Water reuse savings, reduced hauling costs (if applicable) |
| AOPs | $300K – $1.5M | $0.30 – $0.80 | Avoided incineration, compliance assurance |
| EOx | $200K – $1M | $0.10 – $0.30 | Avoided incineration, flash point adjustment for sewer discharge, water reuse |
| DAF + EOx (Hybrid) | Variable (higher than standalone EOx) | Variable (dependent on DAF chemicals and EOx energy) | Effective treatment of high-COD streams, avoided incineration |
| MBR + RO (Hybrid) | Higher CAPEX than standalone MBR | Higher OPEX than standalone MBR (due to RO energy and maintenance) | Maximizing water reuse, significant cost savings from reduced freshwater intake |
Common Problems and Troubleshooting for IPA Wastewater Treatment Systems
Most field issues trace to three root causes: membrane fouling, radical scavenging, and electrode passivation. In MBRs, biofouling and mineral scaling drop permeate flux. Control them with optimized backwash, scheduled CIP using NaOH or citric acid, and upstream DAF to strip TSS.
In AOPs, bicarbonate and carbonate scavenge hydroxyl radicals — pre-acidify to pH 3–4 or strip the ions with ion exchange. In EOx, organic and inorganic deposits passivate the anode. Schedule polarity reversal and periodic dilute H₂SO₄ CIP, and plan electrode replacement every 2–3 years.
Acetone spikes signal incomplete IPA conversion, so track IPA-to-acetone ratios with GC-MS and adjust AOP pH or EOx current density to suppress side reactions. For rinse-water streams that mix with the IPA waste, see the guidance on hybrid systems for rinse wastewater treatment.
Frequently Asked Questions
What is the best IPA wastewater treatment system for a pharmaceutical plant with 50 m³/day flow and 20,000 mg/L COD?
An MBR system is the right fit at 50 m³/day and 20,000 mg/L COD when on-site reuse is the goal, because it produces reuse-quality effluent with <1 μm TSS. If the binding requirement is safe sewer discharge, an EOx system costs less and raises the flash point above 201°F, meeting the >140°F sewer limit without downstream polishing. Pilot both when reuse and sewer are both live options.
How much does it cost to treat 1,000 gallons of IPA wastewater with AOPs?
Treating 1,000 gallons (about 3.785 m³) of IPA wastewater with AOPs typically costs $1.13 to $3.02, based on $0.30–$0.80/m³ OPEX. The actual figure moves with influent COD and local energy tariffs. A 70,000 mg/L stream sits at the upper end of that range, while a 15,000 mg/L stream lands closer to the lower end.
Can MBR systems handle IPA peaks in wastewater?
MBR systems can absorb IPA peaks when an equalization tank sits upstream of the bioreactor. The EQ tank buffers flow and load spikes, preventing shock loading on the biology. Peaks above roughly twice the average flow or concentration usually need a dedicated pre-treatment step such as DAF or AOP polishing.
What are the EPA limits for acetone in wastewater?
Under EPA 40 CFR Part 439 (Pharmaceutical Manufacturing Point Source Category) pretreatment standards, acetone is limited to 20.7 mg/L as a maximum daily and 8.2 mg/L as a maximum monthly average. Local POTW limits can be tighter than the federal numbers. Confirm both before sizing equalization or polishing capacity.
What IPA wastewater COD removal MBR performance should we expect?
Expect over 99% COD removal from an MBR on IPA wastewater at 10,000–50,000 mg/L influent, with effluent under 10 mg/L and TSS below 1 mg/L. Sizing holds at 15–25 LMH flux with 0.3–0.6 kWh/m³ aeration. Membrane replacement lands every 5–7 years when fouling control stays disciplined.
What does IPA wastewater electrochemical oxidation cost to run?
IPA wastewater electrochemical oxidation costs $0.10–$0.30 per cubic meter in OPEX, the lowest band of the three technologies, with CAPEX from $200K–$1M. Electrode replacement every 2–3 years is the main recurring line. Sites switching from incineration at $0.50–$1.50 per gallon usually recover CAPEX quickly on 50–200 m³/day streams.
How do I prevent membrane fouling in an MBR treating IPA wastewater?
Prevent membrane fouling in an MBR with a three-layer defense: robust pre-treatment (typically DAF) to strip particulates, automated backwashing every 10–15 minutes, and periodic clean-in-place with about 0.5% NaOCl every 3–6 months. The DAF pre-treatment for MBR systems page lists the standard models we ship for this duty. Keep scour air verified against the datasheet before startup.