LED wastewater treatment systems use 260–280 nm UVC LEDs to deliver about 50 mJ/cm² fluence for typical 4-log indicator inactivation targets under EPA UVDGM-style validation practice. Unlike mercury lamps, LED reactors start in under 100 ms, cut reported energy use by about 40% in many industrial comparisons, and remove mercury universal-waste handling from the lamp change-out cycle. Dense arrays and zero-fouling hydraulics now support food, pharma, and municipal secondary-effluent duties where UVT and TSS swing with production.
LED Wastewater Treatment Specs Engineers Check First
Industrial UV-C LED disinfection typically targets 260–280 nm peak emission, 40–120 mJ/cm² delivered fluence by validated bioassay, 316L or PVDF wetted parts for pH 2–12, and L70 life above 15,000 hours. Instant on/off lets the reactor track pump cycles. Fouling control and online UV intensity sensors keep the validated dose when UVT drifts.
Mercury lamp disposal mistakes still create RCRA exposure. Spent mercury UV lamps are universal waste under 40 CFR Part 273 (EPA). Facilities often budget civil-penalty risk up to $37,500 per day when lamps are mismanaged as ordinary trash. That liability alone pushes many plants toward solid-state UV-C LED trains.
Low-pressure and medium-pressure mercury lamps need 5–10 minutes to reach full UVC output. Plants with slug discharges either leave lamps on 24/7 or add bypass diversion. LED UV systems synchronize with flow sensors, so untreated water is less likely to slip past during start/stop events. Most plants we size for batch food lines run LEDs at the lower power setpoints overnight and ramp only with production.
Mercury lamps convert only about 30–40% of input power to useful UVC, with the rest rejected as heat into the water (DOE 2023 data cited in industry reviews). That heat speeds mineral scale on quartz sleeves. LED packages that narrow emission to germicidal bands and modulate drive current have shown about 40% lower energy use in utility innovation trials. Municipal secondary-effluent packages in the BIO-310 class (~1,000 UVC LEDs) have been used to illustrate roughly 22% lower OPEX versus legacy mercury trains under comparable duty.
UV-C LED Engineering Specs: Wavelength, Fluence, and Reactor Design
DNA/RNA absorption for many bacteria peaks near 265 nm, inside the 260–280 nm band of modern UVC LED arrays. Mercury LP lamps emit a fixed 254 nm line. LEDs can be selected closer to the action spectrum of E. coli or other challenge organisms, then validated as a reactor, not as a bare diode.
Fluence still depends on target log-reduction and wastewater UV transmittance (UVT). Earlier trade guidance often used ~50 mJ/cm² for 4-log E. coli and up to 120 mJ/cm² for hardier protozoa. EPA’s UV Disinfection Guidance Manual (UVDGM, November 2006)—still the LT2ESWTR reference—sets Cryptosporidium and Giardia 4-log doses at 22 mJ/cm² and virus 4-log at 186 mJ/cm² (EPA, 2006). Industrial wastewater permits may still specify 40–120 mJ/cm² RED by bioassay; engineers should map the permit language to the validated dose, not to a brochure wattage.
According to MacIsaac et al. (2024), a full-scale 280 nm UV LED reactor at Halifax Water’s Eastern Passage plant delivered 28–148 mJ/cm² at 545–817 m³/d and averaged >3-log total-coliform reduction at 545 m³/d. High-density arrays reduce dark zones in the flow path. Wetted materials are typically 316L stainless steel or PVDF for corrosive industrial effluent at pH 2–12. Integrated aeration or mechanical wipers help hold sleeve transmittance near the 95%+ level assumed in many validation envelopes. These detailed UV-LED engineering specs keep the delivered dose when UVT swings. Where a chemical residual is also required for reuse, plants often pair UV with chlorine dioxide disinfection systems downstream of clarification.
| Parameter | Standard Specification | Industrial Requirement |
|---|---|---|
| Peak Wavelength | 265 nm (±5 nm) | Optimal DNA/RNA Absorption |
| Fluence (UV Dose) | 40–120 mJ/cm² | 4-log Pathogen Inactivation |
| Reactor Material | 316L Stainless Steel / PVDF | Corrosion Resistance (pH 2–12) |
| LED Lifespan (L70) | >15,000 Hours | 5–7 Years Operational Life |
| Transmittance (UVT) | >95% (Maintained) | Required for EPA Validation |
LED UV vs Mercury Lamps: Head-to-Head Comparison for Industrial Wastewater
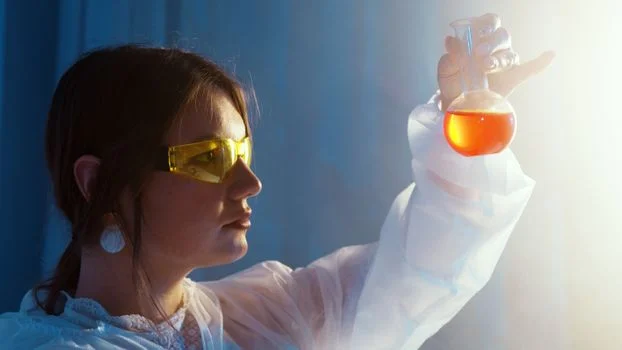
LED UV systems are routinely specified for wastewater with Total Suspended Solids (TSS) up to 50 mg/L when hydraulics and cleaning are designed for solids. Linear mercury lamp channels often lose performance above about 20 mg/L TSS because particles cast long shadows along the lamp axis. Compare the two on stability, energy, footprint, and maintenance before freezing a skid layout.
Do LED reactors beat mercury for low-energy reuse?
LED reactors usually beat mercury on energy for intermittent or decentralized reuse when flow tracks production and lamps would otherwise idle hot. Reported specific energy often falls near 0.05–0.1 kWh/m³ for LED trains versus about 0.15–0.25 kWh/m³ for mercury systems under similar industrial duties. That ~40% cut comes from drive efficiency and the absence of ballast losses. Physical footprint is typically about 30% smaller because LEDs need less lamp-pull clearance and less cooling volume, which helps containerized reuse skids.
Mercury lamps are commonly replaced every 8,000–12,000 hours (about 1–2 years), with output falling as they age. UVC LEDs are now rated 15,000–20,000 hours to L70. End-of-life is a gradual lumen drop, not glass breakage with mercury spill risk. Hazardous-waste fees of $50–$100 per lamp still appear on many mercury change-out invoices under regional EPA-aligned rules.
| Feature | UVC LED System | Mercury Vapor System |
|---|---|---|
| Warm-up Time | Instant (<100ms) | 5–10 Minutes |
| Hazardous Materials | None (Solid State) | Mercury (Toxic Waste) |
| Energy Efficiency | High (0.05 kWh/m³) | Low (0.20 kWh/m³) |
| Maintenance Interval | 15,000+ Hours | 8,000 Hours |
| Footprint | Compact (30% Smaller) | Large (Requires Clearances) |
| TSS Tolerance | Up to 50 mg/L | Up to 20 mg/L |
Compliance Mapping: EPA, EU, and WHO Standards for UV Disinfection
EPA UVDGM (2006) still frames how UV reactors earn pathogen credit: validation testing must prove dose delivery under the plant’s flow, UVT, and sensor uncertainty, then apply validation factors. LED systems are accepted when bioassay shows equivalent dose delivery to the validated mercury baseline for the same challenge organism. Calling a 2024 “UVDGM rewrite” is incorrect; the 2006 manual remains the cited federal guidance for LT2ESWTR UV credit.
In Europe, the EU Urban Waste Water Directive 91/271/EEC drives disinfection for sensitive-area discharges. Many tender specs still ask for a minimum fluence near 50 mJ/cm² with validated monitoring. WHO Guidelines for Drinking-water Quality treat UV as a preferred barrier for Giardia and Cryptosporidium, which resist free chlorine. LED trains in the 260–280 nm band can meet those efficacy benchmarks when the reactor is validated for the matrix.
Food plants must keep contact surfaces and pathogen controls aligned with FDA 21 CFR Part 110 (and successor preventive-controls rules). Pharma purified-water and WFI utilities reference USP <1231>. Third-party marks such as NSF/ANSI 55 Class A matter when the UV unit is sold into potable or high-purity service. For a deeper look at industrial cost and permit language, see 2026 cost and compliance updates.
Does UV remove arsenic from industrial wastewater?
UV disinfection does not remove arsenic; sulfide precipitation or other metals processes are required for that pollutant. UV inactivates microbes by damaging nucleic acids. Dissolved arsenic species pass the reactor unchanged. If the permit lists arsenic, size a chemical precipitation or adsorption step first, then use UV only for the microbial barrier on the clarified stream.
Zero-Fouling Reactor Designs: How LEDs Hold Dose in High-TSS Wastewater
Mineral scale and biofilm can cut UV transmittance by up to 50% within 90 days of continuous industrial service if sleeves are left unclean. Fouling is still the leading cause of under-dosing. Compact LED emitters let designers place sources where turbulence or wipers keep the optical path clear.
Integrated aeration, including micro-bubble schemes used on PearlAqua Kilo-class reactors, creates local scrubbing that limits iron and organics on quartz. Many plants hold 95%+ sleeve transmittance without daily chemical CIP. Food plants with sticky fats often add mechanical wipers on a 24–48 hour cycle. PVDF internals and hydrophobic quartz coatings lower surface energy so calcium and magnesium scales bond more slowly. Real-time transmittance or intensity sensors should raise LED drive or trigger cleaning before the validated dose collapses. Upstream DAF pretreatment for UV systems lowers organics and TSS, which stretches cleaning intervals on high-load lines.
Cost-Benefit Analysis: LED UV vs Mercury Lamps for Industrial Plants
Industrial LED UV packages often carry 20–30% higher CAPEX than mercury peers and recover that premium in about 36–60 months through energy, lamp, and disposal savings. For a plant at 200 m³/h, LED CAPEX might land near $150,000–$200,000 versus about $120,000 for mercury. Total cost of ownership usually flips after year two when mercury change-outs and ballast losses accumulate.
OPEX drivers are electricity, module replacement, and labor. High-flow sites commonly report $15,000–$40,000 per year lower energy spend after the switch. Mercury handling protocols add labor that LEDs avoid. Disposal alone can add $5,000–$20,000 per year on large mercury fleets. Halifax Water case work around full-scale LED adoption has been used to show fewer unplanned maintenance events once intensity monitoring is locked to the control system.
| Cost Category (500 m³/h Plant) | Mercury Lamp System | UVC LED System |
|---|---|---|
| Initial CAPEX | $350,000 | $450,000 |
| Annual Energy Cost | $62,000 | $37,000 |
| Annual Lamp/LED Replacement | $28,000 | $8,000 (Amortized) |
| Hazardous Waste Fees | $12,000 | $0 |
| Total 5-Year TCO | $860,000 | $675,000 |
How to Select an LED UV System: Checklist for Plant Engineers
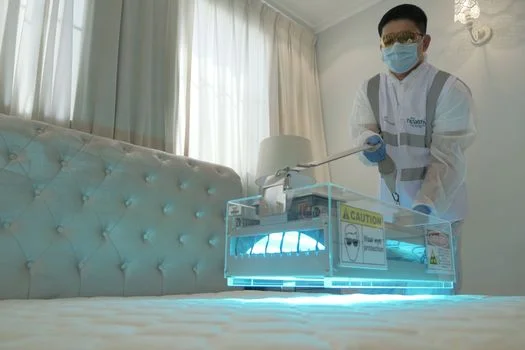
Selecting a UV train means matching effluent UVT and peak flow to reactor power density so the validated dose never drops below the permit RED. Use this checklist before issuing a purchase order.
- Step 1: Define Influent Parameters: Measure peak flow, TSS, and UVT. Set the target organism and log-reduction, then convert that to a fluence window (often 50–120 mJ/cm² for industrial bacterial permits).
- Step 2: Evaluate Reactor Geometry: Flat-plate LED arrays suit high-clarity water. High-TSS industrial streams need cylindrical chambers with proven cleaning so particles cannot shadow the path.
- Step 3: Verify Regulatory Compliance: Demand EPA UVDGM-style or EU 91/271/EEC-aligned bioassay data. Reject theoretical CFD-only dose claims for compliance-critical outfalls.
- Step 4: Conduct a TCO Analysis: Run the cost table above with your utility tariff and labor rates to size the payback window.
- Step 5: Assess Integration Options: Decide whether UV sits alone or with compact LED UV systems for healthcare packages or MBR systems with integrated UV disinfection for reuse.
Underestimating fouling is the most common miss. Specify real-time UV intensity monitoring and automatic cleaning; manual wipe schedules drift, and permits do not forgive a dark sleeve.
Who This Is For / Who Should Look Elsewhere / Next Step
This page is for plant engineers and EPC buyers comparing UV-C LED and mercury disinfection on industrial or municipal secondary effluent. Look elsewhere if the primary pollutant is dissolved metals such as arsenic, or if the stream needs a long-lasting chemical residual without a separate oxidant. When you have UVT, peak flow, and the permit organism in hand, request a reactor sizing and quote so the dose model can be checked against your matrix.
Frequently Asked Questions
What is the typical lifespan of a UVC LED in wastewater applications?
Most industrial UVC LEDs are rated for 15,000 to 20,000 hours to L70. In continuous industrial service that often equals about 5–7 years before output falls below 70% of initial intensity. Actual calendar life shortens if the reactor runs at high drive current in hot ambient conditions without adequate heat sinking.
Can LED UV systems handle high turbidity or TSS?
Modern LED reactors with zero-fouling hydraulics are commonly applied up to about 50 mg/L TSS when cleaning and intensity monitoring are active. Above that solids load, add filtration or DAF so particles cannot shield microbes. Always confirm the validated UVT window, not only the TSS number on the datasheet.
How do I calculate ROI when switching from mercury to LED?
Divide the LED CAPEX premium by annual OPEX savings from energy, lamp replacements, and hazardous-waste fees. Most industrial plants see payback in 3–5 years when lamps would otherwise idle or when disposal fees are material. Use your real tariff and change-out labor hours rather than generic brochure savings.
Do LED UV systems produce ozone?
No. UVC LEDs in the 260–280 nm disinfection band do not generate ozone. Ozone formation needs wavelengths below about 240 nm, which standard germicidal LED packages do not emit. That keeps off-gas controls simpler than for some vacuum-UV or amalgam lamp designs.
Is EPA UVDGM from 2024 still the right reference?
No. The governing EPA UV Disinfection Guidance Manual for LT2ESWTR credit remains the November 2006 edition. Use that manual’s validation framework and Table 1.4 pathogen doses, then overlay your industrial permit’s RED and bioassay requirements. Marketing claims of a 2024 UVDGM rewrite are not supported by the current EPA document set.