A 2027 PV wastewater treatment system integrates solar photovoltaic arrays (1–5 MW for 1–10 MGD plants) with hybrid treatment trains (DAF-RO-MBR) to achieve 99% reuse compliance and 30–60% energy cost reduction. Key specs: 50–500 kWh/day energy storage, 85–95% TSS removal via DAF, and <50 mg/L COD effluent via MBR—meeting EPA 40 CFR Part 433 and EU Directive 91/271/EEC. CAPEX ranges from $200K (50 m³/day) to $10M (5,000 m³/day), with payback periods of 4–8 years depending on solar irradiance and local energy costs.
How PV Wastewater Treatment Systems Work: Energy Flow to Effluent Quality
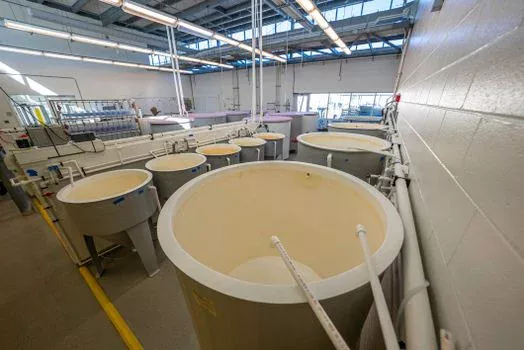
The architecture of a modern photovoltaic (PV) wastewater treatment system functions as a biological-mechanical organism where energy generation is inextricably linked to hydraulic throughput. To visualize this interplay, engineers often model the system using a three-layer energy flow: the solar array acts as the heart, generating the raw electrical pulse; the battery energy storage system (BESS) serves as the lungs, regulating the "breath" of power to ensure 24/7 stability; and the hybrid treatment train (DAF-RO-MBR) functions as the kidneys, filtering contaminants based on available energy-density profiles.
Energy demand varies significantly across the treatment stages, requiring a sophisticated PLC-controlled chemical dosing for pH adjustment and flocculation in PV wastewater systems to optimize power consumption during peak and off-peak solar hours. According to EPA 2024 benchmarks, the energy intensity of these stages follows a strict hierarchy. Dissolved Air Flotation (DAF) requires 0.3–0.5 kWh/m³, primarily for air saturation and skimming. Membrane Bioreactors (MBR) demand 0.8–1.2 kWh/m³ for aeration and permeate suction, while Reverse Osmosis (RO) remains the most intensive at 1.5–2.5 kWh/m³ due to high-pressure pump requirements.
Grid independence is a critical design metric for remote industrial sites or facilities seeking carbon neutrality. Achieving 90% autonomy typically requires 3–5 days of battery storage at a 50% depth of discharge (DoD) to account for seasonal irradiance fluctuations (per Sonoma Water case study). When these energy inputs are balanced, the system yields high-tier effluent quality: Total Suspended Solids (TSS) <5 mg/L via DAF, Chemical Oxygen Demand (COD) <50 mg/L via MBR, and Total Dissolved Solids (TDS) <100 mg/L via RO (per Zhongsheng field data, 2025).
Solar Array Sizing for Wastewater Plants: kW per MGD and Irradiance Adjustments
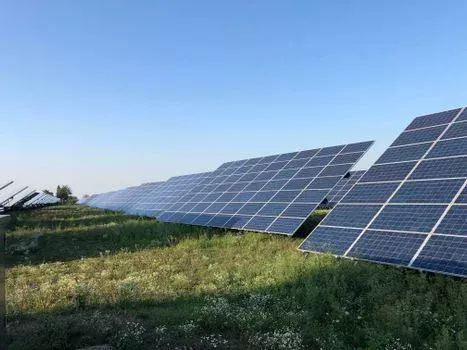
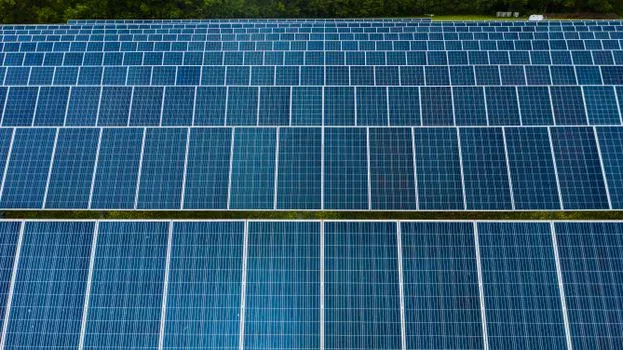
Sizing a solar PV array for a wastewater facility requires balancing the footprint of the treatment plant with the energy density of the treatment process. A standard benchmark for modern facilities is the installation of a 1 MW solar array for every 1–2 MGD (Million Gallons per Day) of treatment capacity. However, this ratio is highly sensitive to local solar irradiance. For instance, a facility in Arizona may require 20% fewer panels than a similarly sized plant in Northern Germany to achieve the same energy offset due to higher peak sun hours (PSH).
The selection of panel technology directly impacts the required land area. Monocrystalline silicon panels, offering 20–22% efficiency, are the industry standard for industrial wastewater applications despite a higher cost basis of $0.70–$1.20/W. In contrast, thin-film panels (10–13% efficiency) are occasionally used in large-scale municipal projects where land is abundant, costing $0.50–$0.80/W. The choice between fixed-tilt and single-axis tracking systems also influences ROI; while tracking systems increase energy yield by 15–25%, they add approximately 30% to the initial CAPEX and introduce mechanical maintenance requirements that must be factored into the 20-year lifecycle cost.
To calculate the required kW capacity for a specific site, engineers utilize the following formula: Required kW = (Daily Energy Demand in kWh) / (Peak Sun Hours × 0.75 Derate Factor). The 0.75 derate factor accounts for inverter inefficiencies, soiling of panels in industrial environments, and temperature-related losses.
| Plant Capacity (MGD) | Avg. Daily Demand (kWh) | Required Solar Array (kW) | Land Area Required (Acres) |
|---|---|---|---|
| 0.5 MGD | 1,200 – 1,800 | 350 – 500 | 1.5 – 2.0 |
| 1.0 MGD | 2,500 – 3,500 | 750 – 1,000 | 3.0 – 4.5 |
| 5.0 MGD | 12,000 – 18,000 | 3,500 – 5,000 | 15.0 – 22.0 |
| 10.0 MGD | 25,000 – 35,000 | 7,500 – 10,000 | 30.0 – 45.0 |
Hybrid Treatment Trains: DAF vs. RO vs. MBR for PV-Powered Systems
Selecting the appropriate hybrid configuration is essential for maximizing the value of solar integration. A 2027 hybrid DAF-RO-MBR specs and cost models for PV wastewater systems show that the integration of these three technologies allows for tiered treatment that can be throttled based on available solar power. For example, during low-sun periods, the system may prioritize DAF and MBR to maintain compliance while scaling back the energy-intensive RO process.
The ZSQ series DAF system for high-efficiency TSS removal in PV wastewater plants serves as the primary pretreatment stage, removing 92–97% of TSS and significantly reducing the organic load on downstream membranes. This is followed by an Integrated MBR system for near-reuse-quality effluent in solar-powered plants, which utilizes a 60% smaller footprint than conventional activated sludge (CAS) systems. The MBR stage is critical for achieving COD levels <50 mg/L, making the water suitable for RO feed or direct non-potable reuse. Finally, Reverse Osmosis (RO) is employed for high-purity requirements, such as boiler feed or semiconductor rinse water, removing up to 99% of dissolved salts.
| Technology | Energy Demand (kWh/m³) | TSS Removal (%) | COD Removal (%) | CAPEX ($/m³/day) |
|---|---|---|---|---|
| DAF (ZSQ Series) | 0.3 – 0.5 | 92 – 97% | 70 – 85% | $50 – $150 |
| MBR (Integrated) | 0.8 – 1.2 | 99.9% | 95 – 99% | $300 – $800 |
| RO (High Pressure) | 1.5 – 2.5 | 99% + | 90 – 95% | $200 – $500 |
Maintenance cycles for these hybrid systems are dictated by membrane health. RO membranes typically require replacement every 3–5 years, while MBR membranes require weekly chemical "clean-in-place" (CIP) cycles to prevent biofouling. DAF systems are more robust, requiring only monthly skimmer inspections and periodic sludge removal, making them the most "solar-friendly" component in terms of uptime and simplicity.
Energy Storage and Grid Independence: Batteries, Hydrogen, and Microgrids
Continuous 24/7 operation of a wastewater plant using intermittent solar power necessitates a robust energy storage strategy. Lithium-ion batteries currently dominate the market due to their 90% round-trip efficiency and 10–15 year lifespan. However, for large-scale municipal projects where long-duration storage is required, flow batteries are emerging as a viable alternative, offering 20+ year lifespans and 80% efficiency without the degradation issues associated with deep cycling.
Storage sizing is typically calculated at 2–5 kWh per cubic meter of daily treated wastewater. To achieve 90% grid autonomy, a system must be capable of sustaining operations for 3–5 days without significant solar input. If 100% autonomy is required—often the case for off-grid industrial sites—storage capacity must increase to 7–10 days, often supplemented by a green hydrogen backup or a diesel generator for emergency redundancy. This microgrid approach adds 10–20% to the initial CAPEX but ensures 99.9% uptime, protecting the biological health of the MBR during extended cloudy periods.
Hydrogen storage is a developing frontier in PV wastewater treatment. Excess solar energy during peak hours is used to electrolyze treated effluent into hydrogen gas, which is stored and later converted back to electricity via fuel cells. While the round-trip efficiency is currently lower (approx. 50%) than batteries, the ability to store energy seasonally provides a significant advantage for facilities in extreme latitudes.
CAPEX and OPEX Breakdown: $200K to $10M for PV Wastewater Systems
Investment in a PV-powered wastewater system is characterized by higher upfront CAPEX compared to conventional grid-tied systems, offset by drastically lower long-term OPEX. A typical CAPEX breakdown allocates 30–40% to the solar array, 15–25% to battery storage, 30–40% to the treatment train (DAF-RO-MBR), and 10–15% to civil works and integration. For industrial facility managers, understanding these ranges is vital for budget justification.
OPEX savings are the primary driver for ROI. Energy typically accounts for 20–30% of a standard plant's operating cost; in a PV-integrated system, this can be reduced by 60% or more. Other OPEX factors include labor (15–20%), chemical consumables (10–15%), and membrane replacement (5–10%). According to OPCB compliance and CAPEX benchmarks for industrial PV wastewater projects, payback periods range from 4–6 years for industrial plants with high energy tariffs to 6–8 years for municipal plants with subsidized utility rates.
| Plant Size (m³/day) | Estimated CAPEX Range | Annual OPEX Savings | Payback Period (Years) |
|---|---|---|---|
| 50 m³ (Small Industrial) | $200,000 – $500,000 | $35,000 – $60,000 | 4 – 6 |
| 500 m³ (Mid-Size Factory) | $1.2M – $2.5M | $180,000 – $350,000 | 5 – 7 |
| 5,000 m³ (Municipal/Large Industrial) | $5.0M – $10.0M | $800,000 – $1.5M | 6 – 8 |
Beyond direct energy savings, ROI is bolstered by carbon credits and water reuse revenue. Solar PV systems reduce Scope 2 emissions, while the high-quality effluent produced by MBR-RO trains facilitates water reuse, which can be valued at $0.50–$2.00/m³ depending on local water scarcity and municipal pricing.
Compliance and Permitting: EPA, EU, and Local Standards for PV Wastewater Systems
Compliance for PV wastewater systems must address both the environmental impact of the discharge and the land-use regulations for the solar infrastructure. In the United States, effluent must meet EPA standards under 40 CFR Part 433 for metal finishing or Part 419 for petroleum refining. Typical limits include TSS <30 mg/L and COD <125 mg/L, though many PV-MBR systems easily exceed these, delivering TSS <5 mg/L. Similarly, the EU’s Urban Wastewater Treatment Directive (91/271/EEC) and the Industrial Emissions Directive (2010/75/EU) set strict benchmarks for BOD (<25 mg/L) and COD (<125 mg/L).
Permitting for the solar component often involves local zoning boards and may require glare studies, especially if the facility is located near airports or residential areas. From a discharge perspective, facilities must secure National Pollutant Discharge Elimination System (NPDES) permits in the U.S. or comply with the Water Framework Directive (WFD) in the EU. A significant advantage of PV-integrated systems is their eligibility for carbon credits. By offsetting grid power, these plants reduce the facility's carbon footprint, allowing for the generation of tradable credits currently valued between $20 and $50 per ton of CO₂.
Permitting also extends to biosolids management (EPA Part 503). Because solar-powered plants often utilize advanced aerobic digestion or solar sludge drying beds, the resulting biosolids are frequently classified as "Class A," allowing for easier land application and reducing disposal costs by 40–50% compared to traditional landfilling.
Frequently Asked Questions
What is the payback period for a PV wastewater treatment system?The typical payback period ranges from 4 to 8 years. Industrial facilities with high electricity costs and high-strength waste (requiring more energy) usually see faster ROI (4–6 years), while municipal projects with lower energy rates and larger civil engineering costs tend toward the 6–8 year range.
Can PV wastewater systems operate entirely off-grid?Yes, PV wastewater systems can operate 100% off-grid, provided they are designed with 7–10 days of battery storage or a hydrogen backup system. Most engineers recommend a "grid-hybrid" approach where the grid serves as a secondary backup to reduce the initial CAPEX of massive battery banks.
What are the maintenance requirements for PV wastewater systems?Maintenance is divided between the energy and treatment components. Solar panels require annual cleaning (more frequent in dusty environments), while the treatment train requires weekly chemical cleaning for MBR membranes, monthly skimmer maintenance for DAF units, and annual sensor calibration for the PLC dosing systems.
How does PV wastewater treatment compare to conventional systems?PV-integrated systems offer 30–60% lower energy costs and a 60% smaller physical footprint when using MBR technology. However, they require a 20–40% higher initial CAPEX due to the cost of the solar arrays and energy storage systems.
What are the effluent quality standards for PV wastewater systems?Modern PV-MBR-RO systems consistently produce high-quality effluent with TSS <5 mg/L, COD <50 mg/L, and BOD <10 mg/L. This exceeds most global regulatory requirements and makes the water suitable for industrial process reuse or high-grade agricultural irrigation.