Photovoltaic wastewater treatment equipment pairs DAF pretreatment, RO and MBR stages to cut fluorine from 50–300 mg/L to below 10 mg/L and ammonia-nitrogen from 200–800 mg/L to below 15 mg/L. CAPEX runs $200K–$10M by scale, with energy use of 0.3–0.5 kWh/m³.
Which Photovoltaic Wastewater Treatment Equipment Fits a PV Plant in 2027?
A hybrid DAF-RO-MBR train is the reference configuration: DAF strips TSS and FOG at 92–97% removal, RO rejects fluorine to below 1 mg/L, and MBR polishes ammonia-nitrogen below 15 mg/L. The full train reuses 99% of process water and consumes 0.3–0.5 kWh/m³.
That performance level matters because PV effluent is hard on membranes and hard on permits at the same time. Silicon wafer etching with hydrofluoric acid drives fluorine to 50–300 mg/L, and cleaning and doping push ammonia-nitrogen to 200–800 mg/L. Generic municipal-style plants fail on both fronts, which is why the recurring compliance-test failures at PV plants almost always trace back to undersized pretreatment.
Hybrid DAF-RO-MBR systems meet the applicable limits — EPA 40 CFR Part 469 and EU Directive 91/271/EEC among them — at 92–97% COD removal and 99% water reuse. Energy consumption stands at an efficient 0.3–0.5 kWh/m³, roughly half the 0.6–1.2 kWh/m³ of conventional wastewater treatment plants. CAPEX ranges from $200K for small-scale systems up to $10M for large PV facilities.
Why PV Manufacturing Wastewater Requires Specialized Treatment
Photovoltaic manufacturing processes generate wastewater profiles that generic treatment plants cannot effectively manage. Silicon wafer etching, a core process, uses hydrofluoric acid and leaves fluorine concentrations typically between 50–300 mg/L in the effluent. Cleaning and doping stages involve ammonia-containing solutions and lift ammonia-nitrogen levels to 200–800 mg/L. Beyond those key contaminants, PV wastewater also carries suspended solids (TSS 100–500 mg/L) and fats, oils and greases (FOGs 50–200 mg/L) from organic solvents used in cleaning steps.
The regulatory thresholds are strict and layered. EPA's 40 CFR Part 469 guideline covers semiconductor-sector discharges with a federal BAT fluoride limit of 32.0 mg/L maximum for any one day and 17.4 mg/L as a 30-day average, plus a total toxic organics cap of 1.37 mg/L (40 CFR § 469.15). The <10 mg/L fluorine and <15 mg/L ammonia figures quoted in most PV projects come from stricter water-quality-based state permits and POTW pretreatment conditions stacked on top of that federal floor.
Ammonia-nitrogen is not a federally regulated parameter under Part 469, whose listed wastewater pollutants are fluoride, arsenic and organic compounds (US EPA). Ammonia limits reach PV plants through state permits and local discharge consents instead.
In Europe, EU Directive 91/271/EEC imposes strict controls on nitrogen and phosphorus, so effective ammonia-nitrogen treatment is unavoidable for photovoltaic plants. In China, GB 31573-2015 also mandates comparable fluoride, ammonia-nitrogen and TSS limits for industrial discharges (see table above). Failure to meet these standards brings substantial fines, operational shutdowns and reputational damage — a 2026 industry case study records a PV facility hit with a multi-million dollar penalty and temporary closure for non-compliance. Compared with textile dyeing effluent (high COD, color) or general chemical effluent (diverse toxics), PV wastewater is distinct on three counts: extreme pH variability, corrosive fluoride chemistry, and FOG-plus-silica fouling that attacks advanced membranes.
| Contaminant | Typical PV Influent (mg/L) | EPA 40 CFR Part 469 Limit (mg/L) | EU Directive 91/271/EEC (mg/L) | China GB 31573-2015 (mg/L) |
|---|---|---|---|---|
| Fluorine | 50–300 | <10 | N/A (indirect) | <10 |
| Ammonia-Nitrogen | 200–800 | <15 | <15 (for N total) | <15 |
| Suspended Solids (TSS) | 100–500 | <30 | <35 | <30 |
| COD | 200–1000 | <100 | <125 | <80 |
| FOGs | 50–200 | <10 | <20 | <10 |
How Does Fluorine Ammonia Removal from Photovoltaic Wastewater Work?

Fluorine and ammonia removal from photovoltaic wastewater proceeds through a fixed sequence: DAF first, equalization second, reverse osmosis third, biological polishing last. The process flow opens with a high-efficiency Dissolved Air Flotation (DAF) System for FOG and TSS removal in PV wastewater, followed by an equalization tank, then an advanced reverse osmosis (RO) unit, and finally a membrane bioreactor (MBR) for biological polishing before disinfection. That multi-stage approach is what removes such dissimilar pollutants from a single stream.
In the initial stage, the DAF unit saturates wastewater with air under pressure, then releases it at atmospheric pressure. The released air forms micro-bubbles that attach to suspended solids and FOGs, floating them to the surface as a scum layer for mechanical skimming. DAF achieves 92–97% removal of FOGs and TSS at this point, protecting every membrane downstream from fouling.
Following DAF and equalization, the water reaches an ultra-pure RO system for fluorine removal and water reuse in PV manufacturing. RO membranes, with a pore size of approximately 0.0001 μm, reject dissolved salts, heavy metals and residual fluorine down to <1 mg/L and ammonia to <5 mg/L, producing permeate of reuse quality. Chemical dosing — calcium chloride for fluorine precipitation, for example — is often integrated ahead of the RO unit to sharpen removal efficiency.
Finally, a submerged PVDF MBR system for ammonia-nitrogen removal in PV plants treats the RO reject stream or a portion of the DAF effluent, focusing on residual organics and ammonia-nitrogen. MBRs combine biological treatment with membrane filtration (pore size typically 0.1 μm), achieving COD <50 mg/L plus nitrification/denitrification that reduces ammonia-nitrogen to <15 mg/L, at hydraulic retention times of 4–8 hours. Sodium hydroxide handles pH adjustment throughout the process.
The integrated train is energy-efficient as a side effect of its design: hybrid systems consume 0.3–0.5 kWh/m³ against 0.6–1.2 kWh/m³ for conventional systems. Layouts ordered as an mbr followed by reverse osmosis plant sequence follow the same reuse logic at Indian industrial sites, where the CAPEX/OPEX split differs by technology choice.
DAF-RO vs. DAF-MBR vs. RO-MBR: Matching the Train to the Effluent
Configuration selection among DAF-RO, DAF-MBR and RO-MBR follows the primary contaminant and the reuse target. A DAF-RO system is ideal for PV plants fighting high fluorine with relatively low ammonia-nitrogen, where high-purity water reuse is the goal and secondary treatment suffices for nitrogen. A DAF-MBR configuration excels on high ammonia-nitrogen loads with moderate fluorine, leveraging MBR biology for nutrient removal while DAF handles suspended solids and FOGs. A full RO-MBR system, often preceded by basic clarification or equalization, suits balanced high-fluorine-plus-high-ammonia loads where maximum water reuse is the objective.
A 100 m³/h PV plant in Jiangsu ran exactly this logic: its DAF-RO system cut influent fluorine from 250 mg/L to below 8 mg/L for process-water reuse (2026 case study). The trade-offs are financial as much as technical. RO-MBR systems carry roughly 20% higher CAPEX from stacking two advanced membrane stages, yet they can run 30% lower OPEX over time through reduced chemical usage and higher water recovery rates.
RO sizing practice also transfers between sectors. The benchmarks compiled for Rinse Wastewater Treatment by Reverse Osmosis: 2026 Engineering Specs, Cost Models apply closely to PV rinse stages, since both streams carry low organics alongside high dissolved solids.
| Parameter | DAF-RO System | DAF-MBR System | RO-MBR System |
|---|---|---|---|
| Best for PV Profile | High Fluorine, Low Ammonia, High Water Reuse | High Ammonia, Moderate Fluorine, Biological Treatment Focus | Balanced High Fluorine & Ammonia, Max Water Reuse |
| Typical Influent Limits | Fluorine: 50-300 mg/L Ammonia: <100 mg/L |
Ammonia: 200-800 mg/L Fluorine: <50 mg/L |
Fluorine: 50-300 mg/L Ammonia: 200-800 mg/L |
| Typical Effluent Quality | Fluorine: <1 mg/L Ammonia: <10 mg/L TSS: <1 mg/L |
Ammonia: <5 mg/L COD: <30 mg/L TSS: <1 mg/L |
Fluorine: <1 mg/L Ammonia: <5 mg/L COD: <20 mg/L |
| Energy Use (kWh/m³) | 0.25–0.45 | 0.3–0.5 | 0.4–0.6 |
| CAPEX (Relative) | Medium | Medium-Low | High (+20% vs DAF-RO) |
| OPEX (Relative) | Medium | Low | Medium-Low (-30% vs DAF-RO) |
| Maintenance Needs | RO membrane cleaning, DAF sludge handling | MBR membrane cleaning, sludge handling, biological monitoring | RO & MBR membrane cleaning, complex sludge handling |
What Is Zero-Fouling Membrane Design for Silicon Wafer Wastewater?
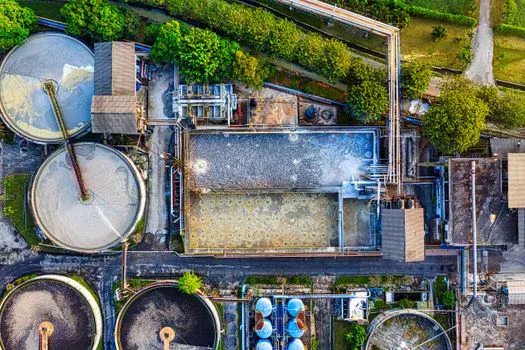
Zero-fouling membrane design for silicon wafer wastewater starts by naming the three foulants: FOGs from organic solvents, silica from etching processes, and accelerated biological growth fed by high ammonia-nitrogen concentrations. Fouling is the primary operational pain point in advanced PV treatment, showing up as reduced flux, increased energy consumption and ever-shorter cleaning cycles. Every design decision that follows exists to slow those three mechanisms and protect OPEX.
Effective pre-treatment is the first line of defense. Integrating a high-efficiency DAF system for FOG and TSS removal in PV wastewater removes over 95% of FOGs and suspended solids before water reaches sensitive membrane units. That sharply cuts the organic loading and particulate matter able to adhere to membrane surfaces. Plants we audit that skip or undersize this stage buy their savings back in cleaning chemicals within a year.
At the RO stage, zero-fouling SiC membranes for PV wastewater RO systems change the maintenance math. Silicon carbide membranes exhibit stronger chemical resistance and hydrophilicity than traditional polymeric membranes, making them highly resistant to scaling and organic fouling. The practical result is a 30% longer lifespan and cleaning intervals of 6–12 months versus 1–3 months for polymeric membranes (2027 industry data).
Automated Clean-In-Place (CIP) systems then keep those intervals honest. For silica removal — silica forms tenacious scales — periodic CIP cycles using acidic solutions like citric acid are essential. Regular backwashing and air scouring in the MBR prevent biological growth and particulate accumulation, maintaining consistent membrane performance and reducing unplanned downtime between cleanings.
2027 Cost Models: CAPEX From $200K to $10M and the OPEX Behind It
CAPEX for PV wastewater treatment systems varies significantly with plant capacity and system complexity, and the bands are predictable enough to budget against. A small-scale PV plant requiring 5 m³/h typically needs $200K–$500K. Medium-scale facilities at 50 m³/h land between $1.5M–$3M, and large PV plants up to 200 m³/h can reach $5M–$10M. Each band includes equipment procurement, installation, civil works and permitting fees.
| System Scale | Flow Rate (m³/h) | Estimated CAPEX Range | Key CAPEX Line Items |
|---|---|---|---|
| Small-scale | 5 | $200K–$500K | DAF unit, basic RO skid, MBR tank, pumps, controls, installation |
| Medium-scale | 50 | $1.5M–$3M | Modular DAF, RO, MBR systems, equalization tanks, civil works, automation |
| Large-scale | 200 | $5M–$10M | Custom-engineered DAF, RO, MBR, advanced instrumentation, site prep, permitting |
OPEX has four drivers: energy, chemicals, membrane replacement and labor. Energy sits at 0.3–0.5 kWh/m³ for hybrid systems, a substantial improvement over conventional methods. Chemical costs — DAF coagulants, RO antiscalants and pH adjustment chemicals — typically add $0.10–$0.30/m³. Membrane replacement for RO and MBR units runs $20K–$100K per year depending on size and membrane type (SiC versus polymeric), and staffing works out near one full-time equivalent for routine monitoring of a 50 m³/h system.
Two cost rules hold across every band. Energy and membrane replacement together dominate OPEX, so a quote that trims CAPEX by cutting pretreatment capacity usually loses the saving within the first replacement membrane set. Reuse value scales with flow, which is why the 100 m³/h class shows the cleanest payback arithmetic of the three bands and the 5 m³/h class is bought mostly for compliance, not savings.
The reuse math closes the business case. A 100 m³/h industrial water reuse system can save a PV plant an estimated $800K/year in municipal water purchase and discharge costs while avoiding roughly $200K/year in potential compliance fines — payback in as little as 3 years. Regional cost bases differ: the CAPEX/OPEX benchmarks for industrial wastewater treatment plants compiled for Batam offer one second reference point, and Gulf procurement teams can line up the supplier-side numbers in Bahrain Sewage Treatment Equipment Suppliers: 2026 Engineering Specs, Cost Models when comparing GCC vendor quotes.
Step-by-Step Selection: From Lab Panel to Performance Contract
The selection sequence for a PV plant runs five steps, from lab panel to signed performance commitments, and it stays repeatable across projects. Skipping a step is where most selection failures begin.
- Step 1: Characterize the wastewater profile. Begin with comprehensive lab testing for fluorine (EPA Method 300.0), ammonia-nitrogen (EPA Method 350.1), TSS, FOGs and pH. Understanding the variability and concentrations of these parameters is foundational — every downstream sizing decision inherits its accuracy from this panel.
- Step 2: Match the system to the profile. Use the configuration comparison table above to match your wastewater profile to the most suitable hybrid system (DAF-RO, DAF-MBR or RO-MBR). Weight your primary goal honestly: high water reuse, strict fluorine removal, or robust ammonia-nitrogen treatment.
- Step 3: Evaluate vendors on evidence. Build a checklist covering compliance certifications (ISO, local environmental standards), demonstrated PV or high-tech industrial case studies with measured influent/effluent data, membrane warranties and expected lifespan, local service contracts and technical support, integration with existing plant infrastructure, and commitment to zero-fouling design principles such as SiC membrane options.
- Step 4: Conduct pilot testing. For medium to large-scale projects, rent a 1 m³/h pilot skid for 3 months. Real-world validation on your actual wastewater de-risks performance, energy consumption and chemical dosing assumptions before full-scale investment.
- Step 5: Negotiate contracts with performance commitments. Insist on explicit contracted performance terms covering effluent quality (e.g., "<10 mg/L fluorine, <15 mg/L ammonia"), system uptime (e.g., "95% uptime excluding scheduled maintenance") and specific energy consumption benchmarks. Define penalties for non-compliance and a robust service level agreement in writing.
Next Step: Put Numbers on Your Train
Photovoltaic wastewater treatment equipment selection moves fastest from a real dataset: a five-parameter lab panel (fluorine, ammonia-nitrogen, TSS, FOGs, pH) plus a diurnal flow profile. Send both through the inquiry page, and the engineering team will return a train recommendation, an energy estimate and a CAPEX band for your flow rate. Plants already failing compliance tests should include the exceedance history — it usually shortens the diagnosis considerably.
Frequently Asked Questions
What are the primary contaminants in photovoltaic wastewater?
Photovoltaic wastewater typically contains fluorine at 50–300 mg/L from silicon wafer etching, ammonia-nitrogen at 200–800 mg/L from cleaning and doping, suspended solids at 100–500 mg/L, and FOGs at 50–200 mg/L from organic solvents. These contaminants demand specialized treatment because of their high variability and their combined fouling attack on membranes. A five-parameter lab panel is the standard first step.
How do hybrid DAF-RO-MBR systems achieve 99% water reuse?
Hybrid systems reuse water through staged separation: DAF removes particulates and FOGs to protect downstream membranes, reverse osmosis then rejects dissolved salts, heavy metals and fluorine to produce ultra-pure process water, and the MBR biologically polishes residual organics and ammonia from the RO reject or a side stream. Each stage widens the fraction of flow that can loop back into manufacturing instead of being discharged.
What is zero-fouling design for PV wastewater membranes?
Zero-fouling design prevents membrane clogging through three moves: robust DAF pre-treatment removing FOGs and TSS, silicon carbide (SiC) membranes on the RO stage for their scaling and organic-fouling resistance with 6–12 month cleaning intervals, and automated Clean-In-Place systems using targeted chemistry such as citric acid for silica. Regular MBR backwashing and air scouring complete the strategy.
What is the typical CAPEX and OPEX for a PV wastewater treatment plant?
CAPEX runs from $200K for a 5 m³/h system to $10M for a 200 m³/h plant, covering equipment, installation, civil works and permitting. OPEX is driven by energy at 0.3–0.5 kWh/m³, chemicals at $0.10–$0.30/m³, membrane replacement at $20K–$100K per year, and roughly one FTE for a 50 m³/h system. Reuse savings of about $800K/year put payback near 3 years for a 100 m³/h plant.
What regulations govern photovoltaic wastewater discharge?
US discharges fall under EPA 40 CFR Part 469, whose federal BAT limits for the semiconductor subcategory are 32.0 mg/L fluoride maximum daily and 17.4 mg/L as a 30-day average, with ammonia regulated through state permits rather than the federal rule (40 CFR § 469.15). EU Directive 91/271/EEC controls nitrogen and phosphorus for European plants. China's GB 31573-2015 sets comparable fluoride and ammonia-nitrogen discharge limits for industrial wastewater.