Advanced packaging wastewater treatment systems achieve 92–98% COD removal and 95–99% TSS reduction for corrugated, flexible, and rigid packaging plants. Typical design targets align with common permit caps of ≤250 mg/L BOD and ≤30 mg/L TSS. CAPEX usually spans $2M–$15M at 50–500 m³/h with DAF, MBR, or SBR trains, while OPEX runs about $0.80–$2.50/m³ treated. Sludge yield averages 0.3–0.5 kg dry solids per kg COD removed, so dewatering capacity drives disposal cost.
Why Packaging Wastewater Treatment Fails Compliance Tests (And How to Fix It)
Packaging wastewater fails compliance when starch, fiber, and adhesive spikes overwhelm screening and biology. Corrugated COD often runs 1500 to 4000 mg/L with TSS of 500 to 1200 mg/L. Equalization, 1-3 mm fine screening, and starch-targeted coagulation before DAF cut shock loads. Most plants we size stabilize once primary solids capture is fixed.
Corrugated cardboard effluent commonly exceeds municipal discharge limits by 300% to 1,000% based on 2023 EPA datasets cited in plant audits. High organic load washes out conventional activated sludge during adhesive tank cleanouts. A single starch wash-down can spike COD by 5,000 mg/L in under an hour and destabilize aeration within one shift.
Flexible packaging lines add surfactants and solvent-based adhesives that emulsify solids. Traditional clarifiers then lose settling velocity, aeration tanks foam, and fine TSS carries into final effluent. Without chemical pretreatment sized for those emulsifiers, plants often miss a 30 mg/L TSS direct-discharge limit.
A 2024 technical audit of a Midwest corrugated plant traced 40% of compliance failures to coarse primary screening. Bar screens with 6 mm gaps passed fibers into biological reactors, fouled aerators, and raised organic loading above design. Upgrading to rotary mechanical screens with 1–3 mm gaps cut downstream organic load by 35% and stopped excursion events.
Stable control starts with automated equalization and pH neutralization so biology sees a steady feed. Chemical dosing for packaging effluent—coagulants and flocculants matched to starch and adhesives—can cut COD by up to 50% before secondary treatment. Plants that keep reactive jar-test dosing as the only control still chase foam after every product changeover.
Advanced Packaging Treatment Technologies: Removal Rates and Process Parameters
Membrane Bioreactor (MBR) trains reach 95–98% COD removal and about 99% TSS reduction with 0.1–0.4 μm membranes that retain biomass. MLSS typically sits at 8,000–12,000 mg/L, which supports an HRT of 8–12 hours at a high sludge age needed for adhesive polymers. Using MBR systems for flexible packaging effluent keeps stubborn surfactants in contact long enough to oxidize.
Corrugated plants with high TSS and FOG still rely on Dissolved Air Flotation as primary or secondary clarification. Modern DAF units form 30–50 μm micro-bubbles that lift floc to a skimmer. A DAF system for packaging wastewater usually needs only 20–40 minutes HRT, which helps tight footprints. TSS removal exceeds 90% when starch chemistry is tuned to the mill’s adhesive grade.
Sequencing Batch Reactors suit plants with wide flow swings because equalization, aeration, and settling share one tank. Packaging SBR cycles often run 4–6 hours, with total HRT of 12–24 hours based on influent COD. Nitrogen removal of 70–80% is common, but SBR footprints exceed MBR and may miss reuse TSS targets of ≤10 mg/L without tertiary polish.
| Parameter | Influent (Typical) | DAF Effluent | SBR Effluent | MBR Effluent |
|---|---|---|---|---|
| COD (mg/L) | 2,500 – 4,500 | 800 – 1,200 | 150 – 250 | 50 – 100 |
| TSS (mg/L) | 800 – 1,500 | 50 – 100 | 20 – 40 | < 5 |
| BOD (mg/L) | 600 – 1,200 | 300 – 500 | 20 – 30 | < 10 |
| HRT (Hours) | N/A | 0.5 – 0.75 | 12 – 24 | 8 – 12 |
| Sludge Yield* | N/A | 0.1 – 0.2 | 0.4 – 0.5 | 0.3 – 0.4 |
*kg dry solids per kg COD removed. (HydropureWater Engineering Data, 2025)
What Drives CAPEX and OPEX for Packaging Plants?
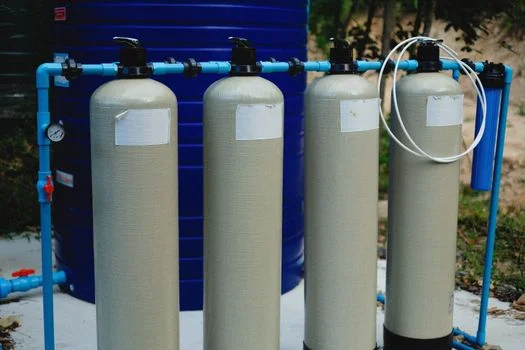
Capital cost for a 100 m³/h packaging wastewater plant ranges from about $2.5M for DAF-led layouts to $8M for MBR packages. Automation level, 304 vs 316 stainless steel for corrosive adhesive waste, and tertiary polishing for local limits set most of that spread. Civil works and installation usually add 30–50% on top of equipment price. For detailed CAPEX/OPEX benchmarks for industrial wastewater treatment, compare lifecycle cost, not only the purchase quote.
OPEX is driven by energy and chemicals. MBR energy often lands at $0.60–$0.80/m³ because air scour protects membranes. DAF energy is lower, but starch flocculation chemicals can cost $0.25–$0.45/m³. Sludge haulage adds $0.20–$0.50/m³ depending on landfill distance and cake dryness from on-site dewatering.
A 2025 Texas corrugated case replaced an aging SBR with an MBR at $5.2M CAPEX and cut total OPEX by 22%. Smart aeration trimmed energy about 15%, and higher sludge age cut sludge volume about 30% through endogenous respiration. Payback landed at 4.2 years against a five-year corporate hurdle.
| System Capacity | DAF (CAPEX) | SBR (CAPEX) | MBR (CAPEX) | Avg. OPEX ($/m³) |
|---|---|---|---|---|
| 50 m³/h | $1.2M – $1.8M | $1.8M – $2.5M | $2.5M – $3.5M | $1.10 – $2.50 |
| 200 m³/h | $4.0M – $5.5M | $5.0M – $7.5M | $7.0M – $10.0M | $0.90 – $1.80 |
| 500 m³/h | $8.0M – $12.0M | $10.0M – $14.0M | $12.0M – $18.0M | $0.80 – $1.50 |
Does Packaging Wastewater Equipment Count as CAPEX?
Packaging wastewater equipment counts as CAPEX when the asset is capitalized plant infrastructure—tanks, DAF units, MBR skids, filter presses, and related civil works. OPEX covers power, polymer, membrane replacement, labor, and sludge tipping after commissioning. Finance teams should split the quote into equipment plus installation CAPEX versus unit treatment cost in $/m³ so board reviews stay comparable across DAF, SBR, and MBR options.
Sludge Management for Packaging Plants: Dewatering Technologies and Cost Optimization
Industrial packaging wastewater yields 0.3–0.5 kg dry solids per kg COD removed across chemical and biological stages. Corrugated sludge volume is often 2–4 times flexible-packaging sludge because fiber and starch report to primary clarification. Each 1% gain in cake dryness can save thousands of dollars per year in haul fees. Plate-and-frame filter presses for packaging sludge remain the practical route to high cake solids.
Plate-and-frame presses typically reach 30–40% cake solids under high mechanical pressure. Decanter centrifuges often stop at 18–25% solids on biological sludge. For 1,000 kg dry solids per day, raising cake solids from 20% to 35% cuts wet mass from 5,000 kg to about 2,850 kg—a 43% drop in trucked weight and tipping fees.
Polymer dose controls cloth blinding and cake wetness. Corrugated sludge often needs 3–5 kg polymer per ton dry solids; flexible packaging sludge with fines and surfactants may need 5–8 kg/ton. An automatic chemical dosing system meters polymer to turbidity or feed solids. HydropureWater field data from 2025 shows automated dosing can cut polymer use by up to 15% versus manual batch mixing.
| Technology | Cake Solids % | CAPEX (Relative) | OPEX (Energy/Labor) | Maintenance Req. |
|---|---|---|---|---|
| Filter Press | 30% – 45% | Moderate | Moderate | Low (Cloth cleaning) |
| Centrifuge | 18% – 25% | High | High | High (Rotating parts) |
| Belt Press | 15% – 22% | Low | Moderate | Moderate (Belt wear) |
Regulatory Compliance for Packaging Wastewater: EPA, EU, and Local Standards
Earlier guidance in many packaging permits used ≤30 mg/L BOD and ≤30 mg/L TSS as practical concentration caps. According to the US EPA Pulp, Paper and Paperboard Effluent Guidelines (40 CFR Part 430), categorical limits are set as kg pollutant per 1,000 kg of product by subcategory, then written into NPDES or pretreatment permits. Local POTWs also surcharge high-COD loads, often starting near 500 mg/L, while direct dischargers may face COD near 100 mg/L.Sensitive-area rules push total nitrogen toward ≤10–15 mg/L by agglomeration size, which is why many EU packaging mills select MBR plus nutrient control.China’s GB 8978 pathway for corrugated plants still cites COD ≤100 mg/L in recent project specifications, which effectively requires advanced biology on new lines.
Compliance programs need continuous logging, not monthly grab samples alone. TOC analyzers that report every 5–10 minutes let operators divert off-spec water to a holding tank before the outfall. MBR membranes add a physical TSS barrier during biological upsets, which is why compliance-heavy regions favor them when reuse or tight permits leave little room for clarifier carryover.
How to Select the Right Treatment System for Your Packaging Plant
Selecting a treatment train starts with influent characterization, available footprint, and reuse quality. If the plant must recycle 70–80% of process water for starch make-up or boiler feed, MBR followed by reverse osmosis is the workable path. If the only goal is to avoid POTW surcharges, a DAF-led primary train may be enough. A DAF clarifier selection guide for packaging plants helps size that first solids cut.
Corrugated mills with high fiber should lock in fine screening and primary DAF before biology. Flexible packaging plants with emulsified adhesives and inks need MBR or SBR residence time for high COD. Mixed plants often run DAF for solids then SBR for organic polishing when CAPEX must stay mid-range. For advanced packaging lines with frequent adhesive changeovers, size equalization on the worst wash-down hour, not average daily flow.
Selection checklist for packaging plant managers:
- Documented COD removal on your measured influent, not a generic brochure rate
- Design MLSS and HRT for the biological reactor at peak starch wash-down
- Membrane pore size verification (MBR) or DAF bubble size band in the proposal
- Expected sludge disposal cost in $/m³ treated water at your landfill tip fee
- Chemical dosing linked to turbidity or TOC, not timer-only pumps
- Specific energy use in kWh/m³ at design flow and at 60% turn-down
- Equalization volume for pH and flow, plus modular expansion space
| Application | Recommended Tech | Primary Benefit | Key Constraint |
|---|---|---|---|
| Corrugated (High TSS) | DAF + SBR | Excellent fiber recovery | Larger footprint |
| Flexible (High COD/Polymer) | MBR | Ultra-clean effluent | Higher CAPEX |
| Water Reuse (Zero Discharge) | MBR + RO | 90% water recovery | Brine management |
| Small Plant (< 50 m³/h) | Integrated DAF | Low complexity | Lower COD removal |
Who This Is For / Next Step
This guide is for packaging plant engineers, EPC contractors, and procurement managers comparing DAF, SBR, and MBR trains against real influent and permit limits. Look elsewhere if you only need sanitary sewage treatment or arsenic-specific precipitation chemistry. To size a train against your COD, TSS, and sludge haul cost, request a packaging wastewater treatment quote with recent laboratory data and peak wash-down flow.
Frequently Asked Questions
What COD removal can corrugated packaging wastewater reach?
DAF plus MBR trains typically reach 95% to 98% COD removal on corrugated wastewater. Much of the COD is bound to starch and fiber, so primary DAF can remove 40–60% of the load before biology. That split keeps final COD under common discharge targets near 250 mg/L when equalization limits wash-down spikes.
How does MBR compare with SBR for packaging effluent?
MBR usually delivers TSS below 5 mg/L and needs about 40–50% less footprint than SBR. CAPEX and scour energy are higher, so lifecycle cost must be checked at your tariff. SBR handles variable flow with simpler mechanicals, yet often needs tertiary filtration to match MBR discharge quality.
What sludge disposal cost should a 100 m³/h plant expect?
Sludge disposal commonly costs $0.20–$0.50 per cubic meter of treated water. At 100 m³/h and continuous operation, that is roughly $175,000 to $438,000 per year before cake optimization. A plate-and-frame filter press for packaging sludge at about 35% cake solids can cut haul cost by up to 60% versus thin cake.
Can packaging wastewater be reused in production?
Yes. MBR effluent is often suitable for starch preparation, floor wash-down, and cooling towers when conductivity stays in range. Printing or laminating reuse usually needs reverse osmosis to strip dissolved salts and residual color. Closed-loop designs must also budget brine handling from the RO concentrate.
What CAPEX range fits a 50–500 m³/h packaging plant?
Installed CAPEX commonly spans about $2M–$15M across 50–500 m³/h, with DAF at the low end and MBR at the high end. A 100 m³/h example often falls near $2.5M–$8M before civil mark-up. Always add 30–50% for installation and confirm OPEX in $/m³ at your energy and polymer prices.