Fenton oxidation for developer wastewater removes 92–97% of COD on well-characterized streams at an operating cost of $2.10–$4.30 per m³ for classic systems, while electro-Fenton cuts chemicals to reach $1.00–$2.70 per m³. Best operation sits at pH 2.5–3.5 with Fe²⁺ at 50–200 mg/L.
Why Developer Wastewater Resists Conventional Treatment (and How the Fenton Process Breaks the Barrier)
Developer wastewater carries 500–5,000 mg/L recalcitrant COD, TSS of 200–1,500 mg/L, and pH swings from 3 to 11. Fenton oxidation breaks these loads with hydroxyl radicals at pH 2.5–3.5, Fe²⁺ at 50–200 mg/L, and H₂O₂:Fe²⁺ molar ratios of 5:1–10:1. Electro-Fenton reaches comparable removal at lower chemical cost.
Developer wastewater, prevalent in electronics, pharmaceutical, and chemical manufacturing, is characterized by recalcitrant chemical oxygen demand (COD) of 500–5,000 mg/L and total suspended solids (TSS) between 200–1,500 mg/L. The pH of these streams can fluctuate widely, from 3 to 11, depending on the specific industrial process. Semiconductor manufacturing may involve highly acidic photoresist stripping solutions, while pharmaceutical synthesis can generate alkaline streams. These complex matrices often contain persistent organic pollutants such as photoresists, solvents, dyes, and complex organic compounds, along with heavy metals like copper and nickel, which are intrinsically difficult to treat.
Specific agents in developer formulations add to the difficulty. Quaternary ammonium compounds (Quats) used in photolithography are designed for stability and efficacy in their intended application, which translates directly into resistance against biological degradation pathways. High ionic strength and surfactants in some developer wastewaters interfere with conventional treatment by reducing oxygen transfer rates in biological systems or causing foaming issues. Solvent-bearing streams of this type respond well to fenton oxidation, as documented in our photoresist-wastewater case data.
Conventional biological treatment frequently fails against developer wastewater due to the inherent toxicity of these compounds. High concentrations of organic solvents, chelating agents, and heavy metals inhibit microbial activity, leading to inefficient COD removal, sludge bulking, and process instability. Biological systems are designed for biodegradable organic loads, not the recalcitrant, often mutagenic or carcinogenic, substances found in developer effluents. Aromatic structures in many dyes or complex pharmaceutical intermediates are notoriously difficult for microorganisms to metabolize.
The operational window for biological treatment is narrow, and even slight variations in influent characteristics can trigger system upset. Robust pretreatment steps must therefore handle fluctuations in pollutant loads and types before biology ever sees the flow. The economics reinforce the point: frequent biological failures drive up chemical addition, energy consumption, and non-compliance penalty exposure, which is what pushes plants toward alternative or complementary strategies. Most plants we audit with developer streams size biology only after an oxidation step has stabilized the load.
Fenton oxidation offers that robust pretreatment by generating highly reactive hydroxyl radicals (·OH). These powerful, non-selective oxidants break complex organic pollutants into simpler, biodegradable intermediates such as carboxylic acids and aldehydes, or fully mineralize them into carbon dioxide (CO₂) and water (H₂O). Pretreatment significantly reduces the toxic load, making the wastewater amenable to downstream biological processes and stringent discharge limits. For composite industrial wastewater, Fenton oxidation has demonstrated 92–97% COD removal efficiency on well-characterized streams (2024 benchmarks).
The mechanism attacks carbon-carbon bonds and functional groups within organic molecules, effectively deconstructing them. The process is particularly effective against aromatic rings, double bonds, and other stable chemical structures that resist biological breakdown. Intermediates are typically more polar, less toxic, and more biodegradable, preparing the flow for efficient polishing by activated sludge or Membrane Bioreactors (MBRs). Efficiency improves further when reaction conditions — pH, temperature, and the ratio of reactants — are optimized to maximize hydroxyl radical generation and pollutant degradation.
Fenton Process Mechanics: Hydroxyl Radicals, Reaction Kinetics, and Process Parameters
Fenton oxidation initiates with hydroxyl radicals generated through catalytic decomposition of hydrogen peroxide (H₂O₂) by ferrous ions (Fe²⁺). The primary reaction is defined as Fe²⁺ + H₂O₂ → Fe³⁺ + ·OH + OH⁻. Hydroxyl radicals sit among the most powerful oxidizing agents, with an oxidation potential of +2.80 V and reaction rate constants with organic pollutants of 10⁹–10¹² M⁻¹s⁻¹ (per leading AOP reviews). That reactivity makes ·OH exceptionally effective against the broad spectrum of organic contaminants in developer wastewater.
Radicals attack virtually all organic compounds through hydrogen abstraction, electron transfer, or addition reactions, depending on the pollutant and the radical's interaction with it. Aromatic compounds are often attacked by addition across double bonds, leading to ring opening and subsequent degradation. The high reactivity initiates a cascade of reactions that break molecules down faster than any biological pathway can. This is why even short Fenton contact times cut COD sharply on developer streams.
The Fenton process runs in two distinct stages. The first stage is rapid oxidation of organics by hydroxyl radicals, completed within seconds to minutes; complex molecules are cleaved and COD drops significantly. The second stage is slower coagulation and flocculation of ferric hydroxide (Fe(OH)₃) sludge as Fe³⁺ ions precipitate, lasting approximately 30–60 minutes. This stage removes suspended solids, residual organics, and heavy metals through adsorption, co-precipitation, and physical entrapment, contributing to a cleaner overall effluent. Coagulation efficiency depends heavily on pH, mixing intensity, and the presence of coagulant aids.
Optimal performance requires precise control of several key parameters, summarized in the table below. The optimal pH range is critically important, typically maintained between 2.5–3.5. Below pH 2.5, hydrogen peroxide stability decreases, leading to premature decomposition into water and oxygen and wasting valuable oxidant. Above pH 3.5, Fe²⁺ rapidly precipitates as ferric hydroxide, reducing catalytic activity and forming a passivating layer on existing solids.
Ferrous ion dosage commonly ranges from 50–200 mg/L, depending on the initial COD load and the specific contaminants. Excess Fe²⁺ leaves residual iron in the treated water, which may be undesirable, while insufficient amounts limit radical generation. The molar ratio of H₂O₂ to Fe²⁺ is crucial, typically falling between 5:1–10:1 to ensure sufficient radical generation without excessive peroxide consumption. Higher ratios lead to scavenging of hydroxyl radicals by excess H₂O₂, forming hydroperoxyl radicals (·OOH), which are less reactive.
Reaction times generally vary from 30 to 120 minutes, adjusted to wastewater characteristics and the target COD removal. Longer times bring diminishing returns and higher operating cost. Temperature also plays a role: higher values accelerate reaction rates but increase H₂O₂ decomposition, so most plants hold ambient to 50°C. A notable byproduct is ferric hydroxide sludge, typically 0.3–0.5 kg per kg of COD removed (Scientific Reports, 2024), which sets the downstream dewatering duty. Sludge dewaterability and heavy metal content are important considerations for disposal and further treatment.
| Parameter | Optimal Range | Notes |
|---|---|---|
| pH | 2.5 – 3.5 | Crucial for H₂O₂ stability and Fe²⁺ catalytic activity. |
| Fe²⁺ Dosage | 50 – 200 mg/L | Dependent on initial COD; balances effectiveness with residual iron. |
| H₂O₂ Dosage | Varies (typically 1.5-3.0x theoretical demand) | Stoichiometric calculations are a starting point; empirical testing is vital. |
| H₂O₂:Fe²⁺ Molar Ratio | 5:1 – 10:1 | Optimizes radical generation and minimizes scavenging. |
| Reaction Time | 30 – 120 minutes | Determined by pollutant complexity and target removal efficiency. |
| Temperature | Ambient to 50°C | Higher temperatures increase reaction rates but also H₂O₂ decomposition. |
| Sludge Production | 0.3 – 0.5 kg/kg COD removed | Requires effective dewatering and disposal strategies. |
Electro-Fenton: A Cost-Effective and Sustainable Alternative
Electro-Fenton (EF) processes generate Fe²⁺ in situ and/or H₂O₂ electrochemically, reducing the external chemical additions that dominate classic Fenton cost. In the most common EF configuration, a cathode (often carbon-based or stainless steel) reduces dissolved oxygen to H₂O₂ in an acidic medium. Iron electrodes used as anodes corrode to supply Fe²⁺ ions catalytically; alternatively, Fe²⁺ is added externally while the electrochemical cell generates H₂O₂. The overall reaction simplifies to Fe²⁺ + H₂O₂ (generated electrochemically) → Fe³⁺ + ·OH + OH⁻.
The economics favor EF where power is affordable. Studies report operational costs as low as $2.06/m³ for EF, a 34% reduction compared to classic Fenton for similar treatment efficiency (2024 industry benchmarks). In-situ generation also gives better control over the oxidation process and can lift efficiencies. EF systems can be more compact and automated, requiring less manual chemical handling than drum-fed peroxide plants.
Electrochemical generation of Fenton's reagents offers several advantages. It significantly cuts consumption of commercially produced hydrogen peroxide, often the single largest operating expense. The iron catalyst is regenerated or supplied continuously from sacrificial electrodes, minimizing the sludge associated with iron precipitation in conventional Fenton. The process is finely tuned by adjusting current density, electrode material, flow rate, and electrolyte composition.
Electrode selection is decisive. Graphite felt, carbon nanotubes, or reticulated vitreous carbon are favored for high surface area and catalytic properties in H₂O₂ generation, while stainless steel or iron plates supply Fe²⁺. Higher current densities raise H₂O₂ and Fe²⁺ production rates but also increase energy consumption. The pH in EF systems is typically held at 2-3 to optimize radical formation and prevent iron precipitation, mirroring conventional Fenton. Wastewater circulates through the electrochemical reactor where catalytic species are generated and react with pollutants, then proceeds to subsequent treatment steps.
Pilot data on composite industrial wastewaters, including electronics manufacturing streams, showed EF statistically superior (p < 0.05) in COD reduction compared with conventional biological treatment alone, or with classic Fenton under certain conditions. EF has demonstrated COD removal exceeding 95% on challenging streams containing dyes and complex organic solvents. A companion piece covers the cost of fenton oxidation in wastewater treatment across solvent and mixed-organic effluents, with plant-level cost tables.
Integrating EF with biological treatment is particularly promising. The EF step breaks recalcitrant compounds into more biodegradable intermediates, reducing toxicity and organic load on downstream biological reactors. This synergy yields higher overall treatment efficiency, reduced sludge production from the biological stage, and improved effluent quality. Automation and remote monitoring further trim labor costs and raise operational reliability. As energy costs remain significant, energy efficiency — advanced reactor designs and operational strategies — is the key ongoing R&D focus.
Oxidation Operating Cost for Developer Wastewater: Fenton Design Specs and Cost Models
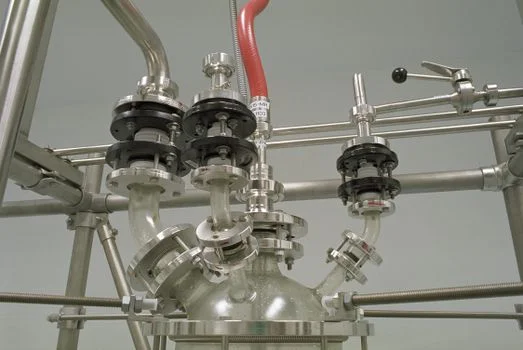
Engineering specifications for Fenton systems now emphasize modularity, automation, and enhanced process control. Take a typical developer wastewater flow of 100 m³/day with an average COD of 2,000 mg/L and TSS of 500 mg/L. The primary oxidation reactor volume follows the required reaction time — 60 minutes, for example — and flow rate, commonly producing a tank volume of 4-5 m³. Construction uses corrosion-resistant materials such as fiberglass-reinforced plastic (FRP) or stainless steel (SS316L) to withstand acidic conditions and oxidants. Agitation is critical for mass transfer and uniform reactant distribution, so high-efficiency mixers or spargers are standard.
Chemical storage sizing comes straight from the dose math. Hydrogen peroxide (typically 30-50% concentration) and ferrous sulfate or chloride solution tanks are sized on daily consumption, with safety features for hazardous-chemical handling. For a 2,000 mg/L COD load with a theoretical H₂O₂:COD ratio of 1.5:1 and an Fe²⁺:H₂O₂ molar ratio of 1:7, demand runs about 3,000 mg/L of H₂O₂ — roughly 9 L of 30% H₂O₂ per m³ — plus about 150 mg/L of Fe²⁺, or 0.15 L of ferrous salt solution per m³. At 100 m³/day that means roughly 900 L of 30% H₂O₂ and 15 L of ferrous salt solution daily, requiring adequately sized storage tanks and safety bunding.
Downstream of the oxidation reactor, a coagulation and flocculation tank with 30-60 minutes residence time forms settleable flocs, followed by solid-liquid separation. Plate-and-frame filter presses are highly effective for dewatering the resulting ferric hydroxide sludge. A press handling 1-2 m³ of sludge per day, operating at 7-15 bar, is typical, and cake dryness can reach 40-60% solids — significantly reducing disposal volumes. For EF systems, reactor design incorporates electrochemical cells with sufficient electrode surface area to meet H₂O₂ and Fe²⁺ generation demand, using multiple stacked cells or flow-through designs with optimized electrode spacing.
Energy consumption for EF is a key cost factor, typically ranging from 0.5 to 3 kWh/m³ depending on removal efficiency and system design. Classic Fenton CAPEX for the 100 m³/day, 2,000 mg/L COD case runs $150,000 to $300,000, covering reactors, chemical storage, pumps, and basic instrumentation. OPEX includes chemicals (H₂O₂ and Fe²⁺), electricity for mixing and pumping, maintenance, and sludge disposal, with chemicals dominant at $1.50-$3.00 per m³. Electro-Fenton CAPEX is higher at $200,000-$400,000 due to cells and power supplies, but OPEX drops to $1.00-$2.50 per m³, driven by electricity and reduced chemical purchases. The $2.06/m³ EF figure cited earlier represents an optimized scenario with efficient energy use and high treatment volumes.
Fenton oxidation operating cost for developer wastewater therefore splits into four line items, in descending weight: chemicals, sludge disposal, amortized capital, and power. Table 1 provides the comparative outlook assuming optimized designs and economies of scale; figures are indicative and vary with project location, raw material prices, and regulatory requirements. Sludge disposal is a significant variable, influenced by heavy metal content and local landfill fees. Teams budgeting in euros should also review the fenton oxidation operating cost eur per kg cod removed industrial benchmark before fixing reagent contracts. Broader organic streams follow the same economics — our Fenton Oxidation for Organic Wastewater Treatment: 2026 Engineering Specs guide compares them directly.
Advanced process control completes the specification. Real-time monitoring of pH, ORP (oxidation-reduction potential), COD, and residual H₂O₂ lets the system dynamically adjust chemical dosing and reaction times, optimizing performance and minimizing chemical consumption. This automation keeps effluent consistently inside permit limits and reduces the need for constant operator intervention. Most skids we commission start at 60 minutes reaction for 2,000 mg/L COD, then trim dose and time from jar-test data.
| Cost Component | Classic Fenton (per m³) | Electro-Fenton (per m³) | Notes |
|---|---|---|---|
| CAPEX (Amortized) | $0.50 - $1.00 | $0.70 - $1.30 | Includes reactors, storage, controls; EF CAPEX higher due to electrochemical components. |
| Chemicals (H₂O₂, Fe²⁺) | $1.50 - $3.00 | $0.10 - $0.30 (minimal Fe²⁺ addition) | Significant savings with EF due to in-situ generation. |
| Electricity | $0.10 - $0.20 (mixing/pumping) | $0.50 - $1.50 (electrochemical process + mixing/pumping) | Higher for EF due to electrolysis; optimized designs aim for lower kWh/m³. |
| Maintenance & Labor | $0.20 - $0.40 | $0.20 - $0.40 | Assumes similar automation levels. |
| Sludge Disposal | $0.30 - $0.70 | $0.20 - $0.50 | EF may produce less sludge or sludge with different characteristics. |
| Total OPEX | $2.10 - $4.30 | $1.00 - $2.70 | EF generally offers lower OPEX. |
Compliance-Ready Blueprint for Developer Wastewater
Compliance-ready operation starts with thorough characterization of the influent, including COD, TSS, pH, volatile organic compounds (VOCs), heavy metals, and specific recalcitrant compounds. Analysis often requires advanced techniques such as GC-MS or LC-MS to select the right Fenton or Electro-Fenton configuration and predict performance. A pilot study then validates laboratory findings and fine-tunes operating parameters under realistic conditions. Piloting surfaces challenges — foaming, suppression strategies, unexpected byproducts — and optimizes dosages and reaction times; a trial might reveal, for instance, that certain solvents need extended reaction times or higher oxidant doses for complete degradation.
Robust process control and monitoring come next. Real-time sensors for pH, ORP, flow rate, and temperature integrate with automated dosing for H₂O₂ and Fe²⁺ (or electrochemical control for EF). Continuous effluent monitoring of COD, BOD (biochemical oxygen demand), and specific priority pollutants confirms discharge-permit compliance. Alarm systems and automatic shutdown protocols prevent discharge of non-compliant effluent, while regular calibration and maintenance of analytical equipment keep data trustworthy. Operator training must cover operation, maintenance, safety protocols, and upset response, including safe handling of hydrogen peroxide — a strong oxidant requiring specific storage and personal protective equipment (PPE).
Integration with downstream treatment is a critical component of the blueprint. Fenton oxidation reduces COD and breaks recalcitrant organics, but may not achieve stringent BOD limits or remove all residual suspended solids and dissolved salts. Coupling Fenton with biological treatment (activated sludge or MBR) is therefore common practice. Fenton pretreatment significantly enhances biodegradability so the biological stage runs more efficiently and stably; an MBR polishing step can deliver effluent TSS below 5 mg/L, often required for direct discharge or reuse.
Ferric hydroxide sludge must be managed responsibly — dewatered in filter presses to reduce volume, then disposed of according to local regulations. Where heavy metals are present in significant concentrations, further treatment or stabilization of the sludge may be required before disposal, so a comprehensive sludge management plan belongs in the blueprint. Where permits demand a final oxidative polish, an Ozone Generator & Water Tank Sterilization System can finish reuse-grade water without peroxide carry-over.
Long-term compliance also means staying current with evolving regulations: new discharge limits, emerging contaminants of concern, and changes in waste disposal requirements. A robust quality management system with regular audits and continuous improvement initiatives keeps the treatment system compliant and efficient over time. Emergency preparedness plans covering accidental spills and system failures complete the approach. Together these measures let facilities achieve and maintain a high level of environmental performance while systematically mitigating developer-wastewater discharge risks.
Commissioning, Monitoring, and Troubleshooting Guidance
Commission the train in a fixed order and resist the urge to shortcut it. Fill the oxidation reactor with clean water first and verify mixing, level control, and interlocks before any chemistry enters the system. Bring acid dosing online next and confirm the vessel holds the target band before ferrous salt and peroxide follow in small, logged steps. Hold each step for at least one full residence time and let stable readings gate the next increase.
Match the monitoring cadence to how settled the plant is. Early operation calls for continuous pH and ORP watch, daily calibration checks on dosing pumps, and effluent sampling every shift until results repeat. Once performance is steady, most crews settle into logged readings each shift, a weekly calibration pass, and a monthly review of chemical use against the jar-test baseline. Keep the operator log short enough that people actually complete it, because an unused log protects nobody.
When removal sags, troubleshoot in a fixed order instead of chasing the newest theory. Confirm reactor pH first, since drift outside the working band wastes peroxide and starves radical generation. Check reagent strength and pump calibration next, because aged or diluted peroxide is the most common silent failure we find on site. Then look at mixing energy and scavengers in the feed, using the operator log to spot whatever changed most recently.
The classic-versus-electro choice comes down to three site facts. Choose classic Fenton where power is expensive, capital is tight, and the stream is a straightforward retrofit at modest flow. Choose electro-Fenton where electricity is affordable, the plant values minimal chemical handling, and throughput is high enough to repay the richer skid. When the board asks for one sentence, frame it as reagent spend traded against power and capital.
Equipment Specified for Fenton Duty
The following HydropureWater products are engineered for the wastewater challenges discussed above:
- PLC-controlled chemical dosing systems for precise Fe²⁺ and H₂O₂ injection in Fenton oxidation — accurate, reliable delivery of ferrous ions and hydrogen peroxide, crucial for maintaining the optimal Fe²⁺:H₂O₂ ratio and pH in the Fenton process. Features include advanced control algorithms, multiple dosing pumps for flexibility, and integration with SCADA systems for remote monitoring and data logging.
- high-efficiency plate-and-frame filter presses for ferric hydroxide sludge dewatering — engineered to achieve high cake dryness (40-60% solids) on the ferric hydroxide sludge generated by Fenton oxidation, significantly reducing sludge volume and associated disposal costs. They are robust, easy to operate, and available in various sizes to match different sludge generation rates.
- MBR systems for hybrid Fenton-biological treatment of high-strength developer wastewater — compact and efficient polishing that combines membrane filtration with biological treatment, achieving very low levels of COD, BOD, and TSS. They are ideal for direct discharge or water reuse applications following Fenton pretreatment.
Who is this for? Electronics, pharmaceutical, and chemical plants with recalcitrant developer streams above roughly 20 m³/day that must protect a downstream biological stage or hit tight COD permits. Plants with readily biodegradable, low-toxicity loads should look at conventional biology alone and skip the reagent spend. Need a customized solution? Request a free quote with your specific flow rate and pollutant parameters, and the engineering team will return a sized reagent, reactor, and dewatering schedule for your developer stream.
Frequently Asked Questions
What is the electro-Fenton pretreatment cost for electronics wastewater?
Electro-Fenton pretreatment for electronics wastewater typically costs $1.00–$2.70 per m³ in total OPEX, with chemicals at $0.10–$0.30 and electricity at $0.50–$1.50 per m³. Optimized high-volume designs have reached $2.06/m³, about 34% below classic Fenton. CAPEX runs higher at $200,000–$400,000 for a 100 m³/day train because of cells and power supplies, so payback depends on the chemical-price spread at your site.
What drives the operating cost for developer wastewater Fenton treatment?
Chemicals dominate, at $1.50–$3.00 per m³ for H₂O₂ and ferrous salt. A 2,000 mg/L COD stream consumes about 9 L of 30% H₂O₂ and 0.15 L of ferrous solution per m³ of wastewater. Sludge disposal adds $0.30–$0.70 per m³ at 0.3–0.5 kg sludge per kg COD removed. Jar testing on your actual stream is the only reliable way to fix the dose, because scavenging wastes peroxide fast.
How much ferric sludge does Fenton treatment produce?
Fenton oxidation produces 0.3–0.5 kg of ferric hydroxide sludge per kg of COD removed (Scientific Reports, 2024). A plate-and-frame press operating at 7–15 bar dewaters it to a 40–60% solids cake, sharply cutting haul-off volume. Sludge carrying significant copper or nickel may require stabilization before disposal under local rules, so budget that line early.
Does developer wastewater still need biology after Fenton pretreatment?
Yes, under most permits. Fenton pretreatment converts recalcitrant organics into biodegradable intermediates but rarely meets final BOD and TSS limits alone. A downstream activated sludge or MBR stage stabilizes the load and can deliver effluent TSS below 5 mg/L. The hybrid train runs more stably and produces less biological sludge than biology fed raw developer streams.
Is electro-Fenton better than classic Fenton for composite streams?
EF also cuts chemical cost to $0.10–$0.30 per m³. Choose EF when power is affordable and CAPEX headroom exists; choose classic Fenton for simple, low-flow retrofits.
Further Reading
- DAF systems for post-Fenton TSS removal in developer wastewater. Dissolved Air Flotation (DAF) is an effective physical separation process that can be used after Fenton oxidation to remove the precipitated ferric hydroxide sludge and any remaining suspended solids, producing a clearer effluent and a more concentrated sludge for easier handling.
- coagulation-sedimentation for silica removal in semiconductor wastewater. While not directly related to Fenton oxidation, this article details conventional but effective physical-chemical treatment methods that can be complementary in complex industrial wastewater scenarios, particularly when dealing with inorganic suspended solids like silica.