
What Is a PAC Dosing System?
A PAC dosing system meters polyaluminum chloride into industrial or municipal wastewater for coagulation and flocculation. Typical trains report 92–97% TSS removal and 60–80% COD reduction under jar-test and plant conditions, often with about 30% less sludge than alum. Core hardware includes a 0.1–2,000 L/h metering pump, online sensors, and a PLC.
How Does the Chemical Injection Process Flow Work?
Polyaluminum chloride storage, metering, rapid mix, flocculation, and solids separation form the standard chemical injection sequence. Storage tanks are usually HDPE or FRP and hold commercial solutions at 5–15% w/v. A diaphragm or peristaltic metering pump then delivers chemical at 0.1–2,000 L/h into a static or flash mixer sized for a high initial G-value so the coagulant disperses before charge neutralization finishes.
After mixing, flocculation and sedimentation or flotation provide 20–60 minutes of retention so flocs grow to about 0.5–3 mm. Online sensors target effluent turbidity below 5 NTU and pH between 6.5 and 8.5 for many industrial discharge trains. Common dosing errors include pump calibration drift, mixer fouling, and sensor coating, each of which can push dose away from the jar-test optimum.
Figure 1: Chemical feed flow diagram showing tank, pump, mixer, clarifier, and sensor placement.
Engineering Specs and Selection Criteria for Key Components
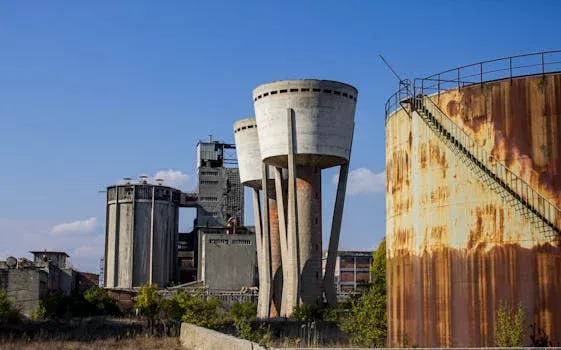
Metering pump type, wetted materials, sensor accuracy, and tank construction set the reliability envelope for polyaluminum chloride feed. Diaphragm pumps typically handle up to 10 bar at about ±1% accuracy across 0.1–2,000 L/h, while peristaltic units suit lower pressure (about 5 bar) and viscous fluids at roughly ±3% accuracy. Wetted parts in PVDF, PTFE, or 316 stainless steel resist PAC corrosion better than commodity PVC at higher concentrations.
Turbidity probes commonly span 0–1,000 NTU at ±2% accuracy and need weekly calibration; pH probes (0–14, ±0.1) often need daily checks; flow sensors in the 0.1–10 m/s range support flow-proportional feed. PLC or SCADA loops using Modbus or Profibus can raise dose when turbidity exceeds 10 NTU. For 5–10% PAC, HDPE tanks are common; for 10–15%, FRP is preferred, and a low-speed mixer helps keep concentrated solutions homogeneous.
Earlier plant specs often cited “OSHA 1910.110” and a flat 110% secondary-containment rule for chemical tanks.For hazardous-waste container storage, 40 CFR 264.175 requires containment capacity equal to 10% of the total container volume or 100% of the largest container, whichever is greater (EPA eCFR). Where flammable-liquid tank rules apply, 29 CFR 1910.106 requires diked volume not less than the largest tank. Designers should match the actual chemical hazard class and permit basis rather than copy a generic 110% label.
| Component | Type | Typical Specification | Material Compatibility | Notes |
|---|---|---|---|---|
| Metering Pump | Diaphragm | Flow: 0.1–2,000 L/h, Pressure: up to 10 bar, Accuracy: ±1% | PVDF, PTFE, 316 SS (wetted parts) | High pressure, high accuracy applications |
| Peristaltic | Flow: 0.1–2,000 L/h, Pressure: up to 5 bar, Accuracy: ±3% | Tubing: PVC, Silicone (wetted parts) | Viscous fluids, lower pressure applications | |
| Sensors | Turbidity | Range: 0–1,000 NTU, Accuracy: ±2% | N/A (probe material varies) | Weekly calibration recommended |
| pH | Range: 0–14, Accuracy: ±0.1 | Glass, Epoxy (probe material) | Daily calibration recommended | |
| Flow | Range: 0.1–10 m/s | N/A (sensor housing varies) | Essential for flow-proportional dosing | |
| Control System | PLC/SCADA | Protocols: Modbus, Profibus | N/A | Enables automation and remote monitoring |
| Chemical Storage Tank | HDPE | Concentration: 5–10% PAC | HDPE | Cost-effective for lower concentrations |
| FRP | Concentration: 10–15% PAC | FRP | Higher strength for concentrated solutions |
For automated chemical dosing solutions, explore our PLC-controlled PAC dosing skids with integrated sensors. Detailed pump curves, skid layouts, and control I/O lists are summarized in the companion PAC dosing specifications and design parameters guide.
Smart vs. Manual PAC Dosing: Performance Data and Cost Comparison
Smart sensor feedback typically reaches 95–98% TSS removal, while a manual PAC dosing system often stays in the 85–92% band on the same wastewater (HydropureWater field data). COD reduction is commonly 60–80% with smart control versus 50–70% with manual setpoints. Sludge Volume Index often falls to 50–80 mL/g with optimized dose, compared with 80–120 mL/g when operators overdose or underdose by hand.
In plants above 50,000 m³/day, smart control can cut PAC use by 15–25%. Example economics: at 50,000 m³/day, a 5 mg/L dose cut at $0.80/kg PAC saves about $73,000 per year. Manual CAPEX is typically $15,000–$50,000; smart CAPEX is $50,000–$150,000 including sensors and PLC. Manual OPEX often runs $0.05–$0.10/m³; smart OPEX often falls to $0.03–$0.07/m³. Large plants (>50,000 m³/day) often see ROI in 12–24 months; mid-size plants (10,000–50,000 m³/day) may need 36–60 months.
| Metric | Manual Dosing | Smart Dosing | Improvement (%) |
|---|---|---|---|
| TSS Removal | 85–92% | 95–98% | +5–13% |
| COD Reduction | 50–70% | 60–80% | +10–20% |
| SVI | 80–120 mL/g | 50–80 mL/g | -33–25% |
| PAC Consumption Savings | N/A | 15–25% (for >50,000 m³/day) | N/A |
| CAPEX | $15,000–$50,000 | $50,000–$150,000 | N/A |
| OPEX (per m³) | $0.05–$0.10 | $0.03–$0.07 | -30–40% |
| ROI (for >50,000 m³/day) | N/A | 12–24 months | N/A |
PAC vs. Alum vs. Ferric Chloride: Industrial Use Case Comparison
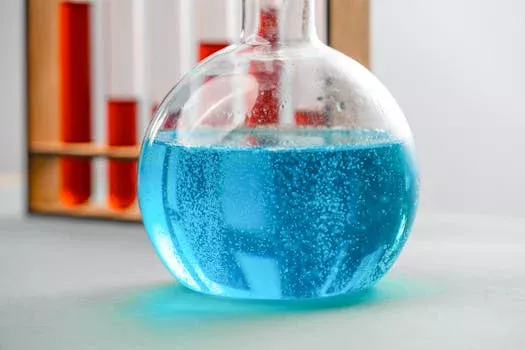
Polyaluminum chloride, alum, and ferric chloride remain the three workhorse inorganic coagulants for industrial clarification and chemical precipitation. According to the US EPA Nutrient Control Design Manual, PAC is listed with alum and ferric chloride among common metal-salt precipitants used in wastewater chemical treatment. Plant and jar-test ranges for TSS removal are typically 92–97% for PAC, 85–92% for alum, and 88–95% for ferric chloride; COD reduction is often 60–80%, 50–70%, and 55–75% respectively under comparable mixing and clarification conditions.
PAC often yields 30–50% less sludge than alum (HydropureWater analysis), with SVI around 50–80 mL/g versus 80–120 mL/g for alum and 70–100 mL/g for ferric. Effective pH windows are roughly 3–9 for PAC, 5.5–8 for alum, and 4–11 for ferric chloride. Unit chemical costs are about $0.80–$1.20/kg for PAC, $0.30–$0.50/kg for alum, and $0.40–$0.70/kg for ferric, but PAC doses are usually lower (10–50 mg/L versus 30–150 mg/L alum and 20–100 mg/L ferric). PAC suits high-turbidity surface water and difficult industrial effluent; alum fits stable, moderate-turbidity sources; ferric is often chosen when heavy-metal precipitation is also required.
| Parameter | PAC | Alum | Ferric Chloride |
|---|---|---|---|
| TSS Removal | 92–97% | 85–92% | 88–95% |
| COD Reduction | 60–80% | 50–70% | 55–75% |
| Sludge Production (vs. Alum) | 30–50% Less | Baseline | Slightly less to similar |
| SVI | 50–80 mL/g | 80–120 mL/g | 70–100 mL/g |
| Effective pH Range | 3–9 | 5.5–8 | 4–11 |
| Typical Cost ($/kg) | $0.80–$1.20 | $0.30–$0.50 | $0.40–$0.70 |
| Typical Dosage (mg/L) | 10–50 | 30–150 | 20–100 |
| Primary Use Cases | High turbidity, industrial effluent | Stable groundwater, moderate turbidity | Heavy metal removal, industrial effluent |
How to Select the Right Equipment for Polyaluminum Chloride Feed
Influent turbidity, COD, pH, peak flow, and automation level determine which PAC feed train fits a given plant. Start with influent ranges such as 50–3,000 NTU turbidity, 100–2,000 mg/L COD, and pH 3–11. Industry dose bands often fall near 20–80 mg/L for food processing, 50–150 mg/L for textiles, and 80–200 mg/L for pulp and paper, always confirmed by jar tests.
Pump capacity can be screened as maximum daily flow × target PAC dose × 1.2 safety factor, then corrected for product strength and density. Example: 10,000 m³/day at 50 mg/L with a 1.2 factor gives a 600 L/h screening capacity when the calculation assumes 1 kg/L and 100% active product; real sizing must adjust for actual concentration. Choose diaphragm pumps for higher pressure and tight accuracy, or peristaltic pumps for lower flow and viscous fluids, with PVDF or equal wetted parts.
Sensor packages should include turbidity and pH as a minimum; add flow meters for proportional control and ORP or redundant turbidity for 24/7 critical trains. Manual, semi-automatic PLC, or full SCADA smart control then follows from labor availability and influent variability. Budget CAPEX plus installation, calibration labor, seal or tubing spares, containment upgrades, and training—not only the skid price.
For advanced wastewater clarification, consider integrating your PAC dosing with DAF systems for high-efficiency floc removal.
What Clarifier Selection Criteria Follow PAC Dosing?
Overflow rate, solids loading, and sludge settleability set clarifier or DAF sizing after polyaluminum chloride coagulation. Primary and secondary circular or rectangular basins are sized on design flow and expected floc mass; lamella packs raise projected area when footprint is tight; DAF is preferred when flocs are light or oily. Match hydraulic loading to jar-test settling curves and keep sludge withdrawal matched to the lower SVI that well-dosed PAC often produces (about 50–80 mL/g).
How Does Lime Dosing Differ From PAC?
Lime dosing raises pH and precipitates hardness or metals as hydroxides, while PAC mainly destabilizes colloids through aluminum hydrolysis species. Lime systems need slurry make-down, abrasion-resistant pumps, and often larger sludge volumes; PAC systems meter a liquid metal salt at lower mass dose for turbidity and COD polishing. Plants sometimes use lime for pH control upstream and PAC for polishing coagulation, rather than treating the two chemicals as interchangeable.
Common Failures in Polyaluminum Chloride Feed Trains
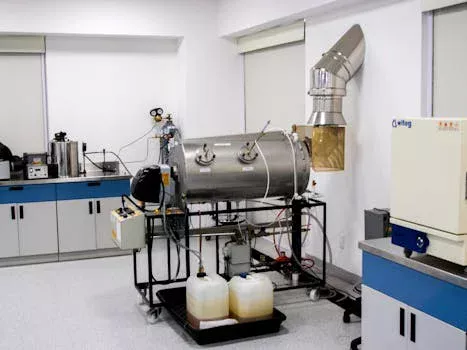
Pump clogging, over-dosing, under-dosing, sensor fouling, and incompatible materials cause most PAC feed upsets. Crystallization or debris cuts pump flow; keep tank agitation on and install a 100-micron suction strainer, then flush with clean water or dilute acid such as 0.1% HCl when lines plug. Over-dosing shows as high turbidity, excess sludge, and wasted chemical—recalibrate sensors weekly and step the dose down in 10% increments until turbidity stabilizes.
Under-dosing shows as weak flocs and low TSS removal; bleed air locks, replace worn diaphragms or tubing, and raise dose in 10% steps after calibration. Fouled sensors give false alarms—clean biofouling with about 0.5% bleach and mineral scale with about 5% citric acid, or add ultrasonic cleaning on turbidity probes. Leaks or corrosion usually mean wrong materials; upgrade wetted parts to PVDF or 316 SS when 15% PAC attacks PVC.
Who This Is For / Next Step
This guide is for plant engineers, EPC designers, and procurement teams sizing coagulation chemical feed for industrial or municipal wastewater. Look elsewhere if you need biological process design alone—for compact biological treatment packages, see the Underground Package Sewage Treatment Plant (WSZ Series). Selection checklist: confirm influent turbidity, COD, and pH bands; jar-test dose and pH; size the pump on peak flow with strength correction. Specify PVDF, PTFE, or 316 SS wetted parts; set turbidity and pH feedback; verify containment against the applicable EPA or OSHA rule; plan calibration and spare parts. Share your flow, influent data, and target effluent limits if you want a skid-level dosing proposal.
Frequently Asked Questions
What is the primary function of polyaluminum chloride feed equipment?
The primary function is to inject a controlled PAC dose into wastewater so colloids destabilize and form settleable or floatable flocs. Accurate metering keeps TSS and turbidity inside permit limits while limiting chemical waste. Storage, pump, mixer, and sensor feedback together determine whether the jar-test dose is actually delivered in the pipe.
How much TSS removal should engineers expect from PAC coagulation?
Engineers typically see 92–97% TSS removal when dose, pH, and mixing match the wastewater, with smart feedback trains often reporting 95–98%. Results depend on influent solids, alkalinity, and clarifier or DAF loading, so jar tests remain mandatory before freezing design doses. COD reduction commonly lands in the 60–80% band under the same conditions.
When is smart PAC control worth the higher CAPEX?
Smart control is usually worth the CAPEX for plants above about 50,000 m³/day, for highly variable influent, or when chemical and labor costs dominate OPEX. Field comparisons show 15–25% PAC savings and lower OPEX per cubic meter versus manual setpoints. Mid-size plants still benefit when operators cannot watch dose continuously, but payback may stretch to 36–60 months.
How should secondary containment be sized for PAC tanks?
Secondary containment must follow the regulation that actually applies to the stored material, not a generic “110% of tank volume” label. Earlier guidance often mis-cited OSHA 1910.110. For hazardous-waste containers, 40 CFR 264.175 uses the greater of 10% of total volume or 100% of the largest container. Flammable-liquid dikes under 29 CFR 1910.106 hold at least the largest tank. Confirm hazard classification and local permit language before fabrication.
How can a plant optimize PAC dose for its wastewater?
A plant optimizes PAC dose by pairing influent characterization with jar tests and then locking the minimum effective dose into flow-proportional or turbidity-feedback control. Record turbidity, COD, pH, and alkalinity across shifts, then verify weekly that pumps and sensors still match the calibration curve. Adjust in small percentage steps rather than large one-time changes to avoid swinging between under- and over-dosing.