Reverse osmosis water treatment forces feedwater through a semi-permeable membrane at about 150–1,200 psi (10–83 bar), removing up to 99% of dissolved salts, organics, bacteria, and suspended solids. Industrial trains commonly recover 75–95% of brackish feed as permeate; seawater trains typically recover near 45% at roughly 900 psi (about 60–70 bar). Nominal membrane pores are about 0.0001 microns, with TDS rejection often above 98%. Specific energy for many brackish trains sits near 2–5 kWh/m³, while full seawater plant intensity is frequently higher.
Reverse Osmosis Water Treatment: Process Flow and Efficiency
Industrial reverse osmosis removes dissolved salts and many organics by forcing water across thin-film composite membranes at pressures above osmotic pressure. Typical salt rejection exceeds 98% at nominal pores near 0.0001 microns. Brackish trains often run 150–500 psi with 75–95% recovery; seawater trains need about 800–1,200 psi and 40–50% recovery. Specific energy is often 2–5 kWh/m³ on brackish feed.
Industrial reverse osmosis systems use a multi-stage train that protects membranes and stabilizes recovery. Feedwater first enters pretreatment so turbidity falls below 1 NTU and suspended solids are cut before the membrane, often with sand filtration and activated carbon. That step limits fouling and supports multi-year membrane life.
The industrial RO process unfolds in five key stages:
- Pretreatment: This stage prepares the raw feedwater for RO. It typically includes mechanical filtration (e.g., multi-media filters, cartridge filters) to remove larger suspended solids, activated carbon filters for chlorine and organic matter removal, and antiscalant dosing to prevent mineral scaling on the membrane surface. The goal is to achieve a Silt Density Index (SDI) of <5 and chlorine concentration of <0.1 ppm.
- High-Pressure Pumping: After pretreatment, high-pressure pumps (ranging from 150–1,200 psi) increase the feedwater pressure, overcoming the natural osmotic pressure. The required pressure depends significantly on the feedwater's Total Dissolved Solids (TDS) concentration; for example, brackish water (TDS 1,000–10,000 mg/L) typically requires 300–500 psi, while seawater desalination (TDS 35,000–45,000 mg/L) demands 800–1,200 psi. Manufacturer data for seawater RO cite operating pressure between 60–70 bar, with example designs at 900 psi and about 45% recovery.
- Membrane Separation: The pressurized feedwater is then forced through semi-permeable membranes, primarily spiral-wound Thin-Film Composite (TFC) membranes. These membranes have a nominal pore size of approximately 0.0001 microns, allowing water molecules to pass through while rejecting dissolved salts, organic compounds, bacteria, and viruses. This separation produces two streams: the purified "permeate" and the concentrated "reject" or "brine."
- Permeate Post-Treatment: The purified permeate often requires further treatment depending on its intended use. For boiler feed or ultra-pure applications, pH adjustment or remineralization may be necessary. Degasifiers might remove dissolved gases, and ion exchange or Electrodeionization (EDI) systems can polish the water to achieve resistivity levels up to 18 MΩ·cm.
- Concentrate Disposal: The concentrate stream, containing the rejected contaminants, needs proper disposal. Options include discharge to municipal sewers (with permits), evaporation ponds, or further treatment for Zero Liquid Discharge (ZLD) systems to maximize water recovery and minimize waste.
Natural osmosis moves water toward higher solute concentration across a semi-permeable membrane. Reverse osmosis applies external pressure on the concentrate side so water molecules move the other way and leave most solutes behind. Operators balance fouling risk, recovery, and energy. Brackish trains often use 2–5 kWh/m³; peer-reviewed SWRO plant reviews place full-plant needs nearer 3.5–4.5 kWh/m³ under seawater feed. According to a U.S. DOE/LBNL desalination survey, installed sea and brackish desalination facilities in the United States average about 3.2 kWhT,equiv/m³ (range 1.6–4.8).
RO Membrane Specifications: Pore Size, Material, and Performance Benchmarks
RO membrane specifications set rejection, flux, and chemical tolerance for industrial duty. Nominal pore size near 0.0001 microns supports over 99% bacteria and virus rejection, 98–99% NaCl rejection, and about 95–98% organic matter removal as COD under stated test conditions.
Membrane Materials
The two primary membrane materials used in industrial RO are Thin-Film Composite (TFC) and Cellulose Acetate (CA), each with distinct advantages and limitations:
| Feature | Thin-Film Composite (TFC) Membranes | Cellulose Acetate (CA) Membranes |
|---|---|---|
| Material Composition | Polyamide active layer on a polysulfone support layer. | Cellulose diacetate or triacetate. |
| TDS Rejection Rate | Higher, typically >98%. | Lower, typically ~95%. |
| pH Tolerance | Wide range (pH 2–11), but sensitive to chlorine. | Narrower range (pH 4–8), more chlorine-resistant. |
| Temperature Tolerance | Up to 45°C. | Up to 30°C. |
| Fouling Resistance | Generally good, but susceptible to organic and biological fouling without proper pretreatment. | Less susceptible to organic fouling, but prone to biological degradation. |
| Industrial Applications | Dominant choice for most industrial RO, high-purity water, desalination. | Niche applications where chlorine resistance is paramount or for specific wastewater types. |
TFC membranes dominate industrial duty because rejection and pH window are wider, but chlorine and oxidants must be stripped before the array.
Membrane Configurations
Membranes are packaged into various configurations suitable for different industrial applications:
- Spiral-Wound: This is the most common configuration for industrial RO, offering high packing density and efficient flow dynamics. They are ideal for high-volume applications like municipal water treatment, boiler feedwater, and general industrial process water purification.
- Hollow-Fiber: These membranes consist of bundles of fine fibers. While offering high surface area, they are more prone to fouling and typically used in compact systems or specific wastewater applications where cleaning can be challenging.
- Plate-and-Frame: Less common for RO, but used in some specialized applications for highly viscous or high-solids feed streams due to their robust design and ease of cleaning.
Performance Benchmarks and Fouling Indicators
Industrial RO systems are evaluated based on several key performance benchmarks:
- Flux Rate: The volume of permeate produced per unit of membrane area per hour, typically 10–30 LMH (Liters per square meter per hour) for brackish water, depending on temperature and pressure.
- Recovery Rate: The percentage of feedwater converted into permeate, commonly 75–95% for industrial brackish systems, influenced by feedwater quality and operational pressure. Seawater single-pass recovery is usually nearer 40–50%.
- Membrane Lifespan: With proper pretreatment and regular cleaning, industrial RO membranes typically last 3–5 years.
Monitoring for fouling is crucial for maintaining performance and extending membrane life. Key indicators of fouling include a pressure drop across the membrane array greater than 15% from baseline, a permeate flow decline exceeding 10%, or a salt rejection drop greater than 2% (per industry standards). Early detection and intervention are vital for effective industrial water purification systems.
Reverse Osmosis vs. Other Industrial Water Treatment Methods: A Data-Driven Comparison
Engineers comparing reverse osmosis with UF, MF, DAF, and MBR should match pore size, TDS removal, energy, and footprint to the contaminant load. Each method has specific strengths, ideal applications, and operational profiles. This comparison focuses on four common alternatives: Ultrafiltration (UF), Microfiltration (MF), Dissolved Air Flotation (DAF), and Membrane Bioreactor (MBR).
| Technology | Pore Size (microns) | Contaminant Removal | Energy Consumption (kWh/m³) | Capital Cost ($/m³/day) | Operational Cost ($/m³) | Footprint (m²/m³/day) | Typical Applications |
|---|---|---|---|---|---|---|---|
| Reverse Osmosis (RO) | 0.0001 | TSS: 99.9%, TDS: 98–99%, Bacteria/Viruses: 99.99%, COD: 90–95% | 2–5 | $1,000–$3,000 | $0.20–$0.50 | 0.2–0.8 | Desalination, ultra-pure water (semiconductor, pharma), boiler feed, high-purity process water |
| Ultrafiltration (UF) | 0.01–0.1 | TSS: 99.9%, TDS: Low, Bacteria/Viruses: 99.9% (bacteria), 99% (viruses), COD: 50–70% | 0.5–1.5 | $500–$1,500 | $0.10–$0.30 | 0.5–1.5 | RO pretreatment, surface water treatment, industrial wastewater clarification, potable water treatment |
| Microfiltration (MF) | 0.1–10 | TSS: 99%, TDS: Negligible, Bacteria/Viruses: 99% (bacteria), Low (viruses), COD: 20–40% | 0.2–0.8 | $300–$1,000 | $0.05–$0.20 | 0.8–2.0 | Pre-filtration, clarification of beverages, removal of suspended solids |
| Dissolved Air Flotation (DAF) | N/A (physical separation) | TSS: 80–95%, TDS: Negligible, Bacteria/Viruses: 50–70%, COD: 60–85% | 0.3–1.0 | $800–$2,500 | $0.15–$0.40 | 1.0–3.0 | Oil & gas, food processing, pulp & paper, municipal wastewater primary treatment, industrial wastewater clarification |
| Membrane Bioreactor (MBR) | 0.03–0.4 | TSS: 99.9%, TDS: Negligible, Bacteria/Viruses: 99.99% (bacteria), 99.9% (viruses), COD: 90–98% | 1.0–3.0 | $2,000–$5,000 | $0.30–$0.80 | 0.3–1.0 | Municipal and industrial wastewater treatment (high-quality effluent for reuse), advanced wastewater recycling |
RO’s primary strength lies in its superior TDS removal capability, making it indispensable for applications requiring ultra-pure water or desalination. Its compact footprint, especially when considering the purity achieved, and its scalability for high-purity industries like semiconductor and pharmaceutical manufacturing, are significant advantages. For example, a 100 m³/h RO system can occupy as little as 50 m², offering high output in limited space.
RO energy use of 2–5 kWh/m³ in the comparison table is higher than most filtration-only options and raises OPEX when electricity is costly. Membranes foul from solids, organics, and scalants, so UF pretreatment is common. Pairing RO with upstream solids control often cuts cleaning frequency and total cost of ownership.
Industrial RO System Design: Sizing, Recovery Rates, and Cost Optimization
Industrial RO system design starts from feed quality, permeate targets, flow, and concentrate limits, then sizes membrane area and pump duty. System sizing is a fundamental step, where the required permeate flow rate (m³/h), recovery rate (%), and total membrane area (m²) are calculated. For instance, a 100 m³/h system designed for a 75% recovery rate would require approximately 1,200 m² of membrane area, based on an industry rule of thumb of 1 m² per 0.08 m³/h permeate production.
Recovery Rate Trade-offs
Recovery rate equals permeate flow divided by feed flow and sets both concentrate volume and fouling risk. Higher recovery rates (for example 90%) cut concentrate volume and raise water reuse. They also raise foulant and scalant levels at the membrane, so fouling risk and osmotic pressure climb together. The balance between recovery rate, energy demand, and fouling risk is presented below:
| Recovery Rate (%) | Energy Consumption (kWh/m³) | Fouling Risk | Comments |
|---|---|---|---|
| 50–65% | 1.5–3.0 | Low | Lower concentration of foulants, less frequent cleaning. |
| 65–80% | 2.0–4.0 | Medium | Common industrial range, good balance of water recovery and operational stability. |
| 80–90% | 3.0–5.0+ | High | Increased concentration polarization, higher chemical cleaning frequency, requires advanced antiscalants. |
| >90% | 4.0–6.0+ | Very High | Often requires specialized membranes (e.g., high-rejection, low-fouling) and advanced ZLD techniques; energy recovery devices are crucial. |
Selecting the optimal recovery rate involves a detailed economic analysis comparing the cost of concentrate disposal against the costs of increased energy, chemicals, and membrane cleaning/replacement associated with higher recovery.
Cost Components and Optimization
Capital and operating cost for reverse osmosis water treatment depend on capacity, feed TDS, and automation scope. For a typical 50 m³/h system, CAPEX can range from $150,000–$300,000, covering membranes, high-pressure pumps, pressure vessels, instrumentation, and automation. OPEX, which includes energy, chemicals (antiscalants, cleaning agents), membrane replacement, and labor, typically ranges from $0.20–$0.40/m³ (HydropureWater product catalog and industry benchmarks).
Several strategies can significantly optimize these costs:
- Energy Recovery Devices (ERDs): For high-pressure systems (especially desalination), earlier guidance cited 30–50% energy reduction from concentrate energy recovery. Peer-reviewed SWRO reviews place common ERD savings nearer 25–40% versus plants without modern recovery. Isobaric ERD hydraulic efficiency is often near 95–97%.
- Variable Frequency Drives (VFDs): Implementing VFDs for high-pressure pumps allows precise control of flow and pressure, optimizing energy use based on demand fluctuations.
- Automated Cleaning Systems: Automated Clean-In-Place (CIP) systems reduce manual labor, ensure consistent cleaning protocols, and minimize downtime, contributing to lower OPEX.
- Hybrid Systems: Pair an Industrial Reverse Osmosis (RO) Water Treatment System with ion exchange or EDI when ultrapure polish is required. That hybrid path often lowers total ownership cost versus forcing RO alone to the final resistivity target.
Which industrial RO systems suit high-TDS recycling?
High-TDS industrial recycling usually needs brackish or seawater-rated RO with strong pretreatment, antiscalant control, and staged recovery rather than a single aggressive pass. U.S. plants recycling cooling-tower blowdown or process brine often target 65–80% recovery first, then add a second stage or evaporator if ZLD is required. Selection checklist: measure feed SDI and scaling ions; size flux at 10–30 LMH for brackish duty; confirm concentrate disposal permits. Plan CIP chemistry for carbonate and silica, and verify pump and vessel pressure class for peak osmotic pressure.
What RO design fits semiconductor production?
Semiconductor makeup water typically needs RO plus polishing to reach ultrapure resistivity near 18 MΩ·cm after EDI or mixed-bed ion exchange. Feed often comes from municipal or recycled plant water with UF ahead of RO to hold SDI below 5. Two-pass RO is common when single-pass permeate conductivity still exceeds polish limits. Keep chlorine below 0.1 ppm before TFC membranes, and trend salt rejection so a 2% drop triggers element inspection.
Common Industrial RO Challenges and Troubleshooting Guide
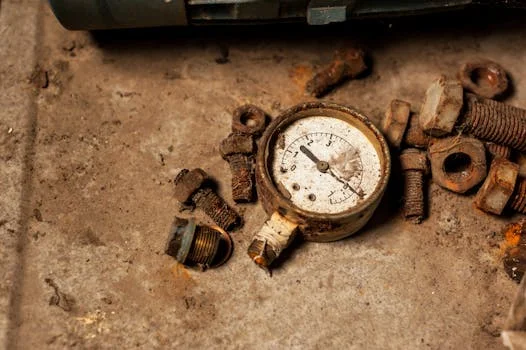
Industrial reverse osmosis performance problems usually trace to fouling, scaling, leaks, or temperature swings rather than pump failure alone. Proactive monitoring and timely troubleshooting are essential to maintain efficiency and extend the lifespan of RO membranes.
- Membrane Fouling (Organic, Inorganic, Biological)
- Symptoms: Gradual permeate flow decline (>10% from baseline), increased differential pressure across membrane stages (>15%), increased feed pressure to maintain flow.
- Causes: Accumulation of suspended solids, organic matter (humic acids, oils), biological growth (biofilm), or colloidal particles on the membrane surface.
- Diagnostic: Monitor Silt Density Index (SDI) of feedwater (should be <5). Inspect membrane surface during cleaning. Analyze foulant composition.
- Solutions: Enhance pretreatment (e.g., improve filtration, adjust coagulant dosing). Implement regular chemical cleaning (CIP) with appropriate detergents (e.g., alkaline detergent pH 11–12 at 30–40°C for 30–60 minutes for organic/biological fouling; acidic detergent pH 2–3 for inorganic fouling). Consider biocide dosing for biological fouling prevention.
- Scaling (Calcium Carbonate, Silica, Sulfate)
- Symptoms: Gradual permeate flow decline, increased salt passage (lower rejection), increased differential pressure. Scaling often occurs at the tail end of an RO array.
- Causes: Precipitation of sparingly soluble salts as their concentration exceeds saturation limits within the RO system.
- Diagnostic: Analyze concentrate water chemistry to identify supersaturated ions. Inspect membranes for visible scale during cleaning.
- Solutions: Optimize antiscalant dosing (type and concentration). Adjust system recovery rate to prevent exceeding solubility limits. Implement periodic acidic cleaning (pH 2–3) to dissolve inorganic scales.
- Permeate Flow Decline
- Symptoms: Output volume consistently below design specifications, even with increased feed pressure.
- Causes: Membrane fouling, scaling, membrane compaction (irreversible at very high pressures), low feedwater temperature, or physical damage.
- Diagnostic: Check feedwater temperature (flow drops ~3% per °C decrease). Verify feed pressure and differential pressure. Perform individual membrane element testing.
- Solutions: Address underlying fouling or scaling. Adjust operating temperature if feasible. Consider membrane replacement if compaction or damage is evident.
- Salt Rejection Drop
- Symptoms: Increased conductivity or TDS in the permeate, exceeding quality targets.
- Causes: Membrane damage (e.g., chemical attack from chlorine, abrasive particles), O-ring leaks, improper sealing, or high feedwater TDS.
- Diagnostic: Conduct a salt passage test on individual elements. Check for visible leaks around pressure vessels. Verify feedwater TDS.
- Solutions: Identify and replace damaged membranes or O-rings. Ensure proper membrane loading and sealing. Optimize pretreatment to prevent chemical degradation (e.g., activated carbon for chlorine removal).
- High Pressure Drop (Across Array or Individual Elements)
- Symptoms: Significant pressure difference between the inlet and outlet of an RO stage or across a single membrane element.
- Causes: Severe fouling or scaling, blockage of flow channels within the membrane element, or clogged permeate tubes.
- Diagnostic: Measure pressure at various points along the RO array. Inspect membrane elements for blockages upon removal.
- Solutions: Perform aggressive chemical cleaning. Replace severely fouled or damaged elements. Ensure proper feedwater filtration to prevent particle ingress.
A typical troubleshooting approach follows a flowchart: Start with pressure drop measurement → if >15%, check for fouling/scaling → if fouling, perform cleaning cycle → if scaling, adjust antiscalant dosage. Preventive measures are paramount, including robust pretreatment, consistent antiscalant dosing, regular membrane cleaning (every 3–6 months depending on feedwater), and continuous monitoring of critical parameters like pressure, flow, and conductivity.
Who This Is For / Who Should Look Elsewhere / Next Step
Plant engineers, EPC contractors, and procurement teams sizing boiler feed, process water, reuse, or desalination trains will get the most from this page. Facilities that only need solids or oil removal without TDS reduction should start with clarification or biological treatment instead of RO. If you already have feed analysis and a permeate target, request a duty-based sizing review for an Industrial Reverse Osmosis (RO) Water Treatment System before locking CAPEX.
Frequently Asked Questions
What is the typical lifespan of an industrial RO membrane?
Industrial RO membranes typically last 3 to 5 years when pretreatment holds SDI below 5, chlorine stays under 0.1 ppm, and CIP follows measured differential pressure or flux decline. Harsh feed, high recovery above design, or oxidant breakthrough shortens that window. Track normalized permeate flow and salt rejection so replacement is planned, not reactive.
How often do industrial RO systems require cleaning?
Most industrial RO trains need CIP every 3 to 12 months, timed by performance loss rather than a fixed calendar alone. Clean when permeate flow falls more than 10%, differential pressure rises more than 15%, or salt rejection drops more than 2% from baseline. Earlier cleaning on high-fouling feeds costs less than irreversible compaction.
Can RO systems treat all types of industrial wastewater?
RO alone cannot treat every industrial wastewater stream, especially feeds with high solids, oils, or biological load that foul membranes quickly. Those streams need clarification, biological treatment, or oxidation before RO. Use RO when dissolved salts or conductivity must fall after solids are controlled.
What are the main factors influencing RO system operating costs?
Energy at about 2–5 kWh/m³ on many brackish duties, antiscalant and CIP chemicals, membrane replacement every 3–5 years, and labor dominate OPEX. Higher feed TDS and tighter permeate limits raise pump power and polishing cost. ERDs, VFDs, and stable pretreatment cut the energy and chemical share.
Is zero liquid discharge (ZLD) achievable with RO technology?
RO can provide the high-recovery front end of many ZLD schemes, but true ZLD usually needs evaporators, crystallizers, or specialty brine membranes after RO. Raising RO recovery above 90% without those steps sharply increases scaling risk and energy. Design ZLD as a train, not a single RO skid.