Advanced Packaging Wastewater Treatment Solution: 2025 Engineering Specs, Cost Data & Zero-Liquid-Discharge Blueprint
Advanced packaging wastewater treatment solutions achieve 97.8% removal of COD, BOD₅, SS, and chroma using MBR membrane bioreactors (0.1 μm filtration) and DAF systems (4–300 m³/h capacity). For a typical packaging plant processing 100 m³/day of wastewater with 1,200 mg/L COD, an integrated MBR + chemical dosing system reduces effluent COD to <50 mg/L, meeting EPA and EU discharge limits while cutting sludge disposal costs by 40%. Zero-liquid-discharge (ZLD) designs add reverse osmosis (95% recovery) for water reuse in printing or cooling processes. An advanced packaging solution sized on measured load, not nameplate flow, keeps those targets stable across shift swings.
Why Packaging Wastewater Requires Advanced Treatment
Packaging wastewater stresses standard treatment trains because it carries recalcitrant organics and swings in hydraulic load. Typical influent values sit at COD 800–3,000 mg/L, BOD₅ 300–1,500 mg/L, and SS 500–2,000 mg/L (HydropureWater field data, 2025). Those numbers come from ink residues, synthetic adhesives, and starch-based coatings used in corrugated box and flexible packaging lines.
Regulators have tightened the floor. EU chemical-sector BAT conclusions list COD BAT-AELs of 30–100 mg/L as a yearly average (Commission Implementing Decision (EU) 2016/902); plants still treat COD <100 mg/L as the practical upper bound. EPA Effluent Guidelines are set industry-by-industry under the Clean Water Act; earlier plant guidance often used COD <120 mg/L as a typical permit target. Conventional primary plus secondary treatment removes only 70–85% of COD, which leaves most plants above either line and exposed to fines. Polyvinyl acetate (PVA) adhesives and UV-curable inks are particularly hard on biomass: they foam, knock MLSS out of range, and crash nitrification in ordinary activated sludge tanks.
Sludge is the real cost driver. Packaging wastewater generates 0.3–0.8 kg of dry solids per cubic meter treated, which runs 3–5× higher than municipal sewage. Advanced treatment protocols apply sludge dewatering presses for packaging wastewater to cut sludge volume by 40–60%, which lowers total cost of ownership more than any other single upgrade.
| Parameter | Raw Packaging Influent | Conventional Treatment Effluent | Advanced Treatment Effluent | Regulatory Limit (Typical) |
|---|---|---|---|---|
| COD (mg/L) | 800–3,000 | 150–450 | <50 | <100 (EU) / <120 (EPA) |
| BOD₅ (mg/L) | 300–1,500 | 45–150 | <10 | <30 |
| SS (mg/L) | 500–2,000 | 100–300 | <5 | <35 |
| Chroma (Units) | 400–800 | 100–200 | <10 | <50 |
Process Flow: Advanced Treatment for Packaging Wastewater
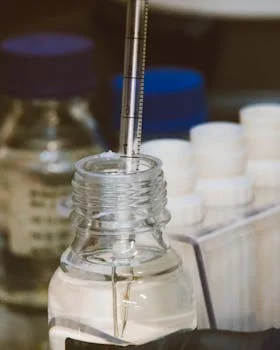
The advanced treatment process for packaging wastewater runs in a fixed sequence so each stage strips a specific contaminant class at its best operating point. Primary treatment starts with a rotary mechanical bar screen (GX Series) that lifts 95% or more of solids above 1 mm, paper fibers and plastic scraps included, before they reach the pump gallery.
Secondary treatment is the DAF system for packaging wastewater. Micro-bubble flotation pulls out 85–95% of fats, oils, grease (FOG), and colloidal matter, and the unit spans 4–300 m³/h to match printing and coating line swings. Tertiary treatment is the integrated MBR system for COD/BOD removal. Its 0.1 μm PVDF membranes hold a 97.8% removal rate, drop the secondary clarifier, and produce permeate clean enough for reuse.
Disinfection and sludge handling close the train. Chlorine dioxide generators hit a 99.9% pathogen kill without leaving chemical residuals, which keeps effluent within EPA discharge rules. The sludge stream goes to a plate-and-frame filter press that dewaters cake to 30–40% dry solids, trimming hauling costs 50–70% versus wet sludge.
Standard Process Flow: Influent → Rotary Screening (GX) → Equalization Tank → DAF → MBR (DF) → Disinfection → Effluent Discharge (or RO for ZLD).
Technology Comparison: MBR vs. DAF vs. Chemical Dosing for Packaging Wastewater
Choosing between MBR, DAF, and chemical dosing means matching contaminant profile to site constraints. MBR systems lead on COD/BOD removal and water reuse, take about 60% less floor area than conventional activated sludge, and cost $1,200–$1,800/m³/day in CAPEX. Operators can learn how MBR systems achieve 95%+ contaminant removal to back the spend with land savings and reuse-grade effluent.
DAF is cheaper on upfront cost at $500–$900/m³/day and excels at FOG plus suspended solids, but it depends on steady coagulant (PAC) and polymer dosing. Most plants we size pair automated dosing controls with DAF, which cuts chemical waste 30% and pins OPEX near $0.10–$0.30/m³. A DAF + MBR hybrid usually wins on high-load packaging lines: it pushes COD removal to 99% and drops CAPEX roughly 15% below a stand-alone large MBR by easing the organic load on the membranes.
| Technology | COD Removal (%) | FOG Removal (%) | Footprint (m²/m³/day) | CAPEX ($/m³/day) | OPEX ($/m³) | Best For |
|---|---|---|---|---|---|---|
| MBR (Membrane Bioreactor) | 97.8% | 90% | 0.2–0.4 | 1,200–1,800 | 0.40–0.60 | Reuse & High COD |
| DAF (Flotation) | 40–60% | 95% | 0.5–0.8 | 500–900 | 0.20–0.40 | FOG & SS Removal |
| Chemical Dosing | 20–30% | N/A | 0.1 | 150–300 | 0.10–0.30 | Pre-treatment |
| Hybrid (DAF + MBR) | 99% | 98% | 0.4–0.6 | 1,100–1,500 | 0.35–0.55 | High-load Plants |
Cost Breakdown: Advanced Packaging Wastewater Treatment in 2025
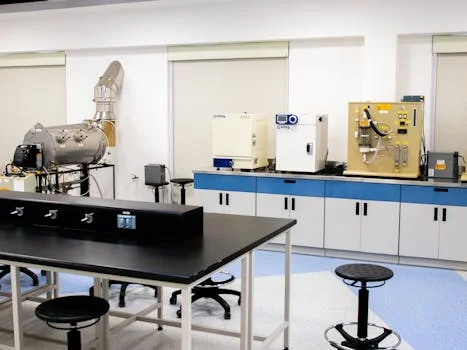
Budget for an advanced packaging wastewater treatment solution has to cover CAPEX and OPEX in the same spreadsheet. For a 2025 install, CAPEX runs $500/m³/day for a base DAF line up to $4,000/m³/day for a full Zero-Liquid-Discharge (ZLD) train. OPEX lands between $0.20 and $0.80/m³ once you stack energy, reagents, and membrane replacement.
Sludge and reuse are where the savings stack. Sludge disposal in the EU or China runs $100–$300 per ton of dry solids; a plate-and-frame press at 30% solids roughly halves that line item. Plants that send treated effluent to non-process use or cooling towers save $0.50–$1.50/m³ on utility bills, and most recover full system cost in 3–5 years. The article on calculating ROI for advanced wastewater treatment walks through the freshwater-savings math for similar mid-size plants.
| Technology | CAPEX ($/m³/day) | OPEX ($/m³) | Sludge Reduction (%) | ROI (Years) |
|---|---|---|---|---|
| DAF System | 500–900 | 0.20–0.40 | 30% | 2.5–4.0 |
| MBR System | 1,200–1,800 | 0.40–0.60 | 50% | 3.5–5.0 |
| ZLD (RO + Evap) | 2,500–4,000 | 1.00–2.50 | 70% | 4.5–7.0 |
Zero-Liquid-Discharge (ZLD) for Packaging Plants: Feasibility and Design
ZLD systems for packaging plants pair MBR tertiary treatment with an RO system for packaging wastewater reuse. Together they hit 95% recovery, and the permeate feeds back into printing, starch preparation, or cooling loops without treatment gaps.
ZLD only pays off under three triggers: extreme water scarcity, strict industrial discharge rules, or freshwater costs above the local reuse threshold. CAPEX lands 2–3× above a discharge-only line, but the compliance and supply security justify it in stressed basins. Engineers designing for high-salinity streams can fold forward osmosis (FO) or nanofiltration (NF) into the train, as detailed in the broader industrial ZLD design blueprint. A 150 m³/day ZLD system at a German packaging plant cut freshwater intake 90%, saved about $120,000 per year, and returned capital in 4.5 years.
Decision Framework: Choosing the Right System for Your Packaging Plant
Selecting the right wastewater system takes a structured pass through the site data before any vendor call.
- Step 1: Characterize the Wastewater: Run lab tests on 24-hour composite samples to lock down average and peak COD, BOD₅, SS, FOG, pH, and temperature. Confirm whether ink or adhesive spikes line up with specific shifts.
- Step 2: Define the Discharge or Reuse Target: Decide between EPA / EU surface discharge, sewer discharge, or on-site reuse for cooling, starch prep, or washdown. The target sets the technology floor.
- Step 3: Match Flow and Load to Unit Sizing: Pick DAF for FOG-heavy streams, MBR for reuse-grade effluent, or DAF + MBR hybrid for high-load lines above 1,500 mg/L COD.
- Step 4: Budget CAPEX, OPEX, and Sludge Cost Together: Combine equipment cost with chemical, energy, membrane replacement, and sludge disposal to get a real annual figure.
- Step 5: Check Site Constraints: Confirm footprint, ceiling height, power supply, and operator skill level; MBR needs tighter control than DAF.
- Step 6: Plan for Compliance Documentation: Lock in sampling points, online COD / TSS meters, and reporting templates before commissioning.
Selection Checklist and Cost Drivers
Before signing a PO, walk this short checklist against your site data:
- Influent COD >1,500 mg/L or FOG >300 mg/L → hybrid DAF + MBR.
- Need reuse-grade permeate for cooling or starch prep → MBR or MBR + RO.
- Sludge disposal >$200/ton dry in your region → plate-and-frame press sized for ≥30% cake solids.
- Freshwater cost >$1.50/m³ or strict discharge caps → ZLD with RO at 95% recovery.
- Footprint <0.4 m² per m³/day → MBR preferred over activated sludge.
- Operator headcount limited → favor automated dosing and self-cleaning membranes.
The four cost drivers that swing the budget most are membrane replacement frequency, chemical dosing rate, sludge hauling tonnage, and energy for RO or MBR aeration. Trim each by 10–20% and OPEX falls in line with the tables above.
Who This Is For
This guide fits plant engineers and EPC contractors sizing new packaging wastewater trains or retrofitting existing activated sludge systems that miss EPA or EU COD limits. It also helps procurement teams benchmark vendor quotes for DAF, MBR, and ZLD packages.
If your stream is heavy metals, landfill leachate, or dairy effluent, look at the metal-removal or industrial wastewater reuse tracks instead — those flows call for different chemistry.
Need a load-matched advanced packaging solution sized for your ink, adhesive, and FOG profile? Request a technical quote with influent data at request a packaging wastewater treatment quote.
Frequently Asked Questions
What COD removal can an advanced packaging wastewater treatment system achieve?
An advanced packaging wastewater treatment system reaches 97.8% COD removal with MBR and 99% with a DAF + MBR hybrid. Effluent COD lands below 50 mg/L, which clears both the EU <100 mg/L and EPA <120 mg/L discharge limits for packaging plants at typical 1,200–3,000 mg/L influent COD.
How much does an advanced packaging wastewater treatment solution cost in 2025?
CAPEX for a 2025 packaging wastewater treatment solution runs $500–$900/m³/day for DAF, $1,200–$1,800/m³/day for MBR, and $2,500–$4,000/m³/day for a full ZLD train with RO and evaporation. OPEX sits between $0.20 and $0.80/m³, with ZLD trains reaching $1.00–$2.50/m³ because of RO energy and thermal evaporation cost.
Is zero-liquid-discharge (ZLD) feasible for a packaging plant?
ZLD is feasible for packaging plants when water scarcity, strict industrial discharge directives, or freshwater costs above $1.50/m³ push the payback. A 150 m³/day ZLD system in a German packaging plant cut freshwater intake 90%, saved $120,000 per year, and returned capital in 4.5 years under those conditions.
Which wastewater technology is best for high FOG packaging lines?
DAF flotation is the best base technology for high FOG packaging lines because micro-bubble flotation pulls out 85–95% of fats, oils, and grease before they reach the biological stage. Pairing DAF with MBR holds FOG removal at 98% and protects the 0.1 μm membranes from fouling.
How long does it take to get ROI on advanced packaging wastewater treatment?
Most packaging plants recover full system cost in 3–5 years when treated effluent replaces $0.50–$1.50/m³ of freshwater in cooling towers or non-process loops. DAF-only systems typically hit ROI in 2.5–4.0 years, MBR in 3.5–5.0 years, and full ZLD in 4.5–7.0 years, depending on sludge disposal tariffs.