Reverse osmosis for food processing removes over 99% of dissolved salts, bacteria, and viruses through 0.0001–0.001 micron membranes, recovers 50–85% of feedwater, and typically costs $20,000–$1,000,000+ CAPEX with 2–5 kWh/m³ energy use while meeting FDA 21 CFR Part 110, EU 1935/2004, and GB 5749-2022.
Food plants use RO for ingredient water, CIP rinse water, and juice concentration. This guide consolidates engineering parameters, capacity bands, cost ranges, compliance targets, and maintenance diagnostics used to specify and operate food-grade RO systems.
What contaminants and regulatory risks does RO remove in food plants?
Process water quality controls product safety and plant licensing. In China, QS certification requires defined purification levels for process water in many food and all beverage lines; non-compliance can halt production and trigger fines up to ¥300,000 (HydropureWater analysis, 2025).
Chlorine and chloramines form trihalomethanes (THMs) and off-flavors when they react with organics. Nitrates from agricultural runoff raise health and stability risks. Lead and cadmium accumulate in product. Microbial pathogens such as Cryptosporidium resist chlorine disinfection. A 2023 Dairy Industry Association study reported dairy plants on untreated water had 12% higher spoilage rates and used three times more CIP chemical than plants with advanced treatment. RO addresses these loads with >99.9% Cryptosporidium removal and 50–85% water recovery under FDA, EU, and GB food-water regimes.
The table below details common contaminants and their risks in food processing water:
| Contaminant | Source | Risk to Food Safety |
|---|---|---|
| Chlorine/Chloramines | Municipal water disinfection byproducts | Off-flavors, reaction with food components, formation of THMs |
| Nitrates | Agricultural runoff, industrial discharge | Health risks, especially for infants; can affect product stability |
| Heavy Metals (e.g., Lead, Cadmium) | Industrial pollution, corrosion of pipes | Toxic, accumulates in products, severe health risks |
| Bacteria (e.g., E. coli, Salmonella) | Fecal contamination, poor hygiene | Product spoilage, foodborne illness, recalls |
| Viruses (e.g., Norovirus) | Human/animal waste | Foodborne illness outbreaks, severe health risks |
| Protozoa (e.g., Cryptosporidium) | Surface water contamination | Waterborne disease, resistant to chlorine disinfection |
| Dissolved Salts (TDS) | Natural minerals, industrial discharge | Scale formation, off-tastes, interferes with processing |
What flux, recovery, pressure, and membrane life should you design for?
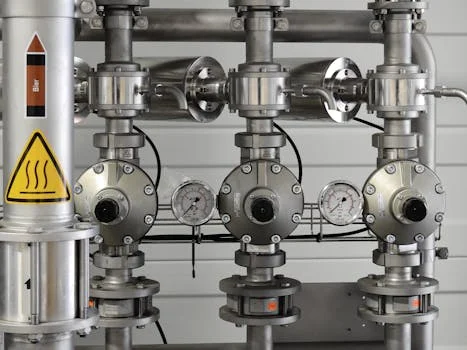
A food-plant RO train starts with pretreatment—multimedia filtration for suspended solids and softening for hardness—then a high-pressure pump feeds semi-permeable membranes. Permeate may receive UV disinfection or remineralization to match taste and microbial control limits for the intended use.
Design bands for food duty are concrete: flux 15–30 L/m²/h, recovery 50–85%, pore size 0.0001–0.001 microns, operating pressure 10–80 bar by feed TDS, TDS rejection >98%, and membrane life 3–5 years with adequate CIP and pretreatment. Higher flux raises throughput but accelerates fouling; higher recovery cuts wastewater but increases scaling and concentration polarization. With proper maintenance and engineering standards for food-grade water treatment, membrane life of 3–5 years is achievable.
| Parameter | Typical Range (Food Processing) | Impact on Food Processing |
|---|---|---|
| Flux Rate | 15–30 L/m²/h | Determines permeate production volume; higher rates can increase fouling propensity. |
| Recovery Rate | 50–85% | Indicates water efficiency (less wastewater); higher rates increase scaling risk. |
| Membrane Pore Size | 0.0001–0.001 microns | Crucial for contaminant rejection (salts, bacteria, viruses); ensures food-grade purity. |
| Operating Pressure | 10–80 bar | Energy consumption driver; higher pressure needed for higher TDS feedwater. |
| Membrane Lifespan | 3–5 years | Directly impacts OPEX; proper CIP and pretreatment extend life. |
| TDS Rejection | >98% | Ensures low mineral content in product water, preventing off-tastes and scaling. |
Organic fouling from proteins, carbohydrates, and fats restricts flow. Scaling from calcium carbonate, silica, or sulfates appears when concentrations exceed solubility in the module. Biofouling forms resistant biofilms. High organic dairy loads often need stronger pretreatment, including DAF systems for RO pretreatment in food plants, to keep CIP intervals workable.
| Fouling Type | Cause | Prevention Method |
|---|---|---|
| Organic Fouling | Proteins, carbohydrates, fats, humic substances from raw water or process streams. | Improved pretreatment (e.g., DAF, ultrafiltration), frequent low-pH cleaning, antiscalants. |
| Scaling | Precipitation of mineral salts (CaCO₃, CaSO₄, SiO₂) due to concentration. | Water softening (ion exchange), antiscalant dosing, pH adjustment. |
| Biofouling | Growth of bacteria, fungi, and other microorganisms forming biofilms. | Regular biocide dosing (e.g., chlorine dioxide), UV sterilization, membrane cleaning. |
| Particulate Fouling | Suspended solids, colloids, silt, clay, iron oxides. | Multimedia filtration, cartridge filters (5 micron), backwashable filters. |
How should a food plant size RO capacity and select membrane type?
Match permeate capacity to demand profile. Craft breweries and small bakeries typically need 1–5 m³/h for ingredient water and rinse. Dairy plants often need 5–50 m³/h for CIP and dilution. Beverage bottling commonly runs 20–100 m³/h. Meat and poultry washdown and ingredient water can require 50–200 m³/h. Large ingredient manufacturers may need >100 m³/h across multiple trains.
| Plant Type | Water Demand Profile | Recommended RO Capacity |
|---|---|---|
| Craft Brewery/Small Bakery | Ingredient water, equipment rinse (intermittent) | 1–5 m³/h |
| Dairy Processing Plant | CIP rinse, product dilution, boiler feed (continuous) | 5–50 m³/h |
| Beverage Bottling Plant | Ingredient water, bottle rinsing (continuous, high volume) | 20–100 m³/h |
| Meat/Poultry Processing | Washdown, scalding, ingredient water (continuous, high volume) | 50–200 m³/h |
| Large Food Ingredient Manufacturer | Process water, concentration, CIP (very high, continuous) | >100 m³/h (often multiple trains) |
Thin-film composite (TFC) membranes deliver high rejection (>99%) but require thorough dechlorination. Cellulose acetate (CA) membranes tolerate chlorine, with lower rejection (95–98%) and shorter life. Polyamide (PA) membranes suit high-TDS feeds but need strong biofouling control. Practical selection: prefer TFC when feed TDS is less than 1,000 ppm; consider CA when free chlorine is persistent; combine PA with enhanced pretreatment when organic load is high.
PLC control for flux, pressure, conductivity, and automated CIP is standard on large trains. Dual-train redundancy keeps meat and beverage lines running during CIP. Remote monitoring supports multi-site bottling networks. Use the vendor checklist below before purchase.
System Selection Checklist: 10 Questions to Ask RO Vendors
- What is the maximum Total Dissolved Solids (TDS) your system can reliably handle with the proposed membrane type?
- What is the guaranteed permeate recovery rate and how is it optimized for our specific feedwater quality?
- What is the expected lifespan of the membranes under our projected operating conditions, and what is the warranty?
- Can the system be configured with dual-train redundancy for continuous operation?
- What level of automation (PLC, HMI) is included, and what data logging capabilities are available for compliance?
- What are the recommended pretreatment steps based on our raw water analysis, and can you integrate those solutions?
- What is the energy consumption (kWh/m³) at our target flow rate and feedwater conditions?
- What are the standard CIP procedures, recommended chemicals, and estimated frequency for our application?
- Does your system design comply with FDA 21 CFR Part 110, EU 1935/2004, and China GB 5749-2022?
- What is the local service and support availability, including spare parts and technical assistance?
What CAPEX, OPEX, and payback periods apply to food-grade RO?
Small systems (1–5 m³/h) typically cost $20,000–$50,000. Medium systems (5–50 m³/h) run $50,000–$200,000. Large systems (50–200 m³/h or more) exceed $200,000 and can reach $1 million for multi-train automated plants.
OPEX is dominated by energy at 2–5 kWh/m³ ($0.10–$0.25/m³ at $0.05/kWh), membrane replacement at $0.05–$0.15/m³ over 3–5 years, CIP and antiscalant chemicals at $0.02–$0.08/m³, labor at $0.05–$0.15/m³, and wastewater disposal at $0.01–$0.05/m³.
A 20 m³/h dairy RO can save about $80,000 per year in water and chemicals, with an estimated 2.5-year payback (HydropureWater field data, 2025). Savings come from lower municipal intake, lower discharge volume, and reduced CIP chemical use when rinse water quality is stable.
| System Size (Permeate Flow) | Typical CAPEX (USD, 2025) | Estimated OPEX (USD/m³ Permeate) | Annual Water/Chemical Savings (Example) | Estimated Payback Period |
|---|---|---|---|---|
| Small (1–5 m³/h) | $20,000–$50,000 | $0.15–$0.30 | $10,000–$25,000 | 2.5–4 years |
| Medium (5–50 m³/h) | $50,000–$200,000 | $0.10–$0.20 | $40,000–$150,000 | 1.5–3 years |
| Large (50–200 m³/h) | $200,000–$1,000,000+ | $0.08–$0.15 | $150,000–$500,000+ | 1–2.5 years |
Unplanned downtime can cost large food plants $1,000–$5,000 per hour. QS fines in China can reach ¥300,000. A 2022 EU bottled-water recall tied to microbial contamination from untreated process water exceeded €2 million (Industry reports, 2022). Those figures define the risk side of under-specified RO and weak maintenance.
Which FDA, EU, and GB standards must food-plant RO permeate meet?
FDA 21 CFR Part 110 requires process water to be safe and suitable for intended use. EU Regulation 1935/2004 limits contaminant transfer from materials in contact with food, including water. China’s GB 5749-2022 sets limits for 93 drinking-water contaminants and is widely used as a food-process baseline. WHO guidance for food-production water includes less than 1 CFU/100 mL E. coli and less than 10 CFU/mL total coliforms.
Operational targets used on RO trains include turbidity <1 NTU after multimedia filtration, hardness <50 ppm after softening, permeate conductivity <10 µS/cm, TDS <50 ppm, microbial counts <1 CFU/100 mL, UV dose of at least 30 mJ/cm² at 254 nm, and residual disinfectant of 0.5–1 ppm where distribution control requires it via chlorine dioxide generators for RO post-treatment disinfection.
| Compliance Area | Specific Requirement/Parameter | Target Value for RO System |
|---|---|---|
| Pretreatment Performance | Turbidity (after multimedia filtration) | < 1 NTU (essential for membrane protection) |
| Hardness (after softening) | < 50 ppm (prevents scaling) | |
| RO Permeate Quality | Conductivity | < 10 µS/cm (indicates high purity, meets EU/FDA) |
| Total Dissolved Solids (TDS) | < 50 ppm (meets most food-grade requirements) | |
| Microbial Counts (e.g., total coliforms, E. coli) | < 1 CFU/100 mL (post-RO, pre-disinfection, meets WHO) | |
| Post-Treatment Effectiveness | UV Disinfection (254 nm) | Minimum 30 mJ/cm² dose (for microbial inactivation) |
| Residual Disinfectant (e.g., chlorine dioxide generators for RO post-treatment disinfection) | 0.5–1 ppm (for distribution system control, where applicable) | |
| Monitoring & Documentation | Continuous Monitoring | Real-time logging of pressure, flow, conductivity, pH (PLC-controlled) |
| Documentation | Daily logs of permeate quality, CIP records, membrane replacement dates, calibration records |
Audit red flags include missing CIP records (immediate QS non-compliance in China), permeate conductivity consistently above 20 µS/cm in beverage plants (fails EU 1935/2004 expectations), and no redundancy on critical water trains where FDA 21 CFR Part 110 expects continuous safe operation.
How do you diagnose fouling, scaling, and CIP failures in food-plant RO?
A pressure drop across membranes exceeding 10% from baseline usually indicates fouling or scaling. Low permeate flow at normal feed pressure points to fouled membranes or high feed TDS. High permeate conductivity indicates membrane damage, O-ring failure, or severe scaling. CIP every 2 weeks usually means weak pretreatment or high organic load.
| Symptom | Likely Cause | Diagnostic Steps | Fix |
|---|---|---|---|
| Pressure drop >10% across membranes | Organic fouling (e.g., proteins, sugars) or Particulate fouling | Check SDI (Silt Density Index) of feedwater; if >5, improve pretreatment. Analyze foulant. | CIP with alkaline cleaner (pH 11–12) at low pressure/high flow. Improve pretreatment. |
| Low permeate flow (<10% from baseline) | Fouled membranes, high feedwater TDS, low feedwater temperature. | Verify feedwater temperature & pressure. Check membrane differential pressure. | Perform CIP. Adjust operating pressure for temperature. Optimize antiscalant dose. |
| High permeate conductivity (>10% from baseline) | Membrane damage (tear/leak), O-ring failure, scaling, incorrect pH. | Check individual membrane element conductivity. Inspect housing for leaks. Verify feedwater pH. | Replace damaged membrane/O-rings. Perform acid CIP for scaling. Adjust feedwater pH. |
| Frequent CIP cycles (e.g., every 2 weeks) | Poor pretreatment, high organic/particulate load, insufficient antiscalant. | Review pretreatment system performance. Analyze feedwater for organics/hardness. | Upgrade pretreatment (e.g., DAF, UF). Optimize antiscalant dosing. Adjust CIP frequency. |
CIP frequency is typically every 1–3 months. Alkaline cleaners (NaOH, pH 11–12) target proteins, fats, and sugars; acid cleaners (citric acid or HCl, pH 2–3) target calcium carbonate and metal oxides; peracetic acid addresses severe biofouling. A standard sequence is low-pressure flush, alkaline soak/recirculation, acid soak/recirculation, then rinse to neutral permeate pH, followed by sanitation when food-safety rules require it.
Daily: log pressure, flow, and permeate conductivity. Weekly: inspect pretreatment filters and leaks. Monthly: measure feed SDI, calibrate sensors, and review CIP logs.
Does reverse osmosis remove Cryptosporidium? Yes—over 99.9% removal at 0.0001–0.001 micron pore size, consistent with WHO and EPA microbial-removal expectations for drinking and food-process water.
What is reverse osmosis in food processing? Pressure-driven membrane separation that produces high-purity ingredient water, CIP rinse water, and concentrated juices while supporting FDA, EU, and GB 5749-2022 compliance.
How much does food-processing RO cost? Small systems (1–5 m³/h): $20,000–$50,000 CAPEX and $0.15–$0.30/m³ OPEX. Medium systems (5–50 m³/h): $50,000–$200,000 CAPEX and $0.10–$0.20/m³ OPEX. Payback is commonly 1.5–3 years.
Can RO water serve every food application? It fits most high-purity duties. Bottled water and some brewing recipes may need remineralization or mineral adjustment after RO.
Who this is for / Who should look elsewhere / Next step
This guide is for food-plant owners, process engineers, and utilities managers specifying ingredient, CIP, or rinse-water RO in the 1–200 m³/h range. Look elsewhere if you only need municipal drinking-water polishing without food-contact documentation, or if your duty is seawater desalination rather than food-process water. Next step: complete a raw-water analysis (TDS, hardness, SDI, chlorine, organics), then size recovery, pretreatment, and dual-train needs against the capacity and compliance tables above.
Related Equipment
- HydropureWater’s industrial RO systems for food-grade water — view specifications, capacity range, and technical data
Need a customized solution? Request a free quote with your specific flow rate and pollutant parameters.