Home>Blog>Buyer's Guide>Best Flue Gas Desulfurization for Industrial Use: 2026 Engineering Guide with Efficiency, Cost & Compliance Data
Best Flue Gas Desulfurization for Industrial Use: 2026 Engineering Guide with Efficiency, Cost & Compliance Data
Buyer's Guide
Zhongsheng Engineering Team
Best Flue Gas Desulfurization for Industrial Use: 2025 Engineering Guide with Efficiency, Cost & Compliance Data
For industrial flue gas desulfurization (FGD), wet limestone-gypsum scrubbers dominate with 98%+ SO₂ removal efficiency (e.g., Mitsubishi Heavy Industries' Paradise Fossil Plant, 2006), but dry and semi-dry systems offer lower water usage and simpler byproduct handling. Capital costs range from $50–$200/kW, with wet systems typically at the higher end due to reagent and water requirements. Compliance with EPA NSPS or EU Directive 2010/75/EU depends on fuel sulfur content, plant size, and local emission limits—this guide compares all three FGD types with 2025 engineering data to inform your selection process.
What Is Flue Gas Desulfurization and Why Do Industrial Plants Need It?
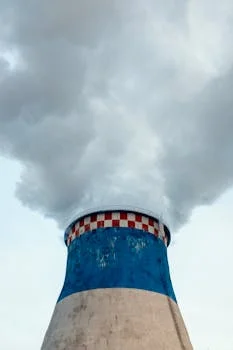
Sulfur dioxide (SO₂) emissions from coal-fired boilers, power plants, and industrial furnaces are a primary contributor to acid rain, respiratory health issues, and severe regulatory penalties (EPA 2024 SO₂ NAAQS: 75 ppb annual average). To mitigate these environmental and financial risks, industrial facilities deploy Flue Gas Desulfurization (FGD) systems, which are engineered solutions designed to remove 90–99% of SO₂ from exhaust gases. These systems operate on fundamental chemical reactions, such as calcium carbonate reacting with SO₂ to form calcium sulfite (CaCO₃ + SO₂ → CaSO₃ + CO₂), preventing the release of harmful pollutants into the atmosphere.
A notable real-world application demonstrating the efficacy of FGD technology is the Paradise Fossil Plant. In 2006, this 1056 MW coal-fired facility successfully achieved 98% SO₂ removal using a single-module wet limestone-gypsum scrubber designed by Mitsubishi Heavy Industries. This case exemplifies the high SO₂ removal efficiency attainable with advanced FGD systems. Broadly, there are three primary types of FGD technologies: wet, dry, and semi-dry. Wet scrubbers typically use a limestone slurry sprayed into the flue gas. Dry scrubbers often employ a lime spray or dry sorbent injection. Semi-dry systems, such as circulating fluidized bed (CFB) reactors, combine aspects of both, using a fine sorbent injected into a semi-dry environment for reaction. Each system offers distinct advantages and trade-offs, making the selection of the best flue gas desulfurization for industrial use a critical engineering decision.
Wet vs. Dry vs. Semi-Dry FGD Systems: Efficiency, Cost, and Maintenance Compared
best flue gas desulfurization for industrial use - Wet vs. Dry vs. Semi-Dry FGD Systems: Efficiency, Cost, and Maintenance Compared
Selecting the optimal Flue Gas Desulfurization (FGD) system requires a detailed comparison of wet, dry, and semi-dry technologies across key operational parameters, directly addressing plant-specific constraints like water availability, budget, and byproduct disposal. Wet limestone-gypsum scrubbers consistently deliver the highest SO₂ removal efficiency, typically ranging from 95–99%, making them ideal for facilities facing stringent emission limits or burning high-sulfur fuels. However, these systems come with higher capital costs, estimated between $150–$200/kW, and incur 1–3% parasitic power loss due to fan power and slurry pumps (per EPA 2023 data).
In contrast, dry scrubbers, often employing spray dryer absorbers, offer SO₂ removal efficiencies of 80–90%. Their primary advantages include lower capital costs, ranging from $50–$100/kW, and negligible water usage, which is critical for water-scarce regions. However, dry systems generally exhibit higher reagent consumption compared to wet systems (DOE 2024 report). Semi-dry systems, such as circulating fluidized bed (CFB) scrubbers, strike a balance, achieving 90–95% SO₂ removal efficiency with capital costs between $80–$130/kW. They consume less water than wet systems but are more complex to operate due to the precise control required for sorbent injection and gas-solid contact.
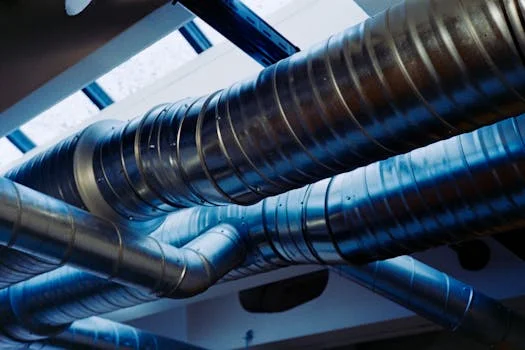
The operational and maintenance (O&M) profiles also vary significantly. Wet scrubbers are prone to scaling and corrosion, demanding regular cleaning and material inspections, especially within the absorber tower and slurry piping. Dry scrubbers, while simpler, can experience reagent clogging in nozzles and require diligent dust collector maintenance, often incorporating high-efficiency dust collection for FGD systems like Zhongsheng’s Pulse Jet Baghouse Dust Collector (ZSDM Series). Semi-dry systems require careful management of sorbent recirculation and particulate removal, balancing removal efficiency with pressure drop.
The following table provides a side-by-side comparison of these critical parameters:
Zhongsheng’s integrated FGD scrubber system for industrial boilers can be tailored to meet these diverse operational requirements, ensuring optimal performance and compliance.
How to Calculate FGD System Costs: Capital, O&M, and ROI for Industrial Plants
Accurately calculating the total cost of ownership for an FGD system is crucial for justifying investment and securing stakeholder approval. Capital costs for FGD systems typically range from $50–$200/kW, with wet systems occupying the higher end due to the complexity of equipment, larger footprint, and extensive material requirements for corrosion resistance. This range encompasses the cost of the main absorber, slurry preparation and handling systems, waste dewatering, flue gas reheat (for wet systems), and associated civil works, electrical infrastructure, and permitting. Dry systems, with their simpler design and less intensive water management, generally fall at the lower end of this capital spectrum.
Operational and Maintenance (O&M) costs are a recurring expense that significantly impacts long-term financial viability. For wet systems, O&M can range from $0.50–$2.00/MWh, primarily driven by reagent consumption (limestone), water usage, power for pumps and fans, and sludge disposal. Dry systems often have lower O&M costs, typically $0.30–$1.50/MWh, though their reagent consumption can be higher due to less efficient utilization, as noted in DOE 2024 benchmarks.
The table below summarizes typical cost ranges:
Cost Category
Wet FGD System
Dry FGD System
Semi-Dry FGD System
Capital Cost ($/kW)
$150–$200
$50–$100
$80–$130
O&M Costs ($/MWh)
$0.50–$2.00
$0.30–$1.50
$0.40–$1.80
Calculating Return on Investment (ROI) for an FGD system involves weighing these costs against the substantial benefits of compliance, which include avoiding significant regulatory penalties, ensuring continued plant operation, and enhancing corporate reputation. Consider a hypothetical 500 MW coal-fired plant operating approximately 7,000 hours annually, generating 3.5 million MWh/year.
* Wet FGD System: Assume a capital cost of $100 million (mid-range for this size) and O&M costs of $1.50/MWh. Annual O&M would be $1.50/MWh * 3,500,000 MWh = $5.25 million.
* Dry FGD System: Assume a capital cost of $40 million and O&M costs of $1.00/MWh. Annual O&M would be $1.00/MWh * 3,500,000 MWh = $3.50 million.
If, for instance, non-compliance with SO₂ emission limits could lead to $10 million in annual fines, operational restrictions, or even plant shutdown, the investment in an FGD system becomes a necessity. For the wet FGD example, the payback period, considering avoided penalties, would be approximately:
Payback Period = Capital Cost / (Avoided Annual Penalties - Annual O&M Costs)
Payback Period = $100,000,000 / ($10,000,000 - $5,250,000) = $100,000,000 / $4,750,000 ≈ 21 years.
While this payback period is long, it underscores that FGD is often a compliance-driven investment rather than a direct profit generator. Net Present Value (NPV) analysis over a 20-year operational lifespan, factoring in a discount rate, would further reveal the long-term financial impact and the value of sustained operation.
Hidden costs also warrant consideration. Byproduct disposal, whether it's landfilled gypsum from wet systems or dry waste from dry/semi-dry systems, can be substantial, depending on local regulations and landfill availability. Additionally, wet systems require dedicated wastewater treatment requirements for FGD systems in the U.S. to manage purge streams, adding another layer of cost. Downtime for maintenance or unforeseen issues also represents lost revenue. Fuel sulfur content directly influences reagent consumption and thus O&M costs: higher sulfur content necessitates more reagent and potentially more robust system design, increasing the cost per kW.
Selecting the Best FGD System for Your Plant: A 2025 Decision Framework
best flue gas desulfurization for industrial use - Selecting the Best FGD System for Your Plant: A 2025 Decision Framework
Choosing the best flue gas desulfurization for industrial use requires a systematic approach, carefully matching technology capabilities with your plant's specific operational context and regulatory environment. This 2025 decision framework guides industrial plant managers, environmental engineers, and procurement teams through a logical selection process.
Step 1: Assess Fuel Type and Sulfur Content. The type of fuel burned (coal, oil, biomass) and its sulfur content are primary drivers. For example, high-sulfur coal (typically >3%) necessitates high SO₂ removal efficiency, strongly favoring wet limestone-gypsum scrubbers. Conversely, facilities burning low-sulfur fuels (<1%) or biomass may find dry or semi-dry systems sufficient and more cost-effective.
Step 2: Evaluate Water Availability. Water scarcity is a critical determinant. Wet systems are water-intensive, requiring 0.5–1.0 L/kWh, which can be a significant operational burden in arid regions. Dry systems, on the other hand, are nearly water-free for primary reaction (<0.1 L/kWh for reagent preparation), making them ideal for locations with limited water resources. Semi-dry systems offer a middle ground, with lower water usage than wet systems (0.1–0.3 L/kWh).
Step 3: Determine Byproduct Disposal Options. The nature and volume of the FGD byproduct impact disposal logistics and costs. Wet systems produce gypsum, which can sometimes be sold for construction materials (e.g., wallboard) if purity is high, or otherwise landfilled. Dry and semi-dry systems generate a dry, powdery waste mixture of calcium sulfite and calcium sulfate, which is typically landfilled or, in some cases, reused in cement production, depending on its composition. Local landfill capacity and costs must be thoroughly investigated.
Step 4: Check Local Emission Limits. Compliance is non-negotiable. Thoroughly review all applicable local, national, and international emission standards, such as EPA New Source Performance Standards (NSPS), EU Industrial Emissions Directive 2010/75/EU, or regional specific limits. For instance, EPA regulations may mandate 90–98% SO₂ removal depending on plant size and fuel characteristics, which might rule out certain dry FGD technologies. Consult detailed 2025 FGD scrubber specifications and compliance requirements to ensure full adherence.
Step 5: Compare Capital and O&M Costs. Utilize the cost tables from earlier sections to conduct a comprehensive financial evaluation. Factor in not only the initial capital investment but also long-term operational expenses, including reagent, power, water, and byproduct disposal.
A simplified decision tree logic would follow:
* If high SO₂ removal efficiency (95%+) is critical due to high-sulfur fuel or strict limits → Consider Wet Scrubber.
* If water is scarce or byproduct disposal simplicity is paramount → Consider Dry Scrubber.
* If moderate SO₂ removal (90-95%) and reduced water usage are priorities → Consider Semi-Dry System.
This framework provides a robust foundation for selecting the optimal FGD technology tailored to your industrial facility's unique requirements.
Compliance Checklist: Meeting EPA, EU, and Global FGD Standards in 2025
Adhering to stringent air quality regulations is paramount for industrial plants operating flue gas desulfurization systems. The regulatory landscape for SO₂ emissions is continuously evolving, demanding robust compliance strategies. For coal-fired plants in the U.S., the EPA New Source Performance Standards (NSPS) under 40 CFR Part 60, Subpart Da, typically mandate 90–98% SO₂ removal, with specific requirements varying based on plant size, construction date, and fuel sulfur content. This high level of SO₂ removal efficiency is critical to avoid substantial fines and operational restrictions.
In the European Union, the Industrial Emissions Directive (IED) 2010/75/EU sets emission limit values (ELVs) for large combustion plants (>50 MW), generally requiring 90–95% SO₂ removal. Similarly, countries like China enforce their own national standards, such as GB 13223-2011, which specifies 90–97% SO₂ removal, with even stricter limits in heavily industrialized regions like Beijing-Tianjin-Hebei. Globally, organizations like the World Bank provide emission guidelines, recommending 90% SO₂ removal for new plants and 80% for existing facilities (per their 2023 update).
To ensure your industrial boiler emission control system meets these diverse requirements, consider the following compliance checklist:
Verify Emission Limits for Your Region: Confirm the exact SO₂ emission limits (e.g., mg/Nm³ or ppm) and removal efficiency percentages mandated by your local, national, and international regulatory bodies.
Select FGD Type Based on Fuel and Water Constraints: Choose a system (wet, dry, or semi-dry) that inherently aligns with your fuel's sulfur content and your facility's water availability, as discussed in the decision framework.
Calculate Required Removal Efficiency: Based on your raw flue gas SO₂ concentration and the legal emission limit, precisely calculate the minimum SO₂ removal efficiency your FGD system must achieve.
Implement Robust Monitoring and Reporting: Install and maintain Continuous Emission Monitoring Systems (CEMS) to accurately track SO₂ emissions, ensuring real-time data for compliance reporting. This is often a mandatory component for large industrial sources.
Manage Byproduct Disposal: Develop a compliant and sustainable plan for FGD byproduct disposal, whether it's gypsum, dry waste, or another material. This includes adherence to hazardous waste regulations if applicable.
Regular Maintenance and Calibration: Establish a rigorous maintenance schedule for all FGD components, including reagent feed systems, scrubbers, and associated high-efficiency dust collection for FGD systems, to ensure continuous optimal performance and prevent non-compliance.
Address Wastewater Treatment: For wet FGD systems, implement appropriate wastewater treatment requirements for FGD systems in the U.S. to ensure discharge meets local effluent standards.
Frequently Asked Questions
best flue gas desulfurization for industrial use - Frequently Asked Questions
What are the main disadvantages of wet FGD systems?
Wet FGD systems, while highly effective (95-99% SO₂ removal), have several disadvantages. They are water-intensive, requiring 0.5–1.0 L/kWh, which can be problematic in water-scarce regions. They also generate a significant volume of wastewater that requires treatment, and produce wet gypsum byproduct that needs dewatering and disposal. wet systems are prone to scaling and corrosion, demanding higher maintenance and material costs, and often require flue gas reheat, increasing parasitic power loss (1–3%).
How does fuel sulfur content impact FGD system choice?
Fuel sulfur content is a primary determinant in FGD system selection. High-sulfur fuels (e.g., >3% sulfur coal) produce large quantities of SO₂, necessitating high-efficiency removal, which typically favors wet limestone-gypsum scrubbers (95-99% removal). For low-sulfur fuels (<1%), dry or semi-dry systems (80-95% removal) may offer sufficient compliance at a lower capital and operational cost, given their simpler operation and reduced water usage. The higher the sulfur content, the more robust and efficient the FGD system needs to be.
Can existing industrial boilers be retrofitted with FGD?
Yes, most existing industrial boilers and power plants can be retrofitted with FGD systems, though the complexity and cost vary significantly. Retrofits often face space constraints, requiring compact designs or external modifications. The integration of new ductwork, reagent handling, and byproduct disposal systems into an operational plant can be challenging. While capital costs for retrofits can be higher than for new construction, it is a common solution to meet updated emission standards without replacing the entire boiler.
What are the typical maintenance intervals for different FGD types?
Maintenance intervals vary by FGD type and operational intensity. Wet scrubbers often require daily checks for scaling and pH, with major inspections for corrosion and erosion every 1–2 years. Reagent feed systems need regular calibration. Dry scrubbers generally have simpler maintenance, focusing on nozzle integrity and baghouse filter replacement (every 2–5 years for bags) in high-efficiency dust collection for FGD systems. Semi-dry systems require regular monitoring of sorbent injection and recirculation, with component inspections typically annually. Predictive maintenance technologies are increasingly used to optimize these schedules.
What is the role of continuous emission monitoring systems (CEMS) in FGD compliance?
Continuous Emission Monitoring Systems (CEMS) are critical for demonstrating ongoing FGD compliance. CEMS provide real-time data on SO₂ concentrations in the flue gas both before and after the FGD system, allowing operators to monitor removal efficiency and immediately detect any excursions above regulatory limits. This data is essential for reporting to environmental agencies (e.g., EPA, EU authorities) and for optimizing FGD performance. CEMS ensure transparency, accountability, and help facilities avoid penalties by providing verifiable proof of compliance.
Our team of wastewater treatment engineers has over 15 years of experience designing and manufacturing DAF systems, MBR bioreactors, and packaged treatment plants for clients in 30+ countries worldwide.