Industrial Wastewater Treatment in Malaysia
Industrial wastewater treatment in Malaysia must meet DOE Standard A or B limits under the 2009 Industrial Effluent Regulations. Standard A BOD5 is 20 mg/L at 20°C with COD 80 mg/L for other industries. Standard B BOD5 is often cited at 50 mg/L; the DOE Guide extract lists 40 mg/L with COD 200 mg/L. CAPEX spans about RM 0.1–3.0 million.
Standard A applies to listed inland catchments. Standard B applies to other inland waters and Malaysian waters. Core parameters remain BOD5 at 20°C, COD, suspended solids (SS), oil and grease, pH, and listed metals. Technology choice, hydraulic capacity, and total cost of ownership decide whether a plant stays compliant under peak load.
The same 2009 Regulations still govern industrial effluent discharge. Plants that need an industrial waste discharge permit in malaysia should confirm Standard A versus B by discharge location before locking equipment ratings. Earlier industry reporting cited 18% non-compliance among inspected facilities in 2023, with average fines around RM 50,000 per violation. One Johor palm oil mill example in the source material paid RM 250,000 after TSS exceedances when a 150 m³/h DAF faced about 200 m³/h POME flow.
| Parameter | Unit | Standard A (Inland Waters) | Standard B (Coastal Waters) | Typical Palm Oil POME (Raw) | Typical Semiconductor Effluent (Post-Treatment) | Typical Food Processing Effluent (Pre-Treatment) |
|---|---|---|---|---|---|---|
| BOD | mg/L | ≤ 20 | ≤ 50 | 20,000 - 60,000 | < 10 | 5,000 - 20,000 |
| COD | mg/L | ≤ 80 | ≤ 200 | 50,000 - 100,000 | < 50 | 10,000 - 40,000 |
| TSS | mg/L | ≤ 50 | ≤ 100 | 18,000 - 40,000 | < 10 | 1,000 - 5,000 |
| Oil & Grease | mg/L | ≤ 5 | ≤ 15 | 2,000 - 5,000 | < 1 | 1,000 - 5,000 |
| pH | - | 6.0 - 9.0 | 6.0 - 9.0 | 4.0 - 5.0 | 6.0 - 8.5 | 5.0 - 9.0 |
| Arsenic (As) | mg/L | ≤ 0.1 | ≤ 0.5 | N/A | < 0.05 | N/A |
| Chromium (Cr) | mg/L | ≤ 0.1 | ≤ 0.5 | N/A | < 0.1 | N/A |
Earlier tables often listed Standard A arsenic at 0.1 mg/L and oil and grease at 5/15 mg/L. The DOE Guide for Investors extract of the 2009 Fifth Schedule sets arsenic at 0.05 mg/L (Standard A) and 0.10 mg/L (Standard B). Oil and grease is 1.0 mg/L (A) and 10 mg/L (B). Standard B pH is 5.5–9.0 in that extract. Hexavalent chromium is 0.05 mg/L for both standards. COD for other industries remains 80 mg/L (A) and 200 mg/L (B) in the Seventh Schedule (DOE Guide for Investors).
Industry-Specific Wastewater Challenges: Palm Oil, Semiconductor & Food Processing
Palm oil mill effluent (POME) in Malaysia typically shows BOD 20,000–60,000 mg/L, COD 50,000–100,000 mg/L, and TSS 18,000–40,000 mg/L at acidic pH about 4–5. Flow is often 2.5–3.5 m³ per ton of fresh fruit bunches (FFB), with higher organic load in peak harvest weeks. Undersized primary solids and oil removal is a frequent compliance failure mode on POME lines.
Semiconductor fabrication wastewater volumes are lower, but toxicity and reuse targets are stricter. Plants must control arsenic, chromium, and fluoride, with fluoride often held below 15 mg/L in discharge planning. TSS is sometimes driven below 1 mg/L when ultrapure recycle is required. CMP slurry and backgrind streams add silica and fine solids that foul filters and membranes if pre-treatment is weak.
Food processing wastewater varies by sub-sector. Meat and poultry streams often carry FOG and TSS at 1,000–5,000 mg/L. Dairy streams are rich in lactose and protein. Beverage streams can push COD into the 5,000–20,000 mg/L range from sugars. Effective food processing wastewater treatment therefore starts with FOG and solids control before biological polishing.
| Industry Sub-sector | Typical BOD (mg/L) | Typical COD (mg/L) | Typical TSS (mg/L) | Typical FOG (mg/L) | Key Contaminants |
|---|---|---|---|---|---|
| Palm Oil Mill (POME) | 20,000 - 60,000 | 50,000 - 100,000 | 18,000 - 40,000 | 2,000 - 5,000 | Organic acids, suspended solids, oils |
| Meat & Poultry Processing | 1,000 - 5,000 | 2,000 - 10,000 | 1,000 - 5,000 | 1,000 - 5,000 | Fats, proteins, blood, suspended solids |
| Dairy Processing | 5,000 - 15,000 | 10,000 - 25,000 | 500 - 2,000 | 50 - 500 | Lactose, proteins, fats, suspended solids |
| Beverage Production | 2,000 - 10,000 | 5,000 - 20,000 | 200 - 1,000 | 10 - 100 | Sugars, organic acids, suspended solids |
| Semiconductor Fab | < 10 | < 50 | < 10 (often < 1 for reuse) | < 1 | Heavy metals, fluorides, etchants, suspended solids (silica, silicon) |
DAF vs. MBR vs. Chemical Dosing: Engineering Specs, Removal Efficiencies & Use-Case Matching
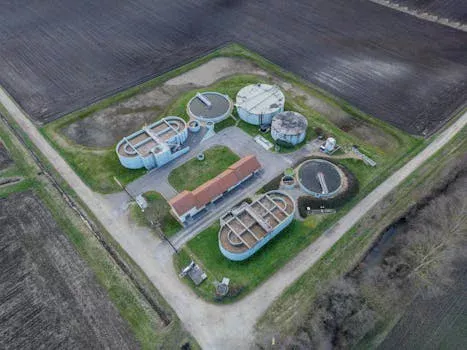
Dissolved air flotation (DAF), membrane bioreactors (MBR), and chemical dosing solve different Malaysian industrial loads and should not be treated as interchangeable. DAF units such as HydropureWater DAF packages commonly cover 4–300 m³/h. TSS removal is about 92–97% and FOG removal about 95–99% under proper chemical conditioning. Footprint is typically about 1.5–2.5 m² per m³/h. DAF fits POME primary treatment and high-FOG food plants. It is only a bulk solids step ahead of metal polishing in fabs.
MBR systems such as HydropureWater DF units use membranes around 0.1 μm pore size. They can deliver COD removal about 95–98% and BOD removal about 98–99% when biology is stable. Footprint is often about 0.5–1.0 m² per m³/h, which helps tight sites and reuse schemes. High FOG or TSS raises fouling risk, so DAF or clarification usually comes first. For effluent quality detail, see MBR Effluent Quality Explained.
Chemical dosing is required for pH control and dissolved metal precipitation. Automated packages typically dose coagulants such as PAC at about 5–50 mg/L and polyacrylamide at about 0.5–5 mg/L, set by jar tests on the actual wastewater. Semiconductor lines rely on controlled pH and precipitants for arsenic and chromium that physical flotation alone cannot remove. Many trains combine dosing with DAF or MBR, sometimes after pre-treatment with multi-media filters.
| Technology | Primary Application | Typical Flow Rate (m³/h) | TSS Removal (%) | BOD/COD Removal (%) | FOG Removal (%) | Footprint (m²/m³/h) | Key Advantages | Key Limitations |
|---|---|---|---|---|---|---|---|---|
| DAF (Dissolved Air Flotation) | Palm Oil, Food Processing (High TSS/FOG) | 4 - 300 | 92 - 97 | 30 - 60 (pre-treatment) | 95 - 99 | 1.5 - 2.5 | Effective for solids & oils, relatively low CAPEX | Limited BOD/COD reduction, sludge generation |
| MBR (Membrane Bioreactor) | Semiconductor, Reuse Applications, High BOD/COD | 0.1 - 200 (m³/day) | > 99 | 95 - 98 | N/A (fouling risk) | 0.5 - 1.0 | Excellent effluent quality, compact footprint | Higher OPEX (energy), membrane fouling risk, higher CAPEX |
| Chemical Dosing | pH Adjustment, Heavy Metal Precipitation, Coagulation/Flocculation | Variable | Dependent on coagulant/flocculant | Dependent on process | N/A | Minimal | Targeted removal, essential for specific contaminants | Chemical costs, sludge generation, requires precise control |
Cost Breakdown: CAPEX, OPEX and ROI for Industrial Systems
For industrial wastewater treatment in Malaysia, DAF CAPEX commonly ranges from RM 500,000 to RM 2,000,000 for about 100–300 m³/h including installation and basic automation. MBR packages often run RM 800,000 to RM 3,000,000 for about 50–200 m³/day because membranes and biology are integrated. Automated chemical dosing usually sits between RM 100,000 and RM 500,000, depending on points of application and control hardware.
OPEX is dominated by energy, chemicals, sludge handling, and membrane replacement. DAF energy is typically about 0.2–0.5 kWh/m³ treated. MBR energy is typically about 0.8–1.5 kWh/m³ with aeration and recycle pumping. PAC often costs about RM 2,000–5,000 per ton, and polyacrylamide about RM 10,000–20,000 per ton, subject to local supply contracts. MBR membrane replacement is often budgeted around RM 500–1,000/m² every 5–7 years, or about RM 70–140/m²/year when amortized.
A palm oil mill at about 60 t FFB/h can generate roughly 150–210 m³/h POME. Avoided fines alone can reach about RM 120,000/year in the worked example used here. A 200–250 m³/h DAF around RM 1.5 million then shows a fine-only payback near 12.5 years, before any reuse credit. Smaller or decentralized flows may also evaluate an Underground Package Sewage Treatment Plant (WSZ Series) where sewage or low-strength mixed effluent is the duty, not high-strength POME.
What drives semiconductor fab treatment costs?
Semiconductor fab wastewater cost is driven by metal precipitation chemistry, ultra-low TSS polishing, and membrane or filter replacement under silica and fluoride load. Ultrapure water piping brand choices affect UPW distribution OPEX. The treatment train cost is set by reagent use, sludge classification, and reuse recovery rate at the stated flow. Long-term spend tracks chemical dose stability and membrane cleaning frequency more than civil footprint alone.
What is blowdown recovery CAPEX and OPEX?
Cooling tower blowdown recovery CAPEX and OPEX scale with TDS, silica, and the recovery target of the reuse loop. Softening, reverse osmosis, or precipitation each add energy and waste brine handling. Cost those items per m³ recovered at the site power tariff. For Malaysian plants, treat blowdown recovery as a separate water-reuse project from DOE industrial effluent compliance. Then compare avoided make-up water against membrane and disposal cost.
| System Type | Capacity Range | Estimated CAPEX (RM) | Estimated OPEX (kWh/m³) | Typical Chemical Costs (RM/ton) | Membrane Replacement (MBR Only) (RM/m²/year) |
|---|---|---|---|---|---|
| DAF | 100 - 300 m³/h | 500,000 - 2,000,000 | 0.2 - 0.5 | N/A (sludge disposal) | N/A |
| MBR | 50 - 200 m³/day | 800,000 - 3,000,000 | 0.8 - 1.5 | N/A (sludge disposal) | 70 - 140 (amortized) |
| Chemical Dosing | Variable | 100,000 - 500,000 | < 0.1 (pump energy) | 20 - 100 (depending on chemicals) | N/A |
Equipment Selection Checklist to Avoid Underspecification
Reliable equipment selection for Malaysian industrial effluent rests on measured wastewater data, peak hydraulic sizing, and proof testing before purchase. The checklist below is the decision sequence plant engineers and EPC teams should complete.
1. Characterize wastewater. Measure average and peak flow in m³/h, then run BOD5, COD, TSS, oil and grease, pH, and industry metals. Record seasonal POME swings or batch food discharges so the design basis includes variability.
2. Match technology to contaminants. Use DAF for high TSS and FOG. Use MBR when reuse or very low BOD/COD is required after adequate pre-treatment. Use chemical dosing for dissolved metals and tight pH control.
3. Size for peak flow plus buffer. Rate equipment on peak flow with at least 20% spare capacity. A POME peak of 200 m³/h therefore needs about 240 m³/h DAF capacity, not a 150 m³/h average-duty unit.
4. Validate with pilot or jar tests. Run jar tests for coagulant dose, bench DAF checks for float quality, and MBR pilots for fouling rate before freezing the datasheet.
5. Budget total cost of ownership. Include energy, chemicals, sludge disposal, spare membranes, lab testing, and DOE reporting in the OPEX model, not CAPEX alone.
| Selection Step | Key Action Items | Deliverables/Outcomes |
|---|---|---|
| 1. Wastewater Characterization | Measure flow rates (peak/average), conduct lab tests (BOD, COD, TSS, pH, metals), identify variability | Detailed wastewater profile report |
| 2. Technology Matching | Align contaminant profile with DAF, MBR, or chemical dosing strengths | Preliminary technology selection |
| 3. System Sizing | Calculate peak flow + 20% buffer for chosen technology | Required system capacity (m³/h or m³/day) |
| 4. Pilot Testing | Perform jar tests, membrane fouling tests, or bench-scale DAF tests | Optimized operating parameters, validated performance |
| 5. Total Cost & Compliance Budgeting | Estimate CAPEX, OPEX, maintenance, and monitoring costs | Comprehensive budget, ROI projection |
Who this is for: palm oil mills, semiconductor fabs, and food plants in Malaysia that must meet DOE Standard A/B limits and need CAPEX/OPEX clarity before purchase. Who should look elsewhere: buyers seeking only municipal sewage package plants with no industrial contaminant load, or projects outside Malaysian DOE jurisdiction. Next step: send measured peak flow, BOD/COD/TSS/FOG, and discharge standard (A or B) for a sized DAF, MBR, or dosing proposal.
Frequently Asked Questions
What are the DOE Malaysia industrial effluent limits?
DOE limits still come from the Environmental Quality (Industrial Effluent) Regulations 2009. Standard A planning values are BOD5 ≤ 20 mg/L at 20°C, COD ≤ 80 mg/L for most other industries, and SS ≤ 50 mg/L. Standard B is often summarized as BOD5 ≤ 50 mg/L; the DOE Guide extract lists 40 mg/L, with COD ≤ 200 mg/L and SS ≤ 100 mg/L. Confirm metals and oil and grease on the Fifth Schedule for your outfall.
How much does a DAF cost for a 60 t FFB/h palm oil mill?
A mill at about 60 t FFB/h typically produces roughly 150–210 m³/h POME and needs a DAF near 200–250 m³/h. Budget CAPEX is commonly about RM 1.2–1.8 million for equipment, installation, civil works, and basic automation under Malaysian project conditions. Final price still depends on chemical conditioning scope, sludge handling, and whether polishing biology is included downstream.
Can MBR systems handle high-FOG food wastewater?
MBR is a poor first-stage choice when FOG is typically above about 50 mg/L in raw food wastewater. FOG accelerates membrane fouling and raises cleaning and replacement cost. Use DAF or equivalent FOG/TSS removal first, then apply MBR only if reuse quality or very low BOD/COD is required after pre-treatment.
What are energy costs for a 100 m³/h MBR in Malaysia?
At about 1 kWh/m³ and RM 0.50/kWh, a 100 m³/h MBR running 8,000 h/year costs about RM 400,000/year in energy alone. Earlier FAQ text stated about RM 40,000 using the same unit rates; that product understates the multiplication by ten. Recalculate with your tariff and operating hours inside the 0.8–1.5 kWh/m³ band.
How do I choose between DAF and chemical dosing for metals?
DAF removes suspended solids and free FOG; it does not remove dissolved arsenic, chromium, or similar metals by itself. Chemical dosing with pH control and precipitants converts dissolved metals to solids, which then settle or float for separation. For fab wastewater, specify dosing and solids capture together, and use DAF only where particulate or oily solids are also present.
Related Equipment
The following HydropureWater products are engineered for the wastewater challenges discussed above:
- DAF systems for high-efficiency TSS and FOG removal in palm oil and food processing wastewater — view specifications, capacity range, and technical data
- MBR systems for near-reuse-quality effluent in semiconductor and municipal applications — view specifications, capacity range, and technical data
- Automated chemical dosing for pH adjustment and heavy metal precipitation in industrial effluent — view specifications, capacity range, and technical data
Need a customized solution? Request a free quote with your specific flow rate and pollutant parameters.