Solvent Wastewater Treatment Cost 2026: Full CAPEX/OPEX Breakdown, Tech Comparison & ROI Calculator
Solvent wastewater treatment cost in 2026 typically ranges from $200K–$5M in CAPEX and $0.50–$3.00/m³ in OPEX, depending on capacity, technology, and effluent limits. A 100 m³/day MBR system often costs about $1.2M upfront with roughly $0.80/m³ OPEX. A DAF train of the same capacity is nearer $500K CAPEX but about $1.50/m³ OPEX because chemical and sludge disposal fees rise. Key drivers remain solvent recovery potential, VOC limits such as <1 mg/L, and energy use of 0.8–1.2 kWh/m³ on many MBR designs, which can cut sludge disposal volume 30–50% versus conventional trains.
One chemical plant recently faced a $750,000 fine for exceeding permitted VOC discharge limits. That scale of penalty is now common enough that plant engineers and procurement teams treat treatment cost for solvent wastewater as a compliance and cash-flow decision, not a side budget line. Beyond fines, exceedances can force curtailments, delayed permits, and higher insurance scrutiny. Mapping capital, operating, and recovery cash flows before selecting equipment is the practical way to keep both regulators and finance aligned.
What Does Solvent Wastewater Treatment Cost in 2026?
Industrial solvent wastewater treatment typically costs $200,000–$5 million in CAPEX and $0.50–$3.00 per m³ in OPEX at common solvent loads. At 100 m³/day, MBR packages near $1.2M with about $0.80/m³ OPEX, while DAF packages near $500K CAPEX and about $1.50/m³ OPEX. Hybrid DAF+MBR trains fall between those bands when FOG, TSS, and dissolved VOCs all face tight limits.
Discharge rules continue to tighten. EU Industrial Emissions Directive (IED) 2024 guidance has pushed many chemical plants toward VOC limits below 1 mg/L, which usually means biological polishing or membrane barriers rather than flotation alone. Similar pressure shows up in North American and Asian permits, so VOC wastewater treatment budgets now include tertiary steps that were optional five years ago.
Sludge disposal fees for solvent-contaminated solids keep rising about 8–12% per year in many industrial corridors. Hazardous solvent sludge often costs 2–3 times non-hazardous disposal. That line item can dominate OPEX on chemical-heavy DAF trains. Water reuse mandates also add roughly 10–30% to CAPEX when reverse osmosis or equivalent polishers are required for process-water recycle in pharma, electronics, and specialty chemicals.
Non-compliance cost still dwarfs many equipment quotes. Facilities that delay upgrades after a $500K–$750K fine cycle often spend more on emergency rental treatment and overtime than a planned MBR or hybrid install would have required. Most plants we size for solvent streams therefore model avoided fines and avoided virgin-solvent purchases alongside the equipment quote.
What Is a Water Treatment Plant Cost Breakdown?
A water treatment plant cost breakdown for solvent wastewater separates CAPEX, OPEX, and hidden integration costs so owners can compare bids on equal scope. Equipment usually dominates CAPEX; energy, chemicals, and hazardous sludge drive OPEX. Hidden costs such as membrane change-outs, odor control, and solvent-recovery tie-ins often decide whether a low bid stays low after year two.
Capital Expenditure (CAPEX) Breakdown:
- Equipment: Typically accounts for 60–70% of the total CAPEX, covering primary, secondary, and tertiary treatment units, pumps, controls, and instrumentation.
- Civil Works: Involves site preparation, foundations, tanks, and buildings, representing 15–20% of CAPEX.
- Permitting & Engineering: Essential for regulatory approval and system design, usually 5–10% of the initial investment.
- Installation & Commissioning: The physical setup and startup of the system, comprising 10–15% of CAPEX.
Operational Expenditure (OPEX) Breakdown:
- Energy Consumption: Drives 30–40% of OPEX, primarily for pumps, blowers, and mixers.
- Chemicals: Coagulants, flocculants, pH adjusters, and disinfectants can account for 20–30% of OPEX, heavily influenced by influent solvent concentration.
- Sludge Disposal: A significant factor at 15–25% of OPEX, especially for hazardous solvent-contaminated sludge.
- Labor: Staffing for operation, monitoring, and routine tasks typically consumes 10–15% of OPEX.
- Maintenance & Spare Parts: Scheduled upkeep and replacement parts account for 5–10% of OPEX.
Hidden Costs: Beyond the direct CAPEX and OPEX, facilities must consider hidden costs. These include potential downtime for membrane replacement in MBR systems, the cost of odor control for DAF systems handling high-VOC wastewater, and the complex integration expenses for solvent recovery systems. These factors, if not planned for, can significantly inflate the overall treatment bill for solvent wastewater.
Cost per cubic meter also tracks influent strength. Treating concentrated solvent wastewater at about 1,000 mg/L COD needs more chemical dosing and aeration energy than a dilute 100 mg/L COD stream. That gap shows up immediately in monthly chemical and power invoices.
Here’s a breakdown of typical OPEX ranges by system capacity:
| System Capacity (m³/day) | Typical OPEX Range ($/m³) | Key Drivers |
|---|---|---|
| 10 | $2.50–$4.00 | Higher labor intensity per volume, less economies of scale for chemicals/energy. |
| 100 | $1.00–$2.00 | Balanced scale, some automation benefits, moderate chemical/energy use. |
| 1,000 | $0.50–$1.20 | Significant economies of scale, high automation, optimized energy use, bulk chemical purchasing. |
These figures, adapted from industry cost surveys and HydropureWater field observations, show clear economies of scale. Larger systems usually achieve lower per-unit treatment costs through automation, bulk chemical purchasing, and steadier blower loading. For regional municipal and industrial benchmarks outside solvent plants, see also our notes on capex and opex patterns in other markets.
How Should a Wastewater CAPEX Calculator Be Used?
A wastewater CAPEX calculator is useful only when scope, duty, and recovery credits are stated in the same units. Enter design flow in m³/day, peak COD and VOC concentrations, target effluent limits, sludge classification, and whether recovered solvent offsets virgin purchases. Without those inputs, unit-cost comparisons between MBR, DAF, and hybrid bids stay misleading.
Most plants we size for solvent service start the calculator at nameplate flow, then stress-test ±20% hydraulic peaks and ±30% COD spikes. That range usually exposes whether a lower-CAPEX DAF needs a second-stage biological polish, or whether an MBR-plus-RO package pays back through reuse and lower sludge tickets. Keep labor and spare-parts lines visible; they are easy to omit and hard to absorb later.
Use the calculator to rank options, not to freeze a purchase order. Final quotes still need site civil works, power availability, and permit language. When solvent recovery is part of the case, model both sale price and internal reuse value, because reuse often carries the higher avoided cost.
MBR vs. DAF vs. Hybrid Systems: Cost and Performance Comparison for Solvent Wastewater
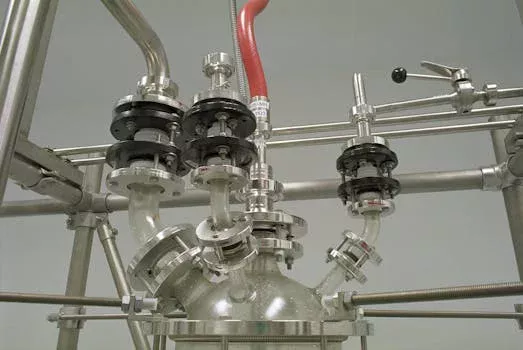
Technology choice for solvent wastewater balances capital, operating cost, and the effluent quality the permit actually requires. Membrane Bioreactor (MBR), Dissolved Air Flotation (DAF), and hybrid DAF+MBR trains each fit different solvent and FOG profiles. Matching the train to the load avoids buying tertiary polishers after the fact.
MBR Systems: MBR systems for solvent wastewater treatment integrate biological treatment with membrane filtration, offering high effluent quality. Their CAPEX typically ranges from $10K–$20K per m³/day of capacity. OPEX averages $0.80–$1.50/m³, driven by membrane replacement cycles and aeration energy. MBRs achieve 95–99% COD removal and are highly effective for reducing VOCs. With integrated reverse osmosis (RO) systems, MBRs can enable 70–90% solvent recovery potential, making them attractive for high-value solvent streams. MBR effluent quality often meets stringent reuse standards, as detailed in our article on MBR effluent quality and reuse standards.
DAF Systems: DAF systems for solvent and FOG removal are primarily physical-chemical separation processes, ideal for pre-treatment of wastewater with high concentrations of oils, greases, and suspended solids, including immiscible solvents. Their CAPEX is generally lower, at $5K–$10K per m³/day. However, OPEX is often higher, ranging from $1.20–$2.50/m³, largely due to significant chemical consumption (coagulants, flocculants) and the associated hazardous sludge disposal cost. DAF systems achieve 90–95% FOG and solvent removal but typically require downstream biological or advanced polishing for compliance with strict discharge limits.
Hybrid Systems (DAF + MBR): Combining DAF’s robust pre-treatment capabilities with MBR’s advanced biological and filtration performance offers a practical solution for complex solvent wastewater. CAPEX for hybrid systems can range from $12K–$25K per m³/day, reflecting the integration of two technologies. OPEX is competitive at $0.90–$1.80/m³, benefiting from DAF’s ability to offload high solids and FOG from the MBR, extending membrane life and reducing MBR operating costs. These systems can achieve exceptionally high effluent quality (TSS <1 mg/L, COD <30 mg/L), making them suitable for direct discharge or advanced water reuse applications, particularly for challenging solvent and heavy metal wastewater treatment solutions.
Here is a side-by-side comparison:
| Feature | MBR Systems | DAF Systems | Hybrid Systems (DAF + MBR) |
|---|---|---|---|
| Primary Application | High-quality effluent, biological treatment, solvent recovery | Pre-treatment, FOG/TSS/immiscible solvent removal | Complex wastewater, high FOG/TSS + stringent effluent/recovery |
| CAPEX ($/m³/day) | $10K–$20K | $5K–$10K | $12K–$25K |
| OPEX ($/m³) | $0.80–$1.50 | $1.20–$2.50 | $0.90–$1.80 |
| COD Removal Efficiency | 95–99% | Up to 95% (for FOG/TSS, less for dissolved COD) | 97–99.5% |
| Solvent Recovery Potential | 70–90% (with integrated RO) | Limited (pre-treatment only) | 80–95% (with integrated RO) |
| Energy Consumption (kWh/m³) | 0.8–1.2 | 0.3–0.5 | 0.6–1.0 |
| Sludge Disposal Costs | $50–$100/ton (less volume) | $150–$300/ton (higher volume, often hazardous) | $80–$180/ton (reduced volume compared to standalone DAF) |
| Footprint Reduction | 60% smaller than conventional activated sludge (CAS) (Top 1) | 30% smaller than conventional clarifiers | Efficient, but larger than standalone MBR |
For facilities prioritizing high effluent quality, minimal footprint, and solvent recovery, MBR systems for solvent wastewater treatment are often the preferred choice. When high FOG/TSS loads are present and require effective pre-treatment before biological processes, DAF systems for solvent and FOG removal provide a robust solution. Hybrid systems offer a balanced approach, leveraging the strengths of both technologies to tackle complex industrial streams with high efficiency and compliance.
ROI Calculator: Solvent Recovery vs. Treatment Costs
Solvent recovery can change the cash-flow picture of treatment from a pure cost center into a partial value stream. ROI still needs a full operating model, not only solvent sales. Compliance savings and avoided disposal fees often matter more than the recovered-solvent invoice.
The basic ROI formula for solvent recovery is:
ROI = (Annual Solvent Recovery Value - Annual OPEX) / CAPEX
Consider an example: a facility treating 100 m³/day of wastewater containing 500 mg/L acetone. With an MBR system integrated with a solvent recovery unit (e.g., reverse osmosis, distillation), achieving 90% acetone recovery, and assuming a market price of $1.50/kg for recovered acetone.
| Parameter | Value |
|---|---|
| Wastewater Flow Rate | 100 m³/day |
| Acetone Concentration | 500 mg/L (0.5 kg/m³) |
| Annual Acetone in Wastewater | 100 m³/day * 0.5 kg/m³ * 365 days/year = 18,250 kg/year |
| Recovery Efficiency | 90% |
| Recovered Acetone Annually | 18,250 kg/year * 0.90 = 16,425 kg/year |
| Market Value of Acetone | $1.50/kg |
| Annual Solvent Recovery Value | 16,425 kg/year * $1.50/kg = $24,637.50/year |
| Estimated CAPEX (for 100 m³/day MBR with RO) | ~$1.2M |
| Estimated Annual OPEX (for 100 m³/day MBR with RO) | ~$80,000/year (0.80 $/m³ * 100 m³/day * 365 days/year) |
| Net Annual Savings (Recovery Value - OPEX) | $24,637.50 - $80,000 = -$55,362.50 |
| Payback Period | N/A (Negative net savings in this example; this highlights that direct recovery value alone may not justify the investment, but compliance and reduced disposal costs are key) |
Correction in example: The example above demonstrates that direct solvent recovery value alone might not always generate a positive net saving purely from solvent sales, especially for lower concentrations or volumes. However, the true ROI for solvent recovery cost calculations must also factor in avoided purchase costs of virgin solvent, reduced hazardous waste disposal fees, and avoided regulatory fines. If the recovered acetone can be reused internally, the value increases significantly as it offsets virgin material purchases. For example, if the plant previously purchased acetone at $1.50/kg, the annual savings from internal reuse would be $24,637.50, leading to a much better economic outlook.
Typical solvent recovery benchmarks include Acetone at 85–95%, Isopropyl Alcohol (IPA) at 80–90%, and Toluene at 70–85% when using distillation or advanced membrane separation systems, such as those incorporating reverse osmosis (RO) water purification. Acetone market prices can swing from about $1.20–$2.00/kg, so sensitivity cases belong in every ROI sheet. A customizable spreadsheet template is available on request to model plant-specific flows and solvent prices.
How to Reduce Treatment Costs for Solvent Streams: 5 Proven Strategies
Cutting solvent-treatment spend usually starts upstream, then moves to dosing control, sludge volume, energy, and reuse. Plants that only shop for cheaper equipment rarely move the monthly invoice as much as plants that shrink load first. The five tactics below are the ones we see hold up on chemical and specialty-solvent sites.
- Source Control and Waste Minimization: Reducing the volume and concentration of solvent wastewater at its origin is the most effective strategy. Implementing closed-loop rinsing systems, optimizing solvent usage in processes, and segregating waste streams can reduce overall solvent use by 20–30%. This directly translates to savings of $0.20–$0.50/m³ in OPEX by decreasing the load on the treatment plant, thus requiring fewer chemicals and less energy.
- Automation and Smart Control Systems: Deploying automated chemical dosing for solvent wastewater treatment, particularly PLC-controlled systems, can precisely manage chemical additions based on real-time influent quality. This can cut chemical costs by 15–25% by preventing overdosing and optimizing reagent consumption. Our automatic chemical dosing system exemplifies this optimization.
- Sludge Minimization Technologies: Sludge disposal, especially for hazardous solvent-contaminated waste, is a major OPEX driver. MBR systems inherently produce 30–50% less sludge than conventional activated sludge (CAS) systems, significantly reducing hazardous sludge disposal cost by $20–$50/ton. This lower sludge volume reduces transportation and landfilling expenses.
- Energy Optimization: Energy consumption is a substantial portion of wastewater treatment OPEX. Installing variable-frequency drives (VFDs) on high-energy components like blowers and pumps in MBR systems can reduce energy use by 20–30%. Optimizing aeration patterns and pump schedules based on real-time demand also contributes to lower wastewater treatment energy consumption.
- Water Reuse and Recycling: Integrating advanced treatment technologies like reverse osmosis (RO) water purification with MBR systems enables the treated effluent to be reused for non-potable applications or even back into industrial processes. This can reduce freshwater intake by 50–70%, cutting water purchase costs by $0.10–$0.30/m³ and simultaneously decreasing discharge fees. This approach saves money and prepares facilities for tighter water-scarcity rules.
Selection Checklist and Cost Drivers
Selection checklists keep solvent projects from buying the wrong primary unit. Confirm influent COD, VOC speciation, FOG/TSS, and whether sludge will be hazardous before comparing unit CAPEX. Then rank energy (kWh/m³), chemical dose, sludge tickets, recovery potential, and footprint against the permit limit you must hit every day, not only at design average.
- Design flow and peak factor (m³/day), plus COD and VOC peaks with units and temperature basis.
- Permit limit for VOCs, COD, and TSS, including any reuse quality target.
- Whether DAF pre-treatment is required for FOG/immiscible solvents before biology.
- Sludge hazard class and local disposal price ($/ton) for solvent-bearing solids.
- Solvent recovery pathway (RO, distillation) and virgin-solvent avoided-cost assumption.
- Energy tariff and expected aeration/blower load (kWh/m³ at design MLSS).
- Civil, power, and integration scope excluded from vendor skid pricing.
Who this is for: chemical, pharma, electronics, and specialty-solvent plants sizing 10–1,000 m³/day trains and comparing MBR, DAF, or hybrid bids. Who should look elsewhere: sites seeking only municipal sewage cost models without solvents, or buyers who need country-specific civil unit rates alone. Next step: send influent data and permit limits for a scoped budget range via our request a solvent wastewater treatment quote form.
Frequently Asked Questions
What is the average CAPEX for a solvent wastewater treatment plant?
The average CAPEX for a solvent wastewater treatment plant typically ranges from $200,000 to $5 million, driven by capacity, effluent quality, and solvent types. Smaller 10 m³/day plants often land near $200,000–$500,000. Large 1,000 m³/day complexes with recovery can exceed $5 million. MBR, DAF, or hybrid selection changes both equipment share and civil scope inside that band.
How much does it cost to dispose of hazardous solvent sludge?
Hazardous solvent-contaminated sludge disposal commonly costs $150–$300 per ton. That is 2–3 times non-hazardous sludge disposal because of specialized handling, transport, and regulated landfill or incineration rules. MBR trains that cut sludge volume 30–50% versus conventional activated sludge therefore reduce long-term hazardous sludge disposal cost even when unit tipping fees stay high.
Can solvent recovery offset overall treatment costs?
Solvent recovery can offset treatment costs when valuable solvents are reused internally or sold. Direct solvent sales alone may not cover full OPEX at dilute loads, as the acetone example shows. Combined savings from avoided virgin purchases, lower hazardous waste fees, and avoided fines often produce payback in about 1–5 years, depending on concentration, market price, and system efficiency.
What are the primary OPEX drivers for VOC wastewater treatment?
Primary OPEX drivers for VOC wastewater treatment are energy (30–40% for aeration and pumping), chemicals (20–30% for pH, coagulation, and flocculation), and sludge disposal (15–25%, especially hazardous waste). Labor and maintenance fill the remainder. Higher influent VOC levels raise both chemical dose and aeration demand. See also: regional cost benchmarks for wastewater treatment.
How do regulatory changes impact solvent treatment costs?
Tighter VOC discharge limits, such as <1 mg/L, raise treatment costs for solvent wastewater by requiring more advanced treatment trains. That usually means higher CAPEX for membranes or hybrids and higher OPEX from energy, specialty chemicals, and compliance monitoring. Non-compliance fines can exceed $500K–$750K per event, so delayed upgrades often cost more than a planned system.
Further Reading

Explore these in-depth articles on related wastewater treatment topics: