Alarm Management SCADA Wastewater: 2026 Engineering Playbook
A sudden alarm flood—three critical alerts simultaneously—can plunge a wastewater plant into chaos, escalating minor process upsets into costly downtime. Effective alarm management in wastewater SCADA, guided by ISA-18.2 standards, targets fewer than 6 standing alarms per console and a nuisance alarm rate below 10%. Achieving these KPIs directly translates to a 38% reduction in unplanned downtime and an ROI payback period of under 11 months. This playbook provides the engineering toolkit to implement an ISA-18.2 compliant SCADA alarm system, complete with PLC logic, KPI formulas, and a maintenance roadmap.Why Alarm Floods Cost More Than You Think
Unmanaged alarm systems inflate operating costs and safety risks in wastewater treatment. A typical SCADA system generating 150 alarms per 8-hour shift forces operators to spend roughly 2.6 hours of additional time each shift sifting through non-critical alerts. That overhead translates to about ¥45,000 per operator per year in China, based on average industrial technician wages. Overload diminishes operator effectiveness and delays responses to genuine critical events. One missed high-pressure alarm on a clarifier feed line can trigger a tank overflow, fines of ¥180,000 for environmental discharge violations, and up to 6 hours of unplanned downtime for cleanup and recovery. Nuisance alarms—which make up about 70% of all alarms in an unmanaged system—create a "cry wolf" effect that desensitizes operators and raises the chance a real threat gets missed. Cumulative costs of that pattern justify investment in disciplined alarm management.Map Every Alarm to ISA-18.2 KPIs

| ISA-18.2 KPI | Target Value | Calculation Formula | Wastewater Example |
|---|---|---|---|
| Annunciation Rate | < 6 alarms/hour | Total Alarms / Operating Hours | Average alarms per hour at main console |
| Alarm Flood | < 10 alarms in 10 min | Count instances where >10 alarms occur in 10 min | Influent pump trip causing cascade of level/flow alarms |
| Standing Alarms | < 6 active alarms | Average number of unacknowledged alarms | DO < 2 mg/L in aeration basin, unaddressed |
| Nuisance Rate | < 10% | (Chattering + Fleeting + Stale) / Total Alarms | Influent pH > 9, fluctuating rapidly but within spec |
| Priority Distribution | 5% Emergency / 15% High / 80% Low | (Count of Priority X Alarms / Total Alarms) * 100% | Sludge blanket > 2m (High), Motor temp > 60C (Medium) |
| Operator Response Time | < 1 min (High), < 5 min (Medium) | Average time from alarm annunciation to acknowledgement | Response to pump overcurrent (Emergency) |
Build a 4-Level Priority Matrix in Your PLC
A standardized 4-level alarm priority matrix built directly in the PLC keeps alarm behavior consistent and simplifies SCADA integration. Shifting alarm logic closer to the process improves reliability and reduces network latency. The four levels are defined by their potential impact and required operator response:- Emergency: Immediate safety shutdown or catastrophic equipment failure (e.g., pump overcurrent leading to motor damage, toxic gas leak). Requires immediate operator action.
- High: Significant equipment damage or severe process upset within 30 minutes (e.g., high-level tank overflow, critical pump failure). Requires prompt operator action.
- Medium: Process upset requiring attention but not immediate danger (e.g., minor tank level deviation, routine equipment fault). Requires timely operator action.
- Low: Maintenance reminder or minor deviation with no immediate impact (e.g., filter runtime exceeded, non-critical sensor out of calibration). Requires deferred operator action.
// Rung 0: Pump Overcurrent Emergency Alarm
// Description: Activates Emergency alarm if Pump 01 current exceeds 115% FLA

--[PUMP_01_RUN_STATUS]-----------[GRT]------------------[OTE]--
                                / Source A: PUMP_01_CURRENT_AMPS
                                / Source B: 115.0  (115% of FLA for example, assume FLA is 100A for this example)
                                / Destination: ALM_PUMP01_OVERCURRENT_EMERGENCY
| Alarm Priority Level | Definition | Setpoint Band (from Trip Value) | Typical Operator Response Time | Wastewater Example |
|---|---|---|---|---|
| Emergency | Immediate safety shutdown or catastrophic equipment failure | ≤5% | Immediate (<1 min) | Pump motor overcurrent (>115% FLA), toxic gas detected |
| High | Significant equipment damage or severe process upset (<30 min) | 5–15% | Prompt (<5 min) | High tank level (95% full), critical pump failure |
| Medium | Process upset requiring attention, not immediate danger | 15–30% | Timely (<30 min) | Minor tank level deviation (80% full), motor bearing temperature high |
| Low | Maintenance reminder, minor deviation, no immediate impact | >30% or non-process conditions | Deferred (>30 min or next shift) | Filter press run hours exceeded, non-critical sensor calibration due |
Rationalize 1000 Alarms Down to 120 Without Losing Coverage

- Step 1: Export SCADA Alarm List to CSV: Extract the complete list of current SCADA alarms into a spreadsheet. Include alarm tag, setpoint, description, potential cause, and likely consequence. This becomes the analysis baseline.
- Step 2: Score Severity (1-5) × Frequency (1-5): Assign a severity score (1=minor inconvenience, 5=catastrophic event) and a frequency score (1=rare, 5=constant nuisance). Multiply the scores to prioritize. Keep high-severity alarms even when frequency is low, plus the worst nuisance offenders. Retain the top 30% of alarms by score, plus anything deemed essential for safety or critical process control.
- Step 3: Merge Duplicate Setpoints and Consolidate Related Alarms: Eliminate redundant alarms. If a high-flow alarm and a pump run status alarm both signal an inefficient pump, merge them into a single "Pump Available" or "Pump Performance Deviation" alarm. Treat the root cause, not the symptoms.
- Step 4: Define Alarm Attributes: For surviving alarms, set priority (using the 4-level matrix), operator response, suggested corrective action, and suppression conditions.
- Step 5: Implement Changes in PLC/SCADA: Program the revised alarm logic into the PLCs and update the SCADA system so both stay aligned.
- Step 6: Operator Training and Review: Train operators on the new alarm philosophy and schedule regular reviews that catch any new nuisance alarms.
Stop Nuisance Alarms with Deadband, Delay and State-Based Suppression
Cutting nuisance alarms rebuilds operator trust and reduces fatigue. Field-tested tuning of deadband, on-delay, and state-based suppression removes up to 73% of chattering and fleeting alarms. These techniques keep momentary fluctuations or expected process conditions from triggering alerts.- Deadband: Applies hysteresis to analog alarms so they stop toggling around the setpoint. Once an alarm triggers, the process variable must return below setpoint minus the deadband value before the alarm clears.
- On-Delay: Adds a time delay before an alarm annunciates. This filters transients like startup spikes or brief sensor glitches, so only persistent abnormal conditions raise alarms.
- State-Based Suppression: Temporarily disables or downgrades alarms when the process is in a known state where the alarm condition is expected or irrelevant, so no actionable information is lost.
| Nuisance Alarm Technique | Recommended Parameter | Wastewater Application Example |
|---|---|---|
| Deadband | 0.5% of span for flow, 1% for pressure, 2% for level | A high-level alarm (e.g., 85%) on a clarifier tank clears only when level drops below 83%, preventing rapid on/off toggling near 85%. |
| On-Delay | 5 s for pumps, 15 s for mixers, 30 s for slow-responding processes (e.g., pH) | A pump overcurrent alarm activates only if the current remains above the setpoint for 5 seconds, ignoring startup current spikes. |
| State-Based Suppression | Use XOR logic with equipment status bits (e.g., valve position, pump mode) | Suppress a 'low flow' alarm on a pump discharge line if the upstream inlet valve is commanded closed (e.g., `IF (INLET_VALVE_CLOSED_BIT XOR ALARM_LOW_FLOW) THEN SUPPRESS_ALARM`). |
Maintain Your Alarm System for <0.5 % Annual Drift
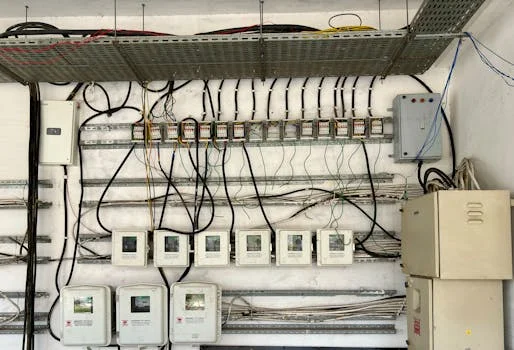
- Quarterly:
- Verify all alarm setpoints against current P&ID drawings and process requirements.
- Recalibrate critical sensors impacting alarm generation (e.g., level, flow, pressure, pH, DO).
- Export and review ISA KPI reports to spot emerging trends in alarm rates or priority distribution.
- Semi-annual:
- Conduct refresher training for operators on the 10 most frequent or highest-priority alarms. Use VR headsets for realistic scenario simulation when available.
- Review and update alarm descriptions and corrective actions based on operator feedback and process changes.
- Audit state-based suppression logic so it still aligns with current operational modes and interlocks.
- Annual:
- Rerun a full alarm rationalization workshop if ISA KPIs exceed 110% of their target values, indicating significant drift.
- Perform a comprehensive review of the alarm philosophy document, folding in lessons learned and new process technologies (e.g., a new MBR system with integrated DO control).
- Evaluate overall alarm-system effectiveness in preventing unplanned downtime and identify further optimization opportunities.
Who This Is For and Next Step
This playbook fits plant engineers and integrators at municipal or industrial wastewater plants running 10–200 MLD who are losing shifts to nuisance alarms, preparing for an ISA-18.2 audit, or planning a SCADA upgrade. Plants already under 6 alarms/hour with a documented rationalization cycle should look elsewhere—deeper optimization here would be marginal. Send your current alarm KPI snapshot and PLC platform to HydroPure Water for a sizing review and a recommended rationalization scope: request a quote.Frequently Asked Questions
How many alarms should a 50 MLD plant have?
An ISA-18.2 compliant 50 MLD wastewater plant should target an average of 1 alarm per 150 control tags, giving roughly 100-200 active alarms depending on system complexity. The focus is on actionable, unique alarms, with an annunciation rate held below 6 alarms per hour.
What PLC code reduces alarm floods?
PLC code reduces alarm floods through on-delays, deadbands, and state-based suppression. An on-delay timer blocks transient signals, while a deadband prevents chattering. State-based suppression logic, often using instructions like `IF pump_OFF THEN suppress_low_flow_alarm`, keeps alarms off equipment in an expected state.
How is alarm priority assigned rather than calculated?
Alarm priority is assigned from a predefined matrix, not calculated as a weight. The ISA-18.2 standard uses categories such as Emergency, High, Medium, and Low. Each category is defined by potential consequence (safety, environmental, equipment damage, production loss) and the required operator response time. A common initial ranking method during rationalization is a Severity × Frequency matrix.
What is the typical ROI of an ISA-18.2 alarm rationalization?
An ISA-18.2 rationalization that drives the nuisance rate below 10% and the annunciation rate below 6 alarms/hour typically yields a 38% reduction in unplanned downtime and ROI payback within 11 months. Savings come from avoided discharge fines, fewer emergency callouts, and reduced operator overtime.
How do you measure annual alarm system drift?
Annual drift is measured by comparing current ISA-18.2 KPI values (annunciation rate, nuisance rate, priority distribution, standing alarms) against their target values. Drift above 110% of target on any KPI is the trigger to rerun a full rationalization workshop and refresh the alarm philosophy document.
Related Equipment
- PLC-controlled chemical dosing skid — view specifications, capacity range, and technical data
- MBR system with integrated DO control — view specifications, capacity range, and technical data
Need a customized solution? Request a free quote with your specific flow rate and pollutant parameters.