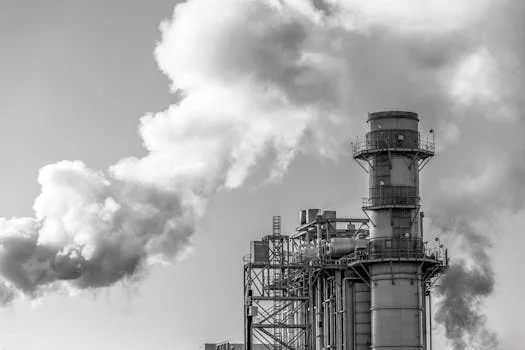
A plant manager at a chemical processing facility stared at a notice from the environmental agency: a significant fine for exceeding SO₂ and particulate matter limits, stemming directly from an aging, underperforming air pollution control system. The choice between upgrading the existing dry scrubber or investing in a new wet scrubber suddenly became a critical, high-stakes decision, fraught with technical complexities, budget constraints, and the urgent need for robust, long-term compliance.
Wet scrubbers and dry scrubbers both remove air pollutants, but their efficiency, costs, and suitability vary significantly. Wet scrubbers achieve 95–99% removal of particulate matter and acidic gases (e.g., SO₂, HCl) by using liquid reagents, making them ideal for high-temperature, high-humidity exhaust streams. Dry scrubbers, which use dry reagents or sorbents, offer 80–90% removal efficiency with lower energy consumption and no wastewater production, but require precise gas stream conditions. Key trade-offs include capital costs ($500K–$5M for wet vs $300K–$3M for dry), operating costs ($0.50–$2.00 per 1,000 m³ for wet vs $0.30–$1.20 for dry), and footprint (wet scrubbers require 2–3× more space). Use this guide’s decision matrix to match your facility’s pollutant profile, flow rate, and budget to the optimal system.
How Wet and Dry Scrubbers Work: Mechanisms and Process Flows
Wet scrubbers remove pollutants by facilitating intimate gas-liquid contact, allowing soluble gases and particulate matter to transfer from the exhaust stream into a scrubbing liquid. This process typically occurs in spray towers, packed beds, or venturi scrubbers, where the scrubbing liquid (often water or a chemical reagent solution like lime slurry) is atomized or spread over a large surface area. Gas-liquid contact is optimized with liquid-to-gas ratios (L/G) of 0.5–2.0 L/m³, as recommended by EPA AP-42 guidelines, ensuring efficient absorption and reaction. For instance, in a spray tower, liquid droplets capture pollutants; in a packed bed, gas flows through a wetted packing material. A typical wet scrubber process involves the exhaust gas entering the scrubber, contacting the scrubbing liquid, and then exiting through a demister to remove entrained droplets. The spent scrubbing liquid is then collected for treatment or disposal.
Dry scrubbers, conversely, use dry reagents or sorbents to neutralize acidic gases without generating a wet waste stream. The primary mechanisms include dry sorbent injection (DSI) and spray dryer absorption (SDA). In DSI, a powdered sorbent (e.g., hydrated lime, sodium bicarbonate) is injected directly into the hot flue gas duct, reacting with acidic gases like SO₂ and HCl to form dry solid byproducts. The reaction byproducts and entrained particulates are then collected by a downstream particulate control device, such as a high-efficiency baghouse for dry scrubber PM control. Spray dryer absorption involves atomizing a fine mist of alkaline slurry (e.g., lime slurry) into a reaction chamber where the hot flue gas rapidly evaporates the water, leaving dry reagent particles that react with pollutants. Stoichiometric ratios, such as 1.1–1.5 moles of Ca(OH)₂ per mole of SO₂, are critical for achieving desired removal efficiencies in dry scrubbing systems.
Pressure drop, a measure of resistance to gas flow, significantly impacts fan energy costs; wet scrubbers typically exhibit a pressure drop of 5–25 cm H₂O, while dry scrubbers generally have a lower pressure drop of 1–5 cm H₂O (Mach Engineering, 2023). This difference is largely due to the energy required to overcome the resistance of liquid and packing material in wet systems. Temperature and humidity also dictate system suitability: wet scrubbers can handle exhaust streams ranging from 100–1,000°C and 10–100% humidity, making them versatile for high-temperature applications. Dry scrubbers, however, require more controlled conditions, typically operating below 200°C and with less than 10% humidity to prevent caking and ensure efficient sorbent reaction (DoverMEI, 2021).
| Parameter | Wet Scrubber | Dry Scrubber |
|---|---|---|
| Pollutant Capture Mechanism | Gas-liquid contact (absorption, impaction) | Dry sorbent reaction (adsorption, chemical reaction) |
| Liquid-to-Gas Ratio (L/G) | 0.5–2.0 L/m³ (EPA AP-42) | N/A (no liquid waste) |
| Stoichiometric Ratio (Sorbent) | N/A (liquid reagent) | 1.1–1.5 moles Ca(OH)₂ per mole SO₂ |
| Pressure Drop | 5–25 cm H₂O (Mach Engineering, 2023) | 1–5 cm H₂O (Mach Engineering, 2023) |
| Max Operating Temperature | 1,000°C | 200°C (DoverMEI, 2021) |
| Humidity Tolerance | 10–100% | <10% (DoverMEI, 2021) |
Pollutant Removal Efficiency: What Each System Captures (and What It Misses)
Wet scrubbers generally offer superior removal efficiencies for a broader range of pollutants, particularly acidic gases and fine particulate matter, compared to dry scrubbers. The liquid-phase reactions in wet systems are often faster and more complete, leveraging the enhanced contact and solubility of pollutants in the scrubbing medium. For instance, the reaction of SO₂ with calcium hydroxide in a wet scrubber (SO₂ + Ca(OH)₂ → CaSO₃ + H₂O) occurs rapidly, leading to high scrubbing efficiency. This makes Zhongsheng’s FGD scrubber systems for SO₂ and particulate removal highly effective.
Dry scrubbers, while effective, often exhibit limitations, particularly in removing fine particulates (PM₂.₅) and handling high-moisture exhaust streams, which can lead to caking and reduced sorbent reactivity (CECO Enviro, 2023). Neither wet nor dry scrubbers are inherently optimized for NOₓ removal, typically achieving only minor reductions; specialized selective catalytic reduction (SCR) or selective non-catalytic reduction (SNCR) systems are required for significant NOₓ control.
| Pollutant | Wet Scrubber Removal Efficiency | Dry Scrubber Removal Efficiency |
|---|---|---|
| SO₂ | 90–99% (EPA AP-42) | 80–95% (CECO Enviro, 2023) |
| HCl | 95–99% (EPA AP-42) | 90–98% (Mach Engineering, 2023) |
| Particulate Matter (PM₂.₅) | 95–99% (Mach Engineering, 2023) | 80–90% (CECO Enviro, 2023) |
| NOₓ | 10–30% | 5–20% |
| Heavy Metals (Hg, Cd) | 90–98% (EPA AP-42) | 50–80% |
For example, a coal-fired power plant in China, facing the stringent SO₂ limits of GB 13223-2011 (≤35 mg/m³), transitioned from a dry sorbent injection system to a wet flue gas desulfurization (FGD) scrubber. This switch was necessitated by the wet scrubber's ability to consistently achieve SO₂ removal efficiencies exceeding 98%, a level often unattainable with typical dry systems under high SO₂ loading conditions. This demonstrates how wet scrubbers provide the higher SO₂ scrubbing efficiency needed for demanding applications.
Engineering Parameters: Gas Flow Rates, Footprint, and Utility Requirements
The selection between wet and dry scrubbers is heavily influenced by site-specific engineering parameters, including the volume of gas to be treated, available physical space, and utility infrastructure. Wet scrubbers can manage larger gas flow rate capacities, ranging from 1,000 to 500,000 m³/h, making them suitable for large industrial facilities like power plants or large chemical complexes. Dry scrubbers, while more compact, typically handle gas flow rates from 500 to 300,000 m³/h.
Footprint is a critical consideration; wet scrubbers generally require 2–10 m² per 1,000 m³/h of gas treated, whereas dry scrubbers are more space-efficient, needing only 0.5–3 m² per 1,000 m³/h (Zhongsheng field data, 2025). This means a wet scrubber can demand 2–3 times more space than a dry system for the same flow rate. For a facility treating 50,000 m³/h of exhaust gas, a wet scrubber might require 100–500 m² of space, while a dry scrubber would need only 25–150 m². This significant difference in footprint can be a deciding factor for plants with limited real estate.
Utility requirements also differ substantially. Wet scrubbers consume 0.5–2.0 L/m³ of water and require robust water treatment systems, such as clarifiers and pH adjustment, to manage the wastewater effluent. Facilities may also consider treating wet scrubber wastewater in industrial facilities or implementing wastewater treatment solutions for wet scrubber effluent. They also have higher power consumption, typically 0.5–2.0 kWh per 1,000 m³ of gas, primarily due to fan energy to overcome pressure drop and pumping for scrubbing liquid. Reagent consumption for wet systems is often 1.1–1.5 times the stoichiometric amount to ensure complete reaction. Dry scrubbers, on the other hand, consume no water for scrubbing but require significant reagent storage and handling infrastructure, such as silos and pneumatic conveyors for their dry sorbents. Their power consumption is lower, at 0.2–1.0 kWh per 1,000 m³, due to reduced pressure drop and no liquid pumping, but reagent consumption is slightly more efficient, typically 1.0–1.2 times the stoichiometric amount. Automated reagent dosing for wet scrubbers is often managed by Zhongsheng's automatic chemical dosing systems.
Gas velocity is another critical design parameter; wet scrubbers typically operate at lower gas velocities of 1–3 m/s to maximize gas-liquid contact time, while dry scrubbers can handle higher velocities of 10–20 m/s (Mach Engineering, 2023), which contributes to their smaller footprint.
| Parameter | Wet Scrubber | Dry Scrubber |
|---|---|---|
| Gas Flow Rate Capacity | 1,000–500,000 m³/h | 500–300,000 m³/h |
| Footprint per 1,000 m³/h | 2–10 m² (Zhongsheng field data, 2025) | 0.5–3 m² (Zhongsheng field data, 2025) |
| Water Consumption | 0.5–2.0 L/m³ | 0 |
| Reagent Consumption | 1.1–1.5× stoichiometric | 1.0–1.2× stoichiometric |
| Power Consumption | 0.5–2.0 kWh per 1,000 m³ | 0.2–1.0 kWh per 1,000 m³ |
| Typical Gas Velocity | 1–3 m/s (Mach Engineering, 2023) | 10–20 m/s (Mach Engineering, 2023) |
Cost Comparison: CAPEX, OPEX, and ROI for Wet vs Dry Scrubbers
The financial implications of selecting an air pollution control system are multifaceted, encompassing both capital expenditure (CAPEX) and operational expenditure (OPEX), which collectively determine the return on investment (ROI). For a typical 100,000 m³/h system, the CAPEX for a wet scrubber can range from $2.5M–$5M, significantly higher than the $1.5M–$3M for a dry scrubber (CECO Enviro, 2023; industry benchmarks, 2025). This difference is primarily driven by the need for corrosion-resistant materials (e.g., Hastelloy, Fiberglass Reinforced Plastic - FRP) in wet scrubbers to withstand acidic scrubbing liquids, as well as the integrated wastewater treatment systems required.
Annual OPEX also shows a notable disparity, with wet scrubbers costing $500K–$1.2M annually compared to $300K–$800K for dry scrubbers (CECO Enviro, 2023; industry benchmarks, 2025). The breakdown of OPEX reveals key trade-offs: reagents account for approximately 40% of OPEX, energy for 30%, maintenance for 20%, and wastewater treatment for an additional 10% in wet systems. Wet scrubbers generally incur higher energy costs due to increased pressure drop and pumping requirements for the scrubbing liquid, along with significant water consumption and associated treatment costs. Conversely, dry scrubbers have lower energy costs but typically higher reagent costs, as they rely heavily on the continuous supply of dry sorbents (Mach Engineering, 2023).
Considering ROI, a dry scrubber might offer a faster payback period, potentially 3 years, compared to 5 years for a wet scrubber in a 200,000 m³/h application, primarily due to lower initial CAPEX and energy savings. However, this calculation must factor in specific reagent costs and potential long-term maintenance differences. Hidden costs can also impact the true total cost of ownership (TCO); wet scrubbers often require permits for wastewater discharge, while dry scrubbers necessitate permits for solid waste disposal (e.g., spent sorbent), which can be classified as hazardous depending on the captured pollutants.
| Cost Category | Wet Scrubber (100,000 m³/h system) | Dry Scrubber (100,000 m³/h system) |
|---|---|---|
| Capital Expenditure (CAPEX) | $2.5M–$5M (2025 USD) | $1.5M–$3M (2025 USD) |
| Annual Operating Expenditure (OPEX) | $500K–$1.2M (2025 USD) | $300K–$800K (2025 USD) |
| OPEX Breakdown (Approximate) | Reagents (40%), Energy (30%), Maintenance (20%), Wastewater Treatment (10%) | Reagents (40-50%), Energy (30-40%), Maintenance (10-20%) |
| Key CAPEX Drivers | Corrosion-resistant materials, wastewater treatment system | Reagent storage & handling, downstream PM control |
| Typical ROI (200,000 m³/h) | ~5 years | ~3 years |
Regulatory Compliance: Meeting EPA, EU, and China Emission Standards
Meeting stringent global emission standards is a primary driver for industrial air pollution control investments, with wet scrubbers often better positioned to achieve the lowest permissible limits. Wet scrubbers typically achieve higher removal efficiency for SO₂ and particulate matter (Mach Engineering, 2023), making them a preferred choice for compliance with the most demanding regulations. For instance, the European Union's Industrial Emissions Directive (IED) often favors wet scrubbers for SO₂ control due to their ability to achieve 50 mg/m³ or lower. Similarly, China’s ultra-low emission (ULE) standards, particularly GB 13223-2011 for thermal power plants, set SO₂ limits as low as 35 mg/m³ and PM limits at 5 mg/m³, driving widespread adoption of advanced wet flue gas desulfurization (FGD) systems.
Dry scrubbers, while effective, may face limitations in meeting the strictest PM limits without secondary systems. To achieve PM limits of 5-10 mg/m³, dry scrubbers often require a highly efficient downstream particulate control device, such as a baghouse (DoverMEI, 2021). The choice between wet and dry scrubbers, therefore, often hinges on the specific pollutant profile and the stringency of regional regulations. Facilities operating under EPA New Source Performance Standards (NSPS) or EU IED often find that wet scrubbers provide a more robust and reliable pathway to long-term compliance, particularly for SO₂ and HCl, where liquid-phase reactions offer superior removal kinetics. Zhongsheng’s FGD scrubber systems are engineered to meet these rigorous global benchmarks.
| Pollutant | EPA NSPS (Typical) | EU IED (Typical) | China GB 13223-2011 (ULE) |
|---|---|---|---|
| SO₂ | 30 mg/m³ | 50 mg/m³ | 35 mg/m³ |
| NOₓ | 100 mg/m³ | 150 mg/m³ | 50 mg/m³ |
| PM | 10 mg/m³ | 5 mg/m³ | 5 mg/m³ |
| HCl | 20 mg/m³ | 10 mg/m³ | 30 mg/m³ |
Decision Framework: How to Choose Between Wet and Dry Scrubbers
Selecting the optimal scrubber system requires a systematic evaluation of your facility's unique operational parameters, pollutant profile, and regulatory obligations. This structured decision framework ensures a data-driven choice that balances efficiency, cost, and compliance.
- Step 1: Pollutant Profile Assessment. Begin by identifying the primary pollutants in your exhaust stream (e.g., SO₂, HCl, PM₂.₅, heavy metals). Refer to the "Pollutant Removal Efficiency" table to determine which scrubber type offers the necessary removal efficiency for each specific pollutant. Wet scrubbers generally excel for high SO₂ and PM removal, while dry scrubbers are suitable for moderate acidic gas control.
- Step 2: Gas Stream Conditions Evaluation. Analyze your exhaust gas temperature, humidity, and flow rate. Dry scrubbers are limited to temperatures below 200°C and humidity below 10%, while wet scrubbers can handle much higher temperatures (up to 1,000°C) and saturated conditions. Consider the total gas flow rate capacity required, as wet scrubbers can manage larger volumes (up to 500,000 m³/h).
- Step 3: Space Constraints Analysis. Calculate the required footprint for each scrubber type using the engineering parameters table. If your facility has limited space, a dry scrubber's smaller footprint (0.5–3 m² per 1,000 m³/h) may be a decisive advantage over a wet scrubber (2–10 m² per 1,000 m³/h).
- Step 4: Utility Availability Assessment. Evaluate your facility's access to critical utilities. Wet scrubbers demand significant water supply (0.5–2.0 L/m³ of gas) and a robust wastewater treatment infrastructure. Dry scrubbers require substantial space for reagent storage (e.g., lime silos) and handling systems. Power consumption also differs, with wet scrubbers typically requiring more energy (0.5–2.0 kWh per 1,000 m³).
- Step 5: Cost Analysis and TCO. Utilize the CAPEX and OPEX table to project the 5-year Total Cost of Ownership (TCO) for both wet and dry scrubber options. Factor in initial capital costs, annual operating expenses (reagents, energy, maintenance), and any hidden costs like permitting for waste streams.
- Step 6: Regulatory Compliance Verification. Cross-reference your facility's location with the "Regulatory Compliance" table to identify the specific EPA, EU IED, or China emission standards that must be met. Determine if the chosen scrubber alone can achieve these limits, or if secondary systems (e.g., a baghouse for dry scrubber PM control) are necessary to comply with ultra-low emission standards.
This framework can be visualized as a decision tree:
Start: Pollutant Profile > High SO₂/PM or High Temperature/Humidity?
- YES (High SO₂/PM or High Temp/Humid): Consider Wet Scrubber.
- > Space Available? (2-10 m²/1000m³/h)
- > Water/Wastewater Treatment Capacity? (0.5-2.0 L/m³)
- > Meets Compliance?
- > Acceptable TCO?
- >> SELECT WET SCRUBBER
- NO (Moderate Pollutants, Low Temp/Humidity): Consider Dry Scrubber.
- > Space Available? (0.5-3 m²/1000m³/h)
- > Reagent Storage/Handling Capacity?
- > Meets Compliance (potentially with baghouse)?
- > Acceptable TCO?
- >> SELECT DRY SCRUBBER
To assist in this complex evaluation, a downloadable Excel template is available, allowing readers to input their specific facility data and generate a comparative analysis of scrubber options, including a personalized ROI calculation.
Frequently Asked Questions

Are wet or dry scrubbers better?
Neither system is universally "better"; suitability depends on specific industrial requirements. Wet scrubbers generally offer higher removal efficiencies (95-99%) for acidic gases and fine particulate matter, especially in high-temperature or high-humidity exhaust streams. Dry scrubbers provide a more compact solution with lower energy consumption and no wastewater discharge, suitable for moderate pollutant loads and lower-temperature, low-humidity gas streams.
What is the main disadvantage of wet scrubbers?
The main disadvantage of wet scrubbers is the generation of a wastewater stream that requires treatment and disposal, adding to operating costs ($0.50–$2.00 per 1,000 m³) and potentially requiring additional permitting. They also typically have a larger footprint (2–3× more space than dry scrubbers) and higher capital costs ($2.5M–$5M for a 100,000 m³/h system) due to the need for corrosion-resistant materials and water treatment infrastructure.
What are the advantages of a wet scrubber?
Wet scrubbers offer several advantages, including superior pollutant removal efficiency (up to 99% for SO₂, HCl, and PM₂.₅), the ability to handle high-temperature (up to 1,000°C) and high-humidity exhaust gases, and simultaneous removal of both gaseous and particulate pollutants. Their robust performance makes them ideal for meeting stringent regulatory standards, such as China's ultra-low emission limits for SO₂ (≤35 mg/m³).
When should a dry scrubber be considered?
A dry scrubber should be considered when exhaust gas temperatures are below 200°C and humidity is low (<10%), space is limited (requiring 0.5–3 m² per 1,000 m³/h), and the primary pollutants are moderately concentrated acidic gases. Their advantages include lower energy consumption, no wastewater discharge, and lower capital costs ($1.5M–$3M for a 100,000 m³/h system), especially when existing particulate control, like a baghouse, is already in place or can be easily integrated.