Which treatment route fits a Fort Wayne plastics plant?
For plastics and rubber wastewater in Fort Wayne, MBR is usually the better fit when the plant must capture fine polymer particles, minimize footprint, or produce water for reuse; conventional activated sludge can be more economical when serviceable equipment already exists and moderate discharge requirements apply. In a municipal study, MBR permeate contained 0.4 MP/L versus 1.0 MP/L for CAS, but that result is not a guaranteed industrial performance figure. The actual decision should follow wastewater characterization, permit limits, pretreatment needs, reuse targets, and a site-specific life-cycle cost comparison.
MBR and conventional activated sludge are not interchangeable products with only a price difference. CAS treats wastewater biologically and then separates biomass through gravity settling in a clarifier. MBR combines activated-sludge biology with submerged membrane filtration, so solids capture depends on membrane separation rather than on floc settling alone.
For Fort Wayne processors, MBR deserves priority when polymer fines or rubber crumb escape through clarifier overflow, reuse water is required, or available floor space is constrained. Retaining or upgrading CAS remains defensible when the aeration basin and clarifier have adequate remaining life, the discharge criteria do not require tighter solids separation, and the life-cycle model favors lower operating complexity.
No researched source establishes Fort Wayne-specific industrial discharge limits. The applicable 2026 MBR cost-per-m³ guide provides a general commercial framework, but the plant’s current permit, wastewater characterization, reuse plan, footprint, and installed-asset condition must control the selection.
How MBR and conventional activated sludge handle polymer fines differently
Lares et al. measured 0.4 MP/L in MBR permeate and 1.0 MP/L in final CAS effluent, providing municipal research evidence that a membrane barrier can improve microplastics separation.
CAS depends on biological floc formation and the resulting floc’s settling behavior. Fine polymer particles, fibers, or rubber crumb must associate with floc and remain in the clarifier sludge for reliable capture. Light or poorly settling material can remain in the overflow.
MBR retains biomass behind submerged membranes and sends permeate through the membrane barrier. This physical separation is the principal mechanism difference relevant to polymer fines removal; it does not remove the need for biological treatment, equalization, or removal of contaminating oils and grease before the membrane.
The available microplastics study was conducted at a municipal wastewater treatment plant operating CAS alongside a pilot-scale MBR. Lares et al., published by Elsevier in Water Research in April 2018, identified polyester fibers and polyethylene fragments most frequently. Those particle forms are relevant to plastics processing, but the study does not establish guaranteed performance for an industrial Fort Wayne line with different polymers, additives, batch dumps, or flow patterns.
| Separation characteristic | Conventional activated sludge | MBR |
|---|---|---|
| Biological treatment | Yes | Yes |
| Primary solids-separation mechanism | Gravity settling of biological floc | Submerged membrane filtration |
| Dependence on floc settling | Yes | Reduced by physical membrane separation |
| Municipal study result | 1.0 MP/L in final effluent | 0.4 MP/L in permeate |
| Industrial Fort Wayne design value | Requires site testing and current permit criteria | Requires site testing and current permit criteria |
The mechanical separation principle can be reviewed in the integrated MBR membrane bioreactor description. Any selected equipment should still be tied to actual polymer characterization, rather than the municipal concentration comparison.
Evidence limits: what the microplastics study does and does not prove
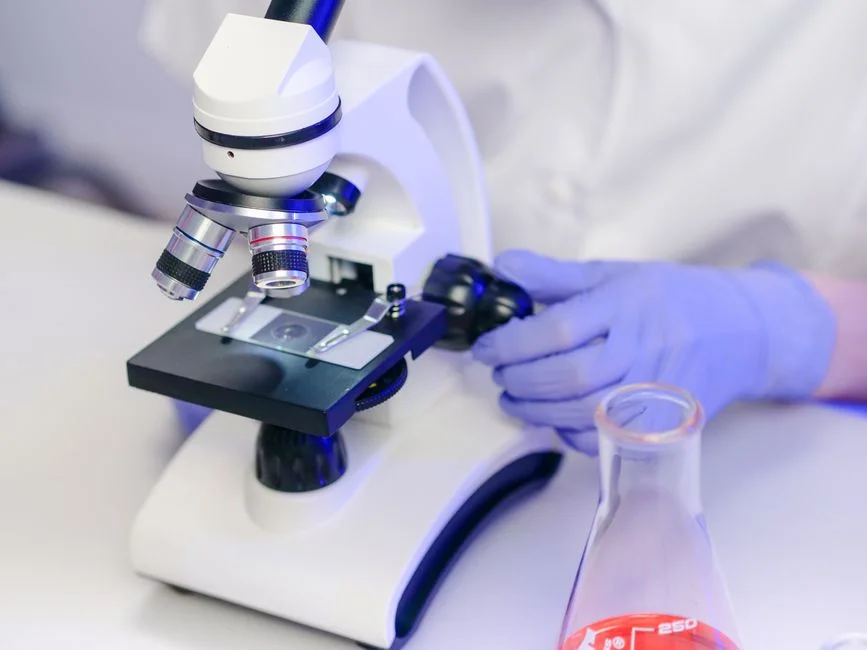
Lares et al. studied a municipal plant with a CAS process and pilot-scale MBR, collecting wastewater and sludge samples once every two weeks during a three-month campaign; the reported plant-wide microplastic retention was 98.3%.
That 98.3% finding describes overall retention across the studied municipal treatment works, not the removal efficiency of the MBR alone. The same April 2018 Water Research study reported 0.4 MP/L in MBR permeate and 1.0 MP/L in final CAS effluent. Both results must remain attached to the study’s municipal and pilot-scale scope.
Industrial plastics wastewater may differ in polymer composition, particle-size distribution, flow variability, additives, oils, temperature, and upstream batch releases. A municipal study does not capture those production-specific conditions. The same caution applies to rubber crumb wastewater, where polymer composition and washing practices can change the solids presented to the treatment train.
The appropriate next step is a site trial or enforceable performance guarantee tied to the measured influent. A supplier should define the test protocol, sampling period, analytical method, acceptance criterion, and consequences of noncompliance. The 0.4 MP/L figure is research context, not a guaranteed Fort Wayne design value.
The evidence boundary is also why the 2026 MBR cost-per-m³ guide should be used as a quotation framework rather than as evidence that every industrial application will achieve municipal study results.
Build the treatment train around the contaminants
Polymer fines, rubber crumb, oils, washwater, and batch dumps require controlled pretreatment before either biological route can be evaluated reliably.
A practical process flow begins with source segregation and equalization, followed by coarse screening, dissolved air flotation where oils, grease, colloids, or floatable rubber are present, biological treatment, solids separation, and discharge or reuse polishing as required. Equalization limits short-duration production shocks; it does not remove contaminant mass or make an unsuitable wastewater stream treatable without review.
A GX Series rotary mechanical bar screen can protect pumps, valves, and downstream biological equipment by removing suspended solids, rags, plastics, and fibrous debris. Mechanical screening is protection for the rest of the train, not a substitute for biological treatment or membrane separation.
The specified DAF pretreatment for oil, grease, and floatable solids uses micro-bubble flotation and automatic skimming. Its catalog capacity is 4–300 m³/h, and its stated treatment targets include suspended solids, FOG, oil and grease, and colloidal matter. DAF is pretreatment rather than an alternative to CAS or MBR; its relevance is upstream control of material that could interfere with biology, membranes, or sludge handling.
Before selecting equipment, obtain representative data for flow and peak conditions; COD; BOD; TSS; oil and grease; polymer particle size and count; pH; temperature; conductivity; and constituents relevant to the intended reuse. Sampling should cover production, changeover, cleaning, and washdown cycles rather than only routine daytime discharge.
Compare capital cost, operating burden, footprint, and reuse value

The verified catalog attributes establish technical scale and footprint, but they do not establish installed cost or guaranteed life-cycle operating cost for a Fort Wayne site.
| Procurement attribute | Verified MBR information | Project-specific confirmation required |
|---|---|---|
| Filtration | Below 1 μm | Actual particle-removal performance on representative wastewater |
| Footprint | 60% smaller than conventional systems | Installed footprint, access space, basins, utilities, and sludge handling |
| Integrated system capacity | 10–2,000 m³/day | Average flow, peak factor, hydraulic loading, and process train design |
| DF module construction | 0.1 μm PVDF flat sheet | Compatibility with wastewater chemistry and operating conditions |
| DF aeration | Integrated aeration for continuous membrane scouring | Air demand, blower arrangement, controls, and site utility availability |
| DF configurations | 80–225 m² | Module count and arrangement needed for measured flow and loading |
| DF production capacity | 32–135 m³/day, as stated in the catalog | Final configuration must be selected from actual flow and peak-factor data |
| Price and life-cycle cost | Not established by the catalog evidence | Supplier quotation and site-specific operating-cost model |
The integrated MBR membrane bioreactor and its DF module attributes describe available configurations. They do not support treating commercial claims about energy premiums, solids-retention-time windows, greenhouse-gas effects, or specific effluent thresholds as settled project facts. Those items require current vendor evidence and site-specific engineering confirmation.
Price both routes using the same boundary. For MBR, include energy, chemical use, membrane scouring and cleaning, labor, maintenance, replacement parts, and sludge handling. For CAS, include aeration, chemicals, labor, basin and clarifier maintenance, sludge handling, replacement parts, and disposal. Both comparisons also need an owner-assigned cost for downtime and permit excursions.
Reuse requires a separate business case. Establish the actual end use—cooling, washdown, process makeup, or another application—and its quality requirements. MBR permeate may still require polishing for conductivity, silica, biological control, or application-specific contaminants. The economic value is the avoided purchased-water or discharge cost less added treatment and operating costs.
First capital cost and life-cycle cost answer different management questions. A simpler CAS train can remain the better procurement choice when existing assets are serviceable and reuse has little value; MBR can justify added complexity when fine-particle capture or reuse dominates the project risk.
Retrofit CAS or install MBR: the site-specific decision framework
A defensible equipment proposal follows six steps: establish the compliance route, characterize the wastewater, audit installed assets, compare treatment trains, issue measurable requirements, and validate performance.
- Audit existing assets. Inspect aeration capacity, basin condition, clarifier performance, sludge handling, available footprint, utilities, controls, and remaining service life. Determine whether the apparent problem is biological performance, settling failure, hydraulic overload, inadequate pretreatment, or permit compliance.
- Verify the permit and discharge route. Confirm requirements with the issuing authority and identify whether the proposed destination is a sanitary sewer, stormwater system, surface water, or reuse point. The supplied research does not establish Fort Wayne-specific limits.
- Characterize representative wastewater. Sample production and washdown cycles for polymer fines, fibers, rubber crumb, oils, COD, TSS, temperature, and batch dumps. Include flow variability and constituent concentrations relevant to reuse.
- Evaluate pretreatment and both treatment routes. Screen and DAF needs come before comparing MBR with CAS. Compare installed cost, life-cycle operating cost, footprint, reliability, operator workload, sludge disposition, and reuse value.
- Issue performance requirements. State measured influent conditions, applicable discharge or reuse criteria, operating modes, test methods, and documentation requirements. Have the supplier confirm equipment sizing against those requirements.
- Validate before acceptance. Use pilot testing where the application risk or contaminant variability warrants it, or define an enforceable site-specific acceptance test. The 2026 MBR cost-per-m³ guide can support commercial planning, but it cannot replace site validation.
| Decision gate | Evidence a buyer should obtain | Preferred route when the finding is decisive |
|---|---|---|
| Installed asset condition | Inspection report, remaining life, performance and maintenance history | CAS or upgrade when serviceable assets and moderate criteria dominate |
| Fine solids separation | Particle-size, count, TSS, and observed clarifier-overflow evidence | MBR when fine-particle escape is material |
| Reuse | End-use specification and treatment steps beyond the proposed train | MBR when reuse quality and value justify added treatment |
| Footprint | Available area, access, utilities, and installed-layout drawing | MBR when space is constrained |
| Life-cycle cost | Like-for-like installed and operating-cost model | Use the lower-risk route after sensitivities and uncertainty |
| Performance confidence | Pilot results or enforceable site acceptance criteria | Do not accept municipal data as a guarantee |
Choose the option that matches the plant's risk tolerance
MBR is the stronger choice when fine-particle escape, reuse quality, footprint, or decoupling solids capture from biological floc settling is the primary project driver.
Conventional activated sludge remains a legitimate selection when the aeration basin and clarifier are serviceable, the discharge criteria are moderate, and cost and operating simplicity outweigh tighter solids separation or reuse requirements. A clarifier improvement, pretreatment upgrade, or other retrofit may address the actual failure mechanism more economically than replacing the biological train.
The comparison should be hybrid rather than ideological. Permit route, measured influent, reuse value, installed-asset condition, and life-cycle operating cost determine the preferred solution; no one variable settles the decision by itself. The data-driven comparison of MBR alternatives is useful for structuring that evaluation, but municipal microplastics results cannot bypass local wastewater characterization and current permit review.
Management should approve the route with an explicit risk allocation: solids escape, permit exposure, reuse failure, downtime, sludge volume, operator workload, and energy or chemical cost. This makes the procurement rationale auditable and prevents a headline concentration result or generic catalog claim from becoming an unsupported design guarantee. For expected effluent behavior and acceptance planning, review MBR effluent-quality expectations alongside the site-specific criteria.
Frequently Asked Questions
How much will MBR cost compared with conventional activated sludge for a Fort Wayne plastics plant?
No researched source provides a project-specific price for either route, so a supplier should quote the same scope for both alternatives. The request must include average and peak flow, wastewater characteristics, pretreatment needs, available footprint, utilities, current equipment condition, discharge route, reuse targets, and required performance. Capital cost, operating cost, cleaning and replacement costs, sludge handling, labor, and disposal should be presented as separate life-cycle line items.
Which MBR capacity and DF module configuration should be selected?
The verified catalog ranges are 10–2,000 m³/day for the integrated system and 80–225 m² for DF configurations, with each DF module listed at 32–135 m³/day. These are catalog bounds, not a recommended configuration. Sizing requires measured flow, peak factor, wastewater characterization, hydraulic loading, pretreatment, and reuse criteria; the final module arrangement must be confirmed against those inputs and the supplier’s design criteria.
Can the 0.4 MP/L municipal MBR result be used as a Fort Wayne design guarantee?
No. Lares et al., in Elsevier’s Water Research dated April 2018, reported 0.4 MP/L for MBR permeate at a municipal plant with a pilot-scale MBR. That finding supports the separation mechanism but does not establish performance for industrial polymer wastewater. A site trial or enforceable acceptance test should use the actual influent, with a defined sampling protocol and analytical method.
Which supplier qualifications reduce permit and performance risk?
Require evidence that the supplier has sized the system from the site’s measured flow and wastewater data, checked pretreatment compatibility, stated applicable discharge and reuse criteria, defined membrane materials and maintenance requirements, and proposed site-specific commissioning and acceptance testing. The procurement file should also identify who remains responsible for permit support, operator training, spare parts, membrane cleaning, and documented performance after startup.