
What Determines Fenton Oxidation System Energy Efficiency?
Fenton oxidation system energy efficiency depends on more than reactor power. The 2021 Electro-Fenton review identifies electrical consumption, chemical use, electrode consumption, maintenance, labour, sludge dewatering, and sludge disposal as major operating-cost drivers. Efficiency improves when pH, H2O2 dosage, Fe2+ dosage, mixing, reaction time, and downstream solids handling are optimized together. For procurement, compare systems using site-specific kWh/m³, reagent consumption, COD or TOC removal, and total operating cost—not nameplate equipment power alone.
Classical Fenton oxidation is a homogeneous reaction between hydrogen peroxide and ferrous salts that generates hydroxyl radicals. The MDPI systematic review, published in 2023, identifies electricity, chemicals, electrodes, maintenance, labour, sludge dewatering, and sludge disposal as components of Electro-Fenton operating cost. It also identifies electrical energy consumption per cubic metre, per unit of COD removed, and per unit of TOC removed as valid reporting bases. These are complementary metrics: kWh/m³ measures the plant load, while energy per mass removed tests whether that load produces useful treatment.
The treatment duty must also match the denominator. A full-stream oxidation system should not be compared directly with a focused tertiary-treatment system because the commercial analysis, dated 2025-10, reports that applying these systems specifically to recalcitrant pollutants as tertiary treatment can reduce overall treatment costs by 30–40%. That is a commercial estimate, not a universal guarantee.
High COD or TOC removal is not evidence of minimum energy use. The MDPI review found only 30 studies reporting less than 50% COD or TOC removal, but it also found that iron concentration can alter performance through hydroxyl-radical scavenging and through coagulation and adsorption effects. A valid comparison therefore requires treated volume, removal mass, reagent consumption, residual iron, and sludge production—not removal percentage alone.
Optimize Chemistry Before Increasing Reactor Power
The Wiley study of cosmetic automobile-care wastewater found pH 3 as the optimum for both Classical-Fenton and Photo-Fenton treatment, making pH the first control layer rather than an ancillary adjustment. The commercial analysis dated 2025-10 describes typical Fenton operation at pH 2–4 and the associated pre- and post-treatment burden. Operators should therefore optimize the chemical recipe at controlled pH before adding electrical capacity.
The Wiley result is a source-specific benchmark, not a universal recipe. For that wastewater, the reported Classical-Fenton optimum was 300 mg/L Fe2+, 1,050 mg/L H2O2, and a 600/300 H2O2/Fe2+ ratio. Separately, the MDPI review reports iron-ion concentrations of 3–15 mg/L across surveyed reaction conditions and notes that hydroxyl-radical scavenging can reduce reaction efficiency. These findings describe different datasets and must not be combined into one recipe.
Excess reagent is not the same as effective hydroxyl-radical production. Fenton treatment can combine oxidation, coagulation, and adsorption, so a supplier must demonstrate COD/TOC removal, residual iron, sludge generation, and downstream treatability together. The operating matrix should be deliberately constrained around the proposed recipe.
| Test variable | Required comparison | Response to measure |
|---|---|---|
| pH | Bracket the supplier’s proposed setpoint under constant flow and mixing | COD/TOC removal, residual iron, chemical demand, sludge production |
| Fe2+ dose | Test below, at, and above the proposed dose | Target-pollutant removal, COD/TOC removal, coagulation performance |
| H2O2 dose | Test below, at, and above the proposed dose | Removal, residual oxidant, COD/TOC removal, downstream treatability |
| H2O2/Fe2+ ratio | Change the ratio while checking absolute doses | Radical-use efficiency, reagent consumption, sludge characteristics |
| Mixing and reaction time | Hold chemistry constant and vary physical conditions | Removal, kWh/m³, mixer and circulation demand |
Run a jar or pilot trial before fixing the commercial dose. A PLC-controlled chemical dosing system can implement the matrix, but instrumentation does not replace source-water validation. The commercial analysis reports 30–50% energy savings from intelligent control of current density, pH, temperature, and reagent dosage; treat that as an optimization opportunity whose value depends on control scope, equipment, and wastewater variability.
Choose the Right Fenton Configuration for the Wastewater
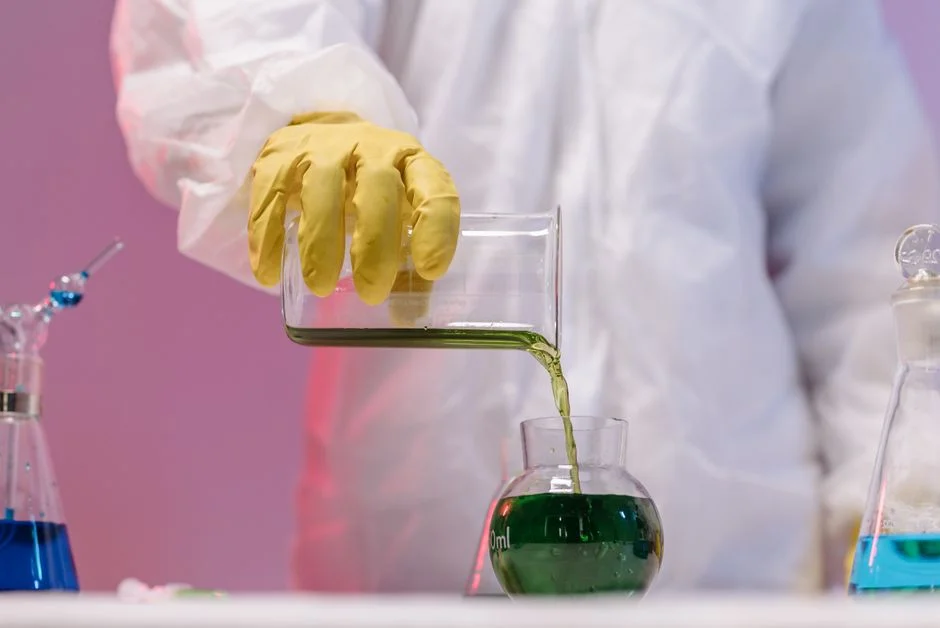
Classical Fenton, Photo-Fenton, and Electro-Fenton should be selected against the treatment objective, available utilities, chemical logistics, and downstream solids capacity. The MDPI review reports that Fenton processes were studied alone in 26.5% of the analyzed cases and combined with another treatment in 41.6%, which supports comparing treatment trains rather than treating oxidation as a stand-alone objective.
| Configuration | Chemical generation | External iron addition | Electrical demand | Radical-production mechanism | Sludge and scale-up issues |
|---|---|---|---|---|---|
| Classical Fenton | H2O2 supplied externally | Yes | Primarily mixing and auxiliaries | Hydroxyl radicals from H2O2 and Fe2+ | Reagent logistics, pH adjustment, mixing, and iron-bearing sludge |
| Photo-Fenton | H2O2 supplied externally | Yes | Includes lamp power plus auxiliaries | Fenton chemistry combined with photolysis | Light availability, reactor geometry, lamp maintenance, scale-up performance |
| Electro-Fenton | H2O2 generated at the cathode | Yes | Electrode operation plus auxiliaries | Electrochemical oxidant generation coupled with Fenton chemistry | Oxygen feed, suitable electrolyte, electrode condition, continuous-operation evidence |
| Heterogeneous or combined variants | May add or replace external reagents | Depends on design | Design-specific | May include catalytic or additional pathways | Catalyst stability, recoverability, energy feasibility, and industrial evidence |
The 2021 Electro-Fenton review states that electrochemical treatment can generate H2O2 at the cathode in the presence of oxygen feed and externally added iron catalyst. It identifies low operating pH, electrical energy demand, electrolyte suitability, hazardous side-product formation, and continuous catalyst stability as scale-up concerns. The same review identifies heterogeneous Electro-Fenton as offering a wider operating-pH range, catalyst recyclability, and reduced iron hydroxide sludge, while noting catalyst stability and energy feasibility as unresolved industrial-scale issues.
Published energy figures are screening benchmarks only. The commercial analysis dated 2025-10 gives 3–5 kWh/m³ for conventional Electro-Fenton and 2–4 kWh/m³ for Peroxone, which is not a Fenton-system guarantee; elsewhere in the same analysis, it cites 0.5–2.0 kWh/m³ for Electro-Fenton installations. The spread confirms that source-water-specific testing is necessary.
Reduce Mixing, Pumping, and pH-Correction Energy
Mixing, recycle pumping, acid and base dosing, heating, aeration, and downstream sludge handling can erase apparent savings at the oxidation reactor. A reactor-level kWh figure is therefore incomplete unless it states whether these auxiliaries are included.
Mass transfer can be improved through reactor design, but the saving must be demonstrated on the intended wastewater. The commercial analysis dated 2025-10 reports that advanced reactor designs using microbubble technology improved mass-transfer efficiency by up to 25%; this is a reported design result, not a universal plant saving. Verify the effect through mixing-power and circulation measurements rather than transferring the percentage directly to another reactor.
The same commercial analysis reports 30–50% lower energy use when intelligent controls optimize current density, pH, temperature, and reagent dosage. That estimate applies to parameter optimization, not every auxiliary load. It also does not mean that pH correction is free: lowering excess H2O2 and iron consumption reduces reagent demand, while lower iron loading may reduce sludge-handling requirements.
Before redesigning the system, collect flow, COD/TOC, pH, peroxide and iron dosing, reactor current and voltage, treatment time, mixer power, recirculation flow, and sludge mass. These data separate oxidation benefit from changes in mixing and solids handling. Where clarification is part of the train, evaluate the downstream high-efficiency lamella clarifier with the actual iron-loading and settling duty rather than selecting it from reactor power alone.
- Establish the present energy boundary by metering each electrical load.
- Measure chemical consumption before and after process changes.
- Separate mixer, pump, heater, aeration, and pH-adjustment demand from reactor demand.
- Quantify iron-bearing sludge and its dewatering demand.
- Recalculate kWh/m³ and cost per unit removed using the same denominator for every configuration.
Turn Laboratory Removal Results into Industrial Savings
A small-test removal result becomes industrial evidence only after the source water, operating envelope, energy boundary, and downstream treatment have been defined. The MDPI review found that 98.3% of the studies it analyzed were conducted at laboratory-bench scale, so a supplier’s bench result cannot support an industrial performance guarantee by itself.
- Characterize the source water. Establish COD/TOC, pH, residual oxidant, iron, conductivity, flow variability, and the pollutants responsible for poor biodegradability.
- Establish a base operating point. Fix flow, mixing, reaction time, and one chemical recipe before changing variables.
- Vary one chemical variable at a time. Test pH, Fe2+ dose, H2O2 dose, and H2O2/Fe2+ ratio while preserving the other conditions.
- Test physical performance. After identifying the chemical window, compare mixing and reaction time.
- Compare configurations. Test the best classical recipe against the proposed Electro-Fenton arrangement on the same source water.
- Scale with representative variability. Repeat across expected influent and flow conditions.
Track the named target pollutants plus COD and TOC, not only color or a single proxy. The MDPI review identifies pharmaceuticals, pesticides, dyes, solvents, phenols, oily effluents, and other industrial organics as application areas, but it does not establish universal removal efficiencies for them. Each target therefore needs a source-water result and an agreed acceptance limit.
Use the 2021 Electro-Fenton review’s EEC framework to calculate electricity per cubic metre and per unit of COD or TOC removed. Its variables include voltage, current, electrolysis time, treated volume, and COD or TOC removed. Add reagent, electrode, and sludge costs when comparing alternatives; electrical energy alone will not identify the lowest total operating cost.
The purchase specification should guarantee measured effluent quality, normalized energy use, reagent consumption, operating availability, and performance across representative influent variability. Source-water trials should also address broader industrial ETP and DAF selection and mining wastewater pretreatment and discharge limits, because downstream capacity and permit conditions can constrain the oxidation design.
Compare Fenton Operating Costs and Supplier Proposals
Compare bids using the same measured boundary and treatment duty. A reactor-power quotation is not comparable to a whole-plant guarantee if one includes recirculation, acid and base adjustment, and sludge treatment while the other excludes them.
| Evaluation item | Required bidder information | Acceptance basis |
|---|---|---|
| Electrical consumption | kWh/m³ and kWh per COD or TOC mass removed | Measured over representative source-water operation |
| Reagents | H2O2, iron, acid, and base consumption per m³ | Actual dosing and consumption records |
| Electrodes | Electrode consumption and replacement assumptions | Documented operating hours and replacement conditions |
| Sludge | Mass and dewaterability, including disposal route | Measured or credibly calculated from iron loading |
| Operation | Maintenance, labour, downtime, and spare-part availability | Proposed staffing plan and support commitments |
| Performance | Effluent quality and removal across influent variability | Guarantee tied to representative flow and wastewater conditions |
Require guarantees at a stated flow rate and representative source-water conditions, not an unqualified removal percentage. The energy boundary must state whether mixing, recirculation, pH adjustment, heating, compressed air, and sludge treatment are included.
Ask each bidder to identify the parameters automatically adjusted, the sensors included, and the data supporting its control claim. The commercial analysis dated 2025-10 reports 30–50% lower energy use from real-time parameter control; use that estimate to frame a technical question, not as an expected saving in every bid.
Use published Electro-Fenton figures only as screening benchmarks: 3–5 kWh/m³ for conventional systems and a separate 0.5–2.0 kWh/m³ installation estimate, both from the 2025-10 commercial analysis. Require each bidder to demonstrate its own normalized consumption and include downstream solids handling in the commercial comparison.
Frequently Asked Questions
How can I estimate the operating cost of a Fenton oxidation system without relying on reactor power alone?
Request consumption-based guarantees for electricity in kWh/m³ and per unit of COD or TOC removed, together with H2O2, iron, acid, base, and electrode consumption. Also require the measured sludge mass and its dewatering or disposal route. The 2021 Electro-Fenton review identifies energy, chemicals, electrodes, maintenance, labour, sludge dewatering, and sludge disposal as the relevant cost categories, so a quotation covering only reactor power cannot support a total-cost decision.
What information is needed before selecting Fenton reactor size and electrical capacity?
Provide the flow rate and variability, COD/TOC concentrations, target pollutants, influent pH, conductivity, residual oxidant and iron, required effluent quality, available utilities, and downstream sludge capacity. Use these inputs to establish pH correction, reaction time, mixing, and solids-handling duties. Do not size a reactor from COD load alone when the limiting constraint may be mass transfer, pH correction, or sludge disposal.
How should I choose between a classical Fenton supplier and an Electro-Fenton supplier?
Compare source-water trial results, reference installations, control narratives, warranties, and complete auxiliary-load boundaries. Classical Fenton requires externally supplied H2O2 and iron, while Electro-Fenton can generate H2O2 at the cathode but requires oxygen feed and suitable electrolyte conditions, according to the 2021 Electro-Fenton review. Require each bidder to disclose electrode condition, catalyst stability, reagent logistics, controls, and downstream solids responsibilities.
Does meeting a COD or TOC removal target prove the treatment system complies with its discharge permit?
No. COD or TOC removal is a process-performance measure, not complete permit compliance. Final acceptance must be tied to every applicable discharge requirement, including limits for the named pollutants and other regulated characteristics. If the Fenton system is only one stage of the treatment train, define its interface with downstream polishing, monitoring, and flow control before acceptance.