How Aarhus ReWater Achieves 50% Energy Surplus: Process Deep Dive
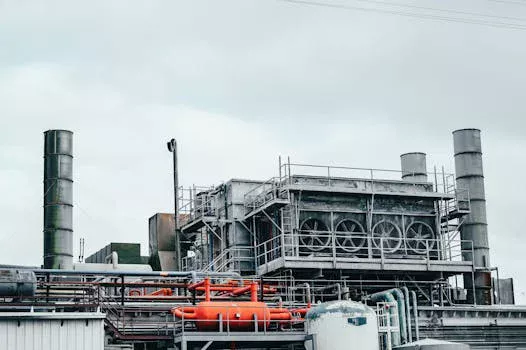
Aarhus ReWater's Marselisborg wastewater treatment plant demonstrates how industrial-scale systems achieve energy-positive operations through targeted process optimizations. The facility's 50% energy surplus results from a decade of refining core treatment stages, reducing power consumption by 25% while increasing biogas production. For industrial facilities in Aarhus, these optimizations provide a replicable model for balancing compliance, efficiency, and cost.
The plant's success comes from three key upgrades: real-time process control, nitrogen removal efficiency, and aeration optimization. These improvements cut energy use by 12-18% in aeration—a historically high-consumption stage—and increased biogas yields by 30%. The table below summarizes the energy impact of each optimization:
| Optimization | Energy Savings | Process Impact | Data Source |
|---|---|---|---|
| SCADA control system | 12-18% reduction in aeration energy | Real-time DO/pH adjustment reduces over-aeration | Ramboll 2023 |
| Anammox sludge treatment | 60% less energy vs conventional N removal | 85-90% nitrogen removal with minimal aeration | EPA 2023 |
| Fine bubble aeration | Oxygen transfer efficiency: 12% → 28% | Reduced blower runtime by 35% | Aarhus Vand 2024 |
| Turbo compressor upgrade | 30% energy savings in aeration | Optimized pressure/flow for variable loads | IWA 2024 |
SCADA Control: Real-Time Energy Management
The plant's SCADA system integrates 1,200 sensors to monitor dissolved oxygen, pH, and flow rates across treatment stages. Dynamic aeration adjustments based on real-time data eliminate over-aeration, a common inefficiency in industrial WWTPs. This adaptive control reduced aeration energy use by 12-18% while maintaining effluent quality (BOD <15 mg/L, COD <75 mg/L). Industrial facilities can achieve similar savings by targeting high-consumption processes like pumping and sludge handling.
Anammox Process: Nitrogen Removal with Minimal Energy
Conventional nitrification/denitrification requires significant aeration and carbon dosing. The Marselisborg plant uses anammox bacteria, which convert ammonium directly to nitrogen gas under anaerobic conditions. This approach achieves 85-90% nitrogen removal with 60% less energy, reducing operational costs by 20-25% for high-nitrogen industrial wastewater from food processing and pharmaceuticals.
Aeration Optimization: Fine Bubble and Turbo Compressors
The plant's fine bubble aeration system improved oxygen transfer efficiency from 12% to 28%, cutting blower runtime by 35%. Combined with turbo compressors optimized for variable flow rates, this upgrade reduced aeration energy by 30%. Industrial facilities can replicate these savings by retrofitting existing aeration systems with high-efficiency diffusers and variable-speed drives.
The transition to energy-efficient equipment requires careful process integration.
Process Flow: From Influent to Energy Surplus
The Marselisborg treatment train integrates these optimizations into a streamlined workflow:
- Pre-treatment: Screening and grit removal (0.1-0.2 kWh/m³)
- Biological treatment: Activated sludge with SCADA-controlled aeration (0.3-0.5 kWh/m³)
- Sludge handling: Anammox for nitrogen removal, anaerobic digestion for biogas (0.2-0.4 kWh/m³)
- Energy recovery: Biogas-to-electricity via combined heat and power (CHP) units
A simplified schematic of this process appears in Aarhus Vand's technical reports.
Danish Industrial Wastewater Discharge Standards: 2025 Compliance Checklist
Danish Environmental Protection Agency discharge limits for industrial facilities in Aarhus align with EU Industrial Emissions Directive 2010/75/EU. The 2025 standards introduce stricter limits for nitrogen, phosphorus, and heavy metals, supporting Denmark's push for energy-positive wastewater treatment. The table below outlines key parameters and sector-specific variations:
| Parameter | Direct Discharge Limit | Indirect Discharge Limit | Sector-Specific Notes | Testing Frequency |
|---|---|---|---|---|
| BOD5 | <15 mg/L | <25 mg/L | Food processing: <30 mg/L | Weekly |
| COD | <75 mg/L | <125 mg/L | Textiles: <200 mg/L | Weekly |
| TSS | <30 mg/L | <50 mg/L | DAF systems achieve 92-97% removal | Monthly |
| Total Nitrogen | <8 mg/L | <15 mg/L | Anammox systems target <5 mg/L | Monthly |
| Total Phosphorus | <1 mg/L | <2 mg/L | Chemical precipitation achieves <0.5 mg/L | Monthly |
| Cadmium | <0.05 µg/L | <0.1 µg/L | Metals sector: <0.01 µg/L | Quarterly |
| Mercury | <0.03 µg/L | <0.05 µg/L | EU IED 2010/75/EU | Quarterly |
Compliance Costs and Testing Requirements
Weekly BOD/COD testing costs 800-1,200 DKK per sample, while monthly metals testing ranges from 1,500-2,500 DKK. Facilities can reduce costs by 40% through automated compliance reporting, which integrates SCADA data with lab results to minimize manual sampling.
Sector-Specific Challenges
- Food processing: High BOD/COD loads require MBR or DAF systems to meet <30 mg/L BOD limits. Advanced oxidation processes can further reduce COD by 50-70%.
- Pharmaceuticals: Nitrogen limits (<8 mg/L) require anammox or membrane bioreactors for efficient removal.
- Metals: Heavy metal limits (<0.05 µg/L Cd) require chemical precipitation or ion exchange, adding 15-20% to OPEX.
Equipment selection plays a critical role in meeting these standards.
Energy-Efficient Wastewater Treatment Equipment: DAF vs MBR vs Sedimentation for Industrial Facilities
Industrial facilities in Aarhus must balance energy efficiency, footprint, and effluent quality when selecting treatment equipment. Dissolved Air Flotation, Membrane Bioreactors, and sedimentation systems each offer advantages for specific wastewater characteristics. The following table compares key performance metrics:
| Parameter | DAF Systems | MBR Systems | Sedimentation |
|---|---|---|---|
| Energy Use (kWh/m³) | 0.3-0.5 | 0.6-0.9 | 0.1-0.2 |
| TSS Removal (%) | 92-97 | >99 | 85-90 |
| BOD Removal (%) | 85-90 | 95-99 | 70-80 |
| Footprint (m²/m³/day) | 0.05-0.1 | 0.03-0.05 | 0.1-0.2 |
| Maintenance | Weekly skimming, chemical dosing | Quarterly membrane cleaning | Monthly sludge removal |
| Ideal Applications | FOG, oil/grease, high TSS | High BOD, pathogen removal | Low TSS, budget constraints |
Energy Cost Comparison for 100 m³/h Systems
At Aarhus's industrial electricity rate of 0.5 DKK/kWh, annual energy costs vary by system:
- DAF: 26,000 DKK/year (0.4 kWh/m³ × 100 m³/h × 24 h × 365 × 0.5 DKK/kWh)
- MBR: 52,000 DKK/year (0.8 kWh/m³)
- Sedimentation: 13,000 DKK/year (0.2 kWh/m³)
While MBR systems have higher energy costs, they achieve <1 mg/L TSS and 99% pathogen removal, enabling water reuse and reducing discharge fees by 30-40%.
Equipment Selection Framework
Facilities should evaluate influent characteristics and compliance needs when selecting equipment:
- High FOG/oil: ZSQ series DAF systems for 95% FOG removal.
- High BOD/COD: MBR systems with PVDF membranes for reuse-quality effluent.
- Low TSS/budget: Lamella clarifiers for 85-90% TSS removal at 0.1-0.2 kWh/m³.
For facilities with variable loads, DAF systems offer flexibility, while MBR systems provide consistent performance for high-strength wastewater.
Understanding these cost factors helps facilities make informed investment decisions.
Cost Breakdown: Industrial Wastewater Treatment in Aarhus (2025)
Industrial facilities in Aarhus face trade-offs between CAPEX and OPEX when investing in wastewater treatment. Energy-efficient systems like MBR and DAF offer long-term savings but require higher upfront costs. The table below provides a 2025 cost breakdown for 50-200 m³/h systems:
| System | CAPEX (DKK) | OPEX (DKK/year) | Energy Cost (DKK/year) | ROI (Years) |
|---|---|---|---|---|
| DAF (50-200 m³/h) | 150,000-400,000 | 80,000-200,000 | 26,000-104,000 | 5-8 |
| MBR (50-200 m³/h) | 300,000-700,000 | 120,000-300,000 | 52,000-208,000 | 5-7 (with biogas recovery) |
| Sedimentation (50-200 m³/h) | 100,000-250,000 | 50,000-120,000 | 13,000-52,000 | 8-10 |
OPEX Breakdown
Operational costs for industrial wastewater treatment systems typically distribute as follows:
- Energy: 40-60% of OPEX (aeration, pumping, sludge handling)
- Chemicals: 20-30% (coagulants, flocculants, pH adjustment)
- Labor: 10-15% (maintenance, sampling, compliance reporting)
- Maintenance: 5-10% (membrane replacement, equipment servicing)
Facilities can reduce OPEX by 30% through process optimization, such as SCADA-controlled aeration and PLC-controlled chemical dosing.
Subsidy Opportunities
The Danish Energy Agency offers grants covering up to 40% of CAPEX for energy-efficient wastewater treatment systems. Eligible technologies include:
- MBR systems with biogas recovery
- DAF systems with SCADA integration
- Anammox-based nitrogen removal
Facilities can apply through the 2025 Energy Technology Development and Demonstration Program (EUDP).
Implementation requires a structured approach.
Step-by-Step Guide: Implementing Energy-Positive Wastewater Treatment in Your Facility
Industrial facilities in Aarhus can replicate Marselisborg WWTP's energy-positive model through this six-step roadmap. The process prioritizes high-impact upgrades to ensure compliance with Danish discharge standards while reducing operational costs.
-
Conduct an Energy Audit
Power meters and flow sensors identify high-consumption processes. Key focus areas:
- Aeration: 50-60% of total energy use
- Pumping: 20-30% (evaluate variable-speed drives)
- Sludge handling: 10-15% (assess dewatering efficiency)
SCADA data analysis can pinpoint inefficiencies, such as over-aeration during low-load periods.
-
Prioritize High-Energy Processes
Target upgrades with the highest ROI:
- Replace coarse bubble aerators with fine bubble diffusers (20-30% energy savings)
- Install turbo compressors for variable flow rates (15-20% savings)
- Upgrade to anammox for nitrogen removal (60% less energy vs conventional)
-
Select Equipment Based on Influent Characteristics
Match treatment technology to wastewater composition:
- High FOG/oil: DAF systems for 95% FOG removal
- High BOD/COD: MBR systems for reuse-quality effluent
- Low TSS: Lamella clarifiers for budget-friendly sedimentation
-
Integrate SCADA for Real-Time Monitoring
Deploy SCADA systems to optimize key parameters:
- DO: Maintain 1.5-2.5 mg/L to avoid over-aeration
- pH: Adjust chemical dosing to stabilize biological treatment
- Flow rates: Balance load distribution across treatment stages
Learn more about SCADA integration for wastewater treatment.
-
Optimize Sludge Treatment
Maximize biogas production and nutrient removal:
- Anammox: Reduce nitrogen by 85-90% with minimal aeration
- Anaerobic digestion: Convert sludge to biogas (60-70% methane content)
- Dewatering: Use centrifuges or belt presses to reduce sludge volume by 70-80%
-
Measure and Verify Energy Savings
Implement ISO 50001 energy management systems to track performance:
- Baseline: Establish pre-upgrade energy use (kWh/m³)
- Monitoring: Track DO, pH, and flow rates in real time
- Verification: Conduct annual energy audits to validate savings
Frequently Asked Questions
- What are the key Danish discharge limits for industrial wastewater in 2025?
- Direct discharge limits include BOD <15 mg/L, COD <75 mg/L, TSS <30 mg/L, total nitrogen <8 mg/L, and total phosphorus <1 mg/L. Sector-specific variations apply (e.g., food processing: BOD <30 mg/L). Heavy metals like cadmium must be <0.05 µg/L.
- How does Marselisborg WWTP achieve 50% energy surplus?
- The plant combines SCADA-controlled aeration (12-18% energy savings), anammox sludge treatment (60% less energy for nitrogen removal), and fine bubble aeration (28% oxygen transfer efficiency). Biogas recovery from anaerobic digestion powers the facility and exports surplus electricity to the grid.
- Which wastewater treatment system is most energy-efficient for industrial facilities?
- Sedimentation systems use 0.1-0.2 kWh/m³, making them the most energy-efficient for low-TSS wastewater. DAF systems (0.3-0.5 kWh/m³) work best for high FOG/oil loads, while MBR systems (0.6-0.9 kWh/m³) provide reuse-quality effluent for high-BOD wastewater.
- What are the CAPEX and OPEX ranges for industrial wastewater treatment systems in Aarhus?
- CAPEX ranges from 100,000 DKK (sedimentation) to 700,000 DKK (MBR) for 50-200 m³/h systems. OPEX varies from 50,000 DKK/year (sedimentation) to 300,000 DKK/year (MBR), with energy costs accounting for 40-60% of total OPEX.
- How can industrial facilities reduce compliance testing costs?
- Automated compliance reporting integrates SCADA data with lab results, reducing manual sampling by 40%. Weekly BOD/COD testing costs 800-1,200 DKK per sample, while automated systems can cut this to 480-720 DKK per sample. Learn more about automated compliance reporting.
- Are there subsidies for energy-efficient wastewater treatment in Denmark?
- The Danish Energy Agency offers grants covering up to 40% of CAPEX for systems like MBR with biogas recovery or DAF with SCADA integration. Eligible facilities can apply through the 2025 EUDP program.