Why Cost Differences Between MBR and SBR Matter for Your Project
For a food processing plant facing increasingly stringent effluent limits for total nitrogen (TN) below 10 mg/L and total phosphorus (TP) below 1 mg/L, and constrained by a compact urban site, the cost differences between Membrane Bioreactor (MBR) and Sequencing Batch Reactor (SBR) systems are critical to project viability and long-term operational sustainability. Effluent quality requirements directly influence the choice of wastewater treatment technology, often dictating the complexity and cost of the system. MBR systems, for instance, consistently deliver superior effluent quality, typically achieving TN removal exceeding 80% and TP removal over 90%, which is often necessary for water reuse or discharge into sensitive receiving waters. This enhanced performance comes with specific cost implications. Footprint constraints significantly affect Capital Expenditure (CAPEX), as larger civil works for SBR systems, requiring more land and excavation, can increase costs by 15-25% for greenfield projects compared to the more compact MBR solutions. energy costs represent a substantial portion of Operational Expenditure (OPEX), with MBR systems typically consuming 0.8–1.2 kWh/m³ for aeration and membrane scouring, while SBR systems generally require 0.4–0.6 kWh/m³ for mixing and aeration. For high-flow industrial wastewater treatment plants, this difference can lead to hundreds of thousands of dollars in annual energy expenses. A unique MBR expense is membrane replacement, which typically costs $0.10–$0.15/m³ and occurs every 5–10 years, a factor absent in SBR systems. Understanding these cost drivers is essential for engineers and procurement managers evaluating wastewater treatment cost analysis for municipal or industrial projects.MBR vs SBR Cost Breakdown: CAPEX and OPEX Compared
MBR systems typically incur 20-30% higher Capital Expenditure (CAPEX) than SBR systems for a similar treatment capacity, primarily due to the specialized membrane modules and associated infrastructure. For a 1,000 m³/day wastewater treatment plant, MBR systems might have a CAPEX of around $1.2M, compared to approximately $900K for an SBR system, reflecting the initial investment in equipment, civil works, and installation. Despite this higher upfront cost, MBR systems often achieve 10-15% lower Operational Expenditure (OPEX) due to reduced sludge handling volumes and a smaller overall footprint. Membrane lifespan, typically 5–10 years, directly impacts MBR OPEX through replacement frequency, while SBRs require larger equalization tanks and more operator attention for managing batch scheduling and aeration cycles. The following table provides a detailed cost breakdown for different project scales, illustrating the typical ranges for each component:| Cost Category | Component | MBR (500 m³/day) | SBR (500 m³/day) | MBR (2,000 m³/day) | SBR (2,000 m³/day) | MBR (10,000 m³/day) | SBR (10,000 m³/day) |
|---|---|---|---|---|---|---|---|
| CAPEX (USD) | Equipment (excl. membranes) | $250K - $350K | $180K - $250K | $800K - $1.2M | $600K - $900K | $3.5M - $5M | $2.5M - $4M |
| Membranes (initial) | $150K - $200K | N/A | $500K - $700K | N/A | $2M - $3M | N/A | |
| Civil Works (tankage, piping) | $200K - $300K | $300K - $450K | $700K - $1.1M | $1.1M - $1.7M | $3M - $4.5M | $4.5M - $7M | |
| Instrumentation & Installation | $100K - $150K | $80K - $120K | $300K - $450K | $250K - $380K | $1.2M - $1.8M | $1M - $1.5M | |
| OPEX (USD/m³) | Energy (kWh/m³) | $0.18 - $0.25 | $0.08 - $0.15 | $0.18 - $0.25 | $0.08 - $0.15 | $0.18 - $0.25 | $0.08 - $0.15 |
| Labor (operator hours) | $0.05 - $0.08 | $0.07 - $0.12 | $0.04 - $0.07 | $0.06 - $0.10 | $0.03 - $0.05 | $0.05 - $0.08 | |
| Chemicals (cleaning, coagulants) | $0.03 - $0.07 | $0.02 - $0.05 | $0.03 - $0.07 | $0.02 - $0.05 | $0.03 - $0.07 | $0.02 - $0.05 | |
| Membrane Replacement (annualized) | $0.10 - $0.15 | N/A | $0.10 - $0.15 | N/A | $0.10 - $0.15 | N/A | |
| Sludge Disposal | $0.07 - $0.10 | $0.09 - $0.13 | $0.07 - $0.10 | $0.09 - $0.13 | $0.07 - $0.10 | $0.09 - $0.13 |
Energy Consumption: The Hidden Cost Driver in MBR vs SBR
| Electricity Rate (USD/kWh) | MBR Energy Consumption (kWh/m³) | MBR Energy Cost (USD/m³) | SBR Energy Consumption (kWh/m³) | SBR Energy Cost (USD/m³) |
|---|---|---|---|---|
| $0.05 | 1.0 (average) | $0.05 | 0.5 (average) | $0.025 |
| $0.10 | 1.0 (average) | $0.10 | 0.5 (average) | $0.05 |
| $0.15 | 1.0 (average) | $0.15 | 0.5 (average) | $0.075 |
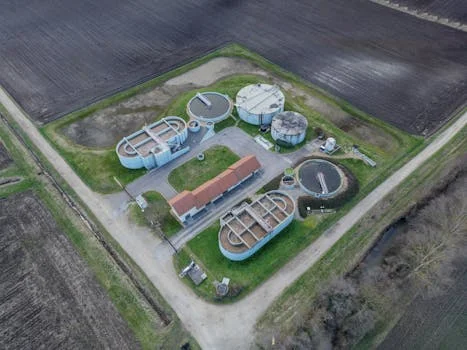
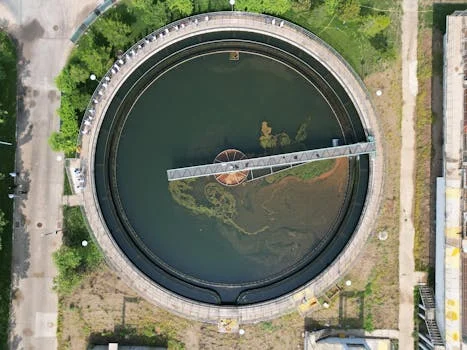
Footprint and Civil Works: How Space Constraints Affect Costs
MBR systems offer a significant advantage in terms of physical footprint, requiring 50–60% less space than conventional SBR systems for the same treatment capacity. This compact design is a critical factor for projects in urban areas or industrial facilities with limited available land, where land acquisition costs can be prohibitively high. For example, retrofitting an MBR into an existing facility often involves replacing outdated clarifiers with compact membrane tanks, minimizing new civil works and infrastructure disruption. This capability can save substantial CAPEX by avoiding greenfield construction. Conversely, SBR systems necessitate larger equalization tanks, aeration basins, and secondary clarifiers, leading to a more extensive footprint. For greenfield projects, this larger area translates into increased excavation, concrete volume, and piping requirements, which can elevate civil works CAPEX by 15–25% compared to MBR. The cost of civil works, including earthwork, concrete pouring, and structural construction, is directly proportional to the required footprint, making MBR a more cost-effective choice where space is at a premium. Compare underground sewage treatment systems for space-constrained sites, where MBR technology is often preferred due to its inherent compactness. The following table compares the typical footprint and associated civil cost estimates for MBR and SBR systems at varying project scales:| Project Scale (m³/day) | Technology | Estimated Footprint (m²/1,000 m³/day) | Estimated Civil Cost (USD/m³) | Example Total Civil Cost (USD) for Project Scale |
|---|---|---|---|---|
| 500 | MBR | 50 - 70 | $400 - $600 | $200K - $300K |
| SBR | 100 - 140 | $600 - $900 | $300K - $450K | |
| 2,000 | MBR | 40 - 60 | $350 - $550 | $700K - $1.1M |
| SBR | 80 - 120 | $550 - $850 | $1.1M - $1.7M | |
| 10,000 | MBR | 30 - 50 | $300 - $450 | $3M - $4.5M |
| SBR | 60 - 100 | $450 - $700 | $4.5M - $7M |
When to Choose MBR vs SBR: A Decision Framework for Engineers and Procurement Teams
| Criterion | Prioritize MBR When... | Prioritize SBR When... |
|---|---|---|
| Effluent Quality Requirements | Strict limits (e.g., TN < 5 mg/L, TP < 1 mg/L, TSS < 2 mg/L), water reuse, sensitive receiving waters. | Moderate limits (e.g., TN < 15 mg/L, TP < 3 mg/L, TSS < 10 mg/L), less sensitive receiving waters. |
| Footprint Constraints | Limited space, urban sites, retrofitting existing plants, high land costs. | Ample space available, rural sites, lower land costs, greenfield projects. |
| Influent Variability | High variability in flow and load (e.g., batch industrial processes). | Relatively stable influent flow and load (e.g., typical municipal sewage). |
| Budget Priority | Long-term OPEX savings are critical, higher initial CAPEX acceptable for better performance/footprint. | Lower initial CAPEX is the primary concern, higher long-term OPEX acceptable. |
| Operator Expertise | Access to skilled operators for membrane management and process optimization. | Desire for simpler operation, less specialized technical staff. |
| Sludge Production | Desire for reduced sludge volume and improved dewaterability. | Acceptance of higher sludge volumes, potential for simpler sludge handling. |
ROI and Payback Period: Calculating the True Cost of Ownership
Calculating the Return on Investment (ROI) and payback period is crucial for understanding the true cost of ownership for wastewater treatment systems, extending beyond initial Capital Expenditure (CAPEX) to encompass long-term Operational Expenditure (OPEX). While MBR systems typically have higher CAPEX, their lower OPEX often leads to a favorable ROI and a relatively short payback period. A simple method for calculating payback period is: Payback Period (Years) = (MBR CAPEX - SBR CAPEX) / (SBR Annual OPEX - MBR Annual OPEX). This calculation quantifies how quickly the initial additional investment in an MBR system is recouped through annual operational savings. MBR's higher CAPEX is often offset by lower OPEX within 5–7 years, primarily due to reduced sludge handling, lower labor requirements, and potential revenue from water reuse. The following table illustrates estimated ROI and payback periods for MBR vs. SBR across different project scales and effluent quality scenarios, assuming average cost differences:| Project Scale (m³/day) | Scenario | MBR Avg. CAPEX (USD) | SBR Avg. CAPEX (USD) | MBR Avg. Annual OPEX (USD) | SBR Avg. Annual OPEX (USD) | Annual OPEX Savings (MBR vs SBR) (USD) | Additional CAPEX for MBR (USD) | Estimated Payback Period (Years) | Estimated ROI over 10 years (%) |
|---|---|---|---|---|---|---|---|---|---|
| 500 | Standard Effluent | $700K | $550K | $80K | $95K | $15K | $150K | 10.0 | 100% |
| High Reuse/Strict | $750K | $550K | $75K | $100K | $25K | $200K | 8.0 | 125% | |
| 2,000 | Standard Effluent | $2.6M | $2.0M | $320K | $380K | $60K | $600K | 10.0 | 100% |
| High Reuse/Strict | $2.8M | $2.0M | $300K | $400K | $100K | $800K | 8.0 | 125% | |
| 10,000 | Standard Effluent | $10M | $7.5M | $1.6M | $1.9M | $300K | $2.5M | 8.3 | 120% |
| High Reuse/Strict | $11M | $7.5M | $1.5M | $2.0M | $500K | $3.5M | 7.0 | 143% |
Frequently Asked Questions
Which is better MBR or SBR treatment plant?
Neither MBR nor SBR is inherently "better"; the optimal choice depends on project-specific factors. MBR excels in delivering superior effluent quality for reuse and requires a smaller footprint, making it ideal for space-constrained sites and strict discharge limits. SBR offers lower initial CAPEX and simpler operation, suitable for larger land areas and less stringent effluent requirements.
What is the price of Dupont MBR membrane?
The price of Dupont MBR membranes, like those from other major manufacturers, varies significantly based on module type (e.g., submerged flat sheet, hollow fiber), capacity, and specific project requirements. Typical costs for replacement membranes can range from $0.10–$0.15 per cubic meter of treated water over their lifespan, contributing to the MBR's OPEX.
Can MBRs remove pharmaceuticals?
Yes, MBRs demonstrate a higher efficiency in removing many pharmaceuticals and other emerging contaminants compared to conventional activated sludge systems. The extended sludge retention time (SRT) and high biomass concentration in MBRs enhance the biodegradation of complex organic compounds, improving removal rates for a wide range of micropollutants.
What is MBR and SBR?
MBR (Membrane Bioreactor) is a wastewater treatment process that combines a conventional activated sludge biological treatment with a membrane filtration system, typically ultrafiltration or microfiltration membranes, to separate solids from the treated water. SBR (Sequencing Batch Reactor) is a fill-and-draw activated sludge system where all treatment steps (fill, react, settle, draw, idle) occur sequentially in a single reactor basin over a timed cycle.
Related Equipment
- Zhongsheng’s integrated MBR system for industrial and municipal reuse — view specifications, capacity range, and technical data
- PLC-controlled chemical dosing for MBR and SBR systems — view specifications, capacity range, and technical data
Need a customized solution? Request a free quote with your specific flow rate and pollutant parameters.