Industrial plant engineers and procurement managers comparing wastewater treatment technologies need a clear-eyed view of trade-offs. MBR membrane modules deliver <1 μm filtration, 95–99% COD removal, and a 40–60% smaller footprint than conventional activated sludge (CAS), at higher capital cost and energy draw. MBBR, CAS, and FBBR each win on other axes—energy, simplicity, or media longevity. The right pick depends on flow, space, discharge limits, and whether reuse is on the table.
What Is an MBR Membrane Module?
An MBR membrane module integrates a biological activated-sludge stage with submerged ultrafiltration (UF) membranes, replacing the gravity clarifier used in CAS. Submerged membranes separate treated water from mixed liquor suspended solids (MLSS) directly inside the bioreactor, allowing MLSS to reach 8,000–15,000 mg/L versus roughly 2,000–4,000 mg/L in CAS, which cuts required tank volume sharply. Standard pore size runs 0.1–0.4 μm, removing bacteria, most suspended solids, and a high fraction of viruses.
Three module geometries dominate: flat sheet (FS), hollow fibre (HF), and multitube (MT/MC). For industrial submerged systems, flat sheet (FS) PVDF modules are common because they tolerate physical handling, clean evenly, and resist fouling better than many HF designs in mixed-liquor service. Integrated coarse-bubble air scouring beneath the modules shears the forming cake layer and holds flux stable (HydropureWater field data, 2025). Plants we commission most often run MLSS at 10,000–12,000 mg/L, the lower end of the practical window, because higher values raise viscosity and aeration cost faster than they shrink footprint.
How MBR Compares to Conventional Activated Sludge (CAS)
MBR effluent typically tests <5 mg/L TSS and <10 mg/L COD after biological treatment, versus 10–30 mg/L TSS and 30–60 mg/L COD for a well-operated CAS train with secondary clarification. The membrane acts as an absolute barrier, while a clarifier is constrained by sludge settling velocity and bulking risk. MBR also produces 20–30% less waste activated sludge at the same loading, because longer SRT lets biomass metabolize more of the substrate before it is wasted.
Footprint is where MBR pulls ahead decisively: 0.1–0.3 m² per kL/day treated, roughly 40–60% less than the 0.5–0.8 m²/kL/day a CAS package needs at the same throughput (HydropureWater field data, 2025). CAS still wins on energy—0.5–1.0 kWh/m³ versus 1.5–2.5 kWh/m³ for MBR—and on operator familiarity. CAS requires daily sludge wasting and return activated sludge control; MBR trades that for chemical clean-in-place (CIP) every 30–90 days, with recovery-clean chemistries that operators must dose on a schedule, not on demand.
MBR vs MBBR: Efficiency, Energy, and Maintenance
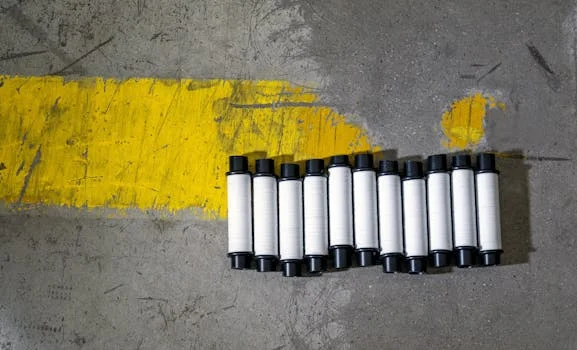
MBR keeps biomass suspended and separates it with a membrane; MBBR keeps biomass attached to free-floating plastic carriers inside an aeration tank and relies on a downstream clarifier or filter. That single architectural choice sets most of the operating profile. MBBR typically draws 0.8–1.2 kWh/m³, mostly for aeration; MBR draws 1.5–2.5 kWh/m³ because membrane air scouring and permeate pumping run continuously (industry benchmarks).
On effluent, MBR's 0.1–0.4 μm pores deliver <1 NTU turbidity straight out of the tank, ready for cooling-tower or irrigation reuse. MBBR achieves good BOD and COD removal but still needs a polishing step—sand filter, DAF, or tertiary membrane—to reach reuse-grade TSS. MBBR carries no membrane fouling risk; its maintenance is carrier retention screens and aeration tuning. MBR must run CIP every 30–90 days, a procedure detailed in a 7-step industrial maintenance protocol for submerged MBR systems. For retrofits into an existing aeration basin, MBBR is the easier drop-in: add carriers, resize blowers. MBR retrofitting usually means a new membrane tank, new headers, and a CIP skid.
Performance and Cost Comparison Across Technologies
Procurement decisions usually hinge on four numbers: CAPEX per m³/day, OPEX per kL treated, footprint, and reuse readiness. The table below consolidates the engineering benchmarks for MBR, CAS, MBBR, and FBBR so they can be compared directly.
| Parameter | MBR (Membrane Bioreactor) | CAS (Conventional Activated Sludge) | MBBR (Moving Bed Biofilm Reactor) | FBBR (Fixed Bed Biofilm Reactor) |
|---|---|---|---|---|
| Effluent Quality: TSS | <5 mg/L | 10–30 mg/L | 10–30 mg/L (post-clarifier) | 10–30 mg/L (post-clarifier) |
| Effluent Quality: COD | <10 mg/L (95-99% removal) | 30–60 mg/L (85-95% removal) | 20–50 mg/L (85-95% removal) | 20–50 mg/L (85-95% removal) |
| Effluent Quality: Turbidity | <1 NTU | 2–5 NTU | 3–6 NTU | 3–6 NTU |
| Footprint (m²/kL/day) | 0.1–0.3 (40-60% less than CAS) | 0.5–0.8 | 0.3–0.6 | 0.4–0.7 |
| Energy Use (kWh/m³) | 1.5–2.5 (due to aeration & pumping) | 0.5–1.0 (aeration & pumping) | 0.8–1.2 (aeration) | 0.7–1.1 (aeration) |
| CAPEX ($/m³/day capacity) | $1,200–$2,000 | $800–$1,400 | $900–$1,600 | $850–$1,500 |
| OPEX ($/kL treated) | $0.40–$0.70 (incl. membrane replacement) | $0.30–$0.50 | $0.25–$0.45 | $0.28–$0.48 |
| Membrane/Carrier Lifespan | Membranes: 5–7 years | Clarifiers: 20+ years | Carriers: 10–15 years | Media: 15+ years |
| Maintenance Frequency | CIP every 30-90 days, membrane replacement | Daily sludge management, periodic equipment overhaul | Carrier retention, periodic cleaning | Periodic media cleaning/replacement |
| Fouling Risk | High (membranes) | Low (mechanical issues) | Low (biofilm sloughing) | Moderate (biofilm accumulation) |
| Reuse Potential | High (direct reuse) | Low (requires tertiary treatment) | Medium (requires tertiary treatment) | Medium (requires tertiary treatment) |
MBR CAPEX runs $1,200–$2,000 per m³/day, driven by PVDF flat sheet membrane modules at 0.1 μm pore size and the CIP and blower skids that go with them. CAS sits at $800–$1,400/m³/day and MBBR at $900–$1,600/m³/day. OPEX for MBR lands at $0.40–$0.70/kL treated, of which roughly $0.15/kL is the amortized membrane replacement over a 5–7 year membrane life; CIP chemicals make up most of the rest. MBBR is usually the cheapest to run at $0.25–$0.45/kL because aeration is its main energy load and carriers last 10–15 years. CAS clarifiers and tanks routinely exceed 20 years, which pulls down lifecycle cost on long municipal horizons (HydropureWater field data, 2025).
When to Choose MBR Over Alternatives
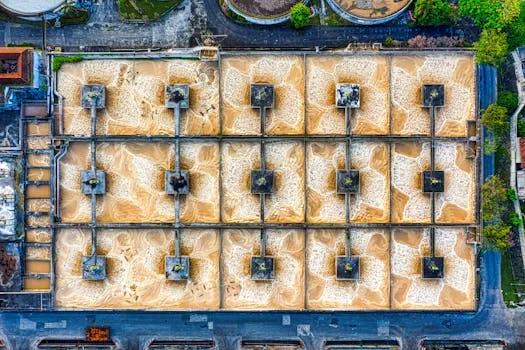
MBR is the right call when reuse, footprint, or very tight discharge limits drive the project. For an urban industrial site with constrained land, a packaged MBR membrane bioreactor system usually fits where a CAS train would not. For non-potable reuse—cooling-tower make-up, process rinse water, irrigation—MBR's <1 NTU turbidity and near-complete TSS and bacteria removal remove the need for a separate tertiary polishing stage. Plants discharging into sensitive receiving waters with BOD limits below 10 mg/L or with pathogen targets get the most reliable compliance from MBR.
MBR is the wrong call when the influent carries sustained oil, grease, or fibrous material that fouls membranes fast, when CAPEX is capped below the $1,200/m³/day floor, or when the load is highly variable: shock loads hurt MBR more than MBBR because MLSS responds slowly and membranes punish the recovery. MBBR handles variable industrial strength with less fouling risk. CAS still makes sense for very large municipal plants with land to spare. When reuse is the goal but MBR budget is short, an MBBR stage followed by a dissolved air flotation (DAF) polishing step, or CAS followed by RO, can deliver reuse-grade water at lower capital, though usually on a larger footprint and with more unit operations to coordinate.
Selection Checklist for MBR Membrane Module Buyers
Before sizing an MBR train, confirm each of these against your site data:
- Daily and peak flow (m³/day), plus influent BOD/COD/TSS/ammonia and temperature range.
- Required effluent TSS, COD, turbidity, and any pathogen or reuse targets.
- Available footprint and headroom for membrane tanks, blowers, and a CIP skid.
- Power cost per kWh at the site—MBR energy demand (1.5–2.5 kWh/m³) compounds quickly.
- Operator skill set: MBR needs membrane monitoring and CIP discipline, not sludge-wasting skill.
- Influent oil, grease, and fibre load—pretreatment or screening may be required upstream of the MBR Flat Sheet Membrane Module (DF Series).
- Discharge limits versus reuse revenue: payback for the MBR premium usually comes from reuse, not compliance alone.
Who This Guide Is For—and Who Should Look Elsewhere
This page is written for plant engineers, EPC contractors, and procurement managers comparing MBR against CAS, MBBR, or FBBR for a 50–10,000 m³/day industrial or municipal-industrial wastewater stream. If you need very high reuse quality, a small urban footprint, or pathogen-grade effluent, MBR belongs on your shortlist. If you have low-cost power, abundant land, a tight CAPEX cap, and discharge limits that CAS already meets, MBR will not pay back—stay with CAS or MBBR. Send us your daily flow, influent profile, and target effluent quality and we will size a package against your numbers.
Frequently Asked Questions
What is the lifespan of an MBR membrane module?
An MBR membrane module typically lasts 5–7 years when operators follow a consistent CIP schedule every 30–90 days and run adequate pre-treatment for oil, grease, and fibre. For a step-by-step protocol, see our 7-step industrial maintenance protocol for submerged MBR systems.
Is MBR better than MBBR for industrial wastewater?
MBR wins on effluent quality (sub-1 NTU turbidity, near-complete TSS removal) and on footprint (0.1–0.3 m²/kL/day). MBBR wins on energy (0.8–1.2 kWh/m³ versus 1.5–2.5 kWh/m³), on CAPEX ($900–$1,600/m³/day versus $1,200–$2,000/m³/day), and on tolerance for shock loads and fibrous feeds. Choose by priority: reuse and small site favour MBR; energy cost and load variability favour MBBR.
How much does MBR maintenance cost annually?
Annual MBR maintenance runs roughly $0.15–$0.30/kL treated at 2025 chemical and labour prices, covering CIP chemistry, operator time for flux and pressure monitoring, and a reserve contribution toward the 5–7 year membrane replacement. Costs move up with grease, hardness, or salinity in the feed, and down with good screening upstream.
Can MBR replace CAS completely?
Yes on performance—MBR delivers better effluent on 40–60% less land. Whether it should replace CAS is a lifecycle economics call: MBR's higher CAPEX ($1,200–$2,000 versus $800–$1,400 per m³/day) and OPEX ($0.40–$0.70 versus $0.30–$0.50 per kL) are recovered only when reuse value, land cost, or discharge strictness make the premium worthwhile.
Do MBR systems require skilled operators?
MBR needs less daily sludge-handling skill than CAS, but it does need operators who can read transmembrane pressure trends, dose CIP chemicals on schedule, and respond to flux decline before it becomes irreversible fouling. Detailed selection criteria and module specifications sit in our MBR membrane module manufacturer technical specs and selection guide.
Ready to size an MBR train against your flow and effluent target? Request a free quote and our process team will return a sized proposal with CAPEX, OPEX, and membrane replacement schedule.