MBR vs MBBR at a Glance: How They Actually Differ
The single mechanical difference between these two technologies is how biomass gets separated from the treated water, and that one difference drives every downstream trade-off you'll see in this article. An MBR couples a conventional activated-sludge tank with submerged PVDF ultrafiltration membranes at 0.1–0.4 μm pore size — solids are filtered physically, not settled by gravity. The DF series flat sheet MBR membrane module uses 0.1 μm PVDF in a submerged cassette, so MLSS can be pushed to 8,000–12,000 mg/L without losing the biomass to washout. An MBBR keeps the conventional final clarifier and instead adds free-floating HDPE carriers (typically 30–67% volumetric fill) that host a fixed biofilm; the bulk liquid MLSS stays at 2,000–4,000 mg/L because the bacteria are doing their work attached to the carriers, not suspended.
The practical consequence is decisive: MBR effluent quality is decoupled from sludge settleability, so a bulking sludge event that would tank a CAS or MBBR plant simply does not affect MBR permeate. MBBR effluent, by contrast, still rides on the back of a working final clarifier or DAF. Springer 2017 work on UCT-MBR vs IFAS-UCT-MBR confirmed that hybrid biofilm-plus-membrane configurations outperform either pure MBR or pure IFAS on simultaneous carbon and nitrogen removal at C/N ratios of 5 and 10 mgCOD/mgN, with the lowest N₂O emissions observed in the hybrid configuration (source: Springer 2017, conference series Frontiers International Conference on Wastewater Treatment and Modelling). For a full packaged biological step, the integrated MBR membrane bioreactor system arrives factory-skidded with cassette modules, blowers, and a CIP panel in a single footprint.
Effluent Quality Side-by-Side: Which One Actually Hits Reuse Specs?
For industrial reuse, effluent numbers matter more than biology. MBR permeate from a well-operated submerged system consistently clears reuse thresholds for RO feed, cooling-tower makeup, and most boiler-feed polishing loops in a single step. MBBR clarified overflow sits in the 20–80 mg/L TSS range and almost always needs a downstream solids-polish step to reach reuse-grade TSS. The Fluor technical note on MBR vs MBBR for industrial treatment claims MBBR offers "high efficiency and low energy consumption" but stops short of naming any reuse threshold — that gap is exactly what the table below fills (per Fluor comparison, undated).
| Parameter | MBR typical effluent | MBBR typical effluent | Reuse target hit directly? |
|---|---|---|---|
| BOD₅ | <5 mg/L | 10–20 mg/L | MBR yes; MBBR with DAF/sand filter |
| COD | <50 mg/L | 50–120 mg/L | MBR yes for RO feed; MBBR needs polish |
| TSS | <5 mg/L | 20–80 mg/L | MBR yes; MBBR needs UF or DAF |
| Turbidity | <1 NTU | 5–30 NTU | MBR yes; MBBR needs polish |
| NH₃-N | <1 mg/L | <5 mg/L | MBR yes; MBBR usually yes at 25 °C+ |
| TN | <10 mg/L (with pre-anoxic) | 10–20 mg/L | Both feasible; MBR more consistent |
| Oil & grease | <5 mg/L (post-DAF) | 10–30 mg/L (post-DAF) | Both require upstream oil removal for high-oil streams |
| TDS / silica | No removal | No removal | Both need RO downstream |
Numbers above are drawn from submerged MBR operating data and the DF series flat sheet MBR membrane module spec; MBBR ranges are typical for 40–60% carrier fill and 6–8 h HRT. If the reuse target demands TDS or silica reduction — true boiler makeup at >40 bar, or semiconductor rinse water — neither technology touches those; RO is mandatory downstream regardless of the biological step chosen (per standard RO feed guidelines and the 2026 industrial reuse spec sets used in RO vs NF cost comparison for 2026).
Footprint, Retrofitting, and Civil Works: Which One Fits the Site?
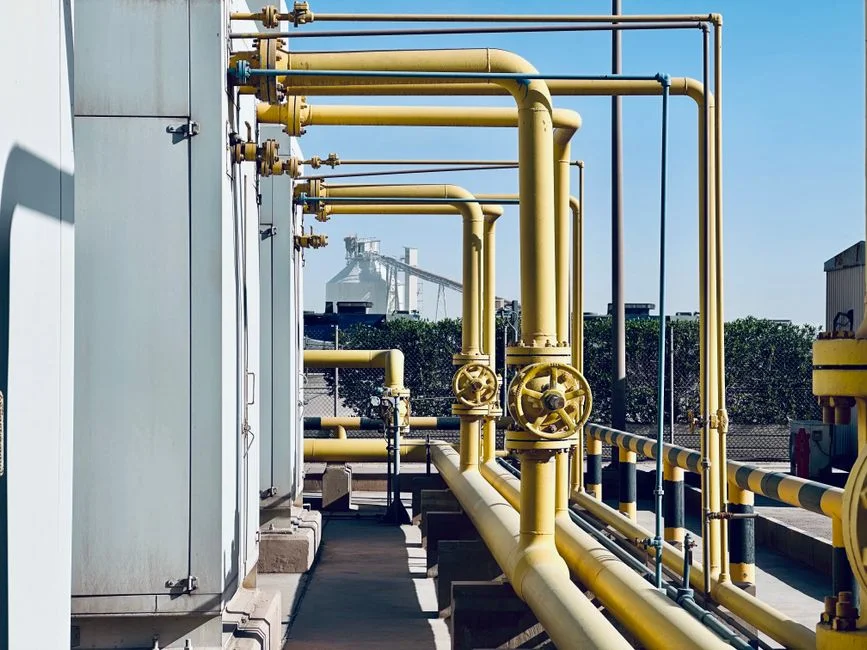
An MBR footprint runs roughly 40% of an equivalent CAS plant with tertiary clarifier, because the membrane tank replaces the clarifier and a polishing step (source: submerged MBR product spec, 2026). On a tight urban-industrial-park site or a brownfield with no spare land, that 60% footprint reduction usually justifies MBR's higher unit CAPEX. The trade-off is that MBR still needs a dedicated membrane tank, permeate suction piping, and a back-pulse or CIP skid — it is not a drop-in.
MBBR is a civil contractor's favorite for retrofits. Carriers are poured into an existing aeration basin, screens are added on the outlet, and the final clarifier is reused or upgraded. For textile mills, legacy chemical plants, and old municipal works with oversized aeration tanks, this cuts civil CAPEX by an estimated 40–60% versus greenfield (Zhongsheng field experience, 2025–2026). If the plant also needs to drop TSS before discharge, a small DAF pre-treatment system downstream of the MBBR handles the rest in a compact skid. For greenfield sites that want to leave room for anaerobic MBR or forward-osmosis MBR upgrades, the Springer 2022 chapter on novel MBR configurations (anaerobic MBR, FO-MBR) is worth a read for future-proofing.
Operating Cost Reality: Energy, Membranes, and Chemicals
Energy is where MBBR visibly wins. MBR plants draw 0.6–1.2 kWh/m³ because membrane aeration alone accounts for roughly 70% of MBR power — the coarse-bubble scour below the cassettes cannot be throttled without fouling. MBBR plants run 0.3–0.5 kWh/m³ because the carriers self-agitate and only process aeration is needed. The flat-sheet submerged configuration in the DF module is still 10–20× more energy-efficient than legacy cross-flow MBR, but MBR remains the heavier consumer against MBBR (per DF module design data, 2026). At $0.08–0.12/kWh industrial tariffs, the energy gap translates to roughly $0.04–0.10/m³ OPEX in MBBR's favor on a 1,000 m³/day plant.
Membrane replacement is the line item MBBR simply does not have. PVDF submerged modules last 5–8 years in well-operated industrial plants, with replacement running 15–25% of initial membrane CAPEX per cycle. MBBR carriers last 10–15 years and rarely need bulk replacement. MBR chemical OPEX covers NaOCl recovery cleaning 2–4× per year, citric acid for inorganic scale, and occasional anti-foam — typically $0.02–0.05/m³. MBBR chemical OPEX is mostly defoamer if foaming occurs, often below $0.01/m³. Sludge handling favors MBBR: biofilm SRT is decoupled from HRT, so yield is lower and waste-activated-sludge volume is typically 20–30% less than MBR at the same loading.
| OPEX line item | MBR (submerged PVDF) | MBBR (40–60% fill) |
|---|---|---|
| Energy | 0.6–1.2 kWh/m³ | 0.3–0.5 kWh/m³ |
| Membrane / carrier replacement | PVDF modules every 5–8 yr (15–25% of membrane CAPEX) | Carriers 10–15 yr, rarely replaced |
| Cleaning chemicals | NaOCl + citric acid, $0.02–0.05/m³ | Minimal; defoamer only |
| Sludge hauling | Higher WAS volume at MLSS 10,000 mg/L | 20–30% less WAS via biofilm SRT |
| Labor / instrumentation | Higher (TMP, CIP, integrity testing) | Lower (carriers, DO, biomass) |
For plants that plan to push permeate into a high-pressure boiler or a pharma reuse loop, the industrial RO system downstream needs SDI <3, which only MBR reliably delivers without intermediate UF.
CAPEX Ranges: What Industrial Plants Actually Pay in 2026
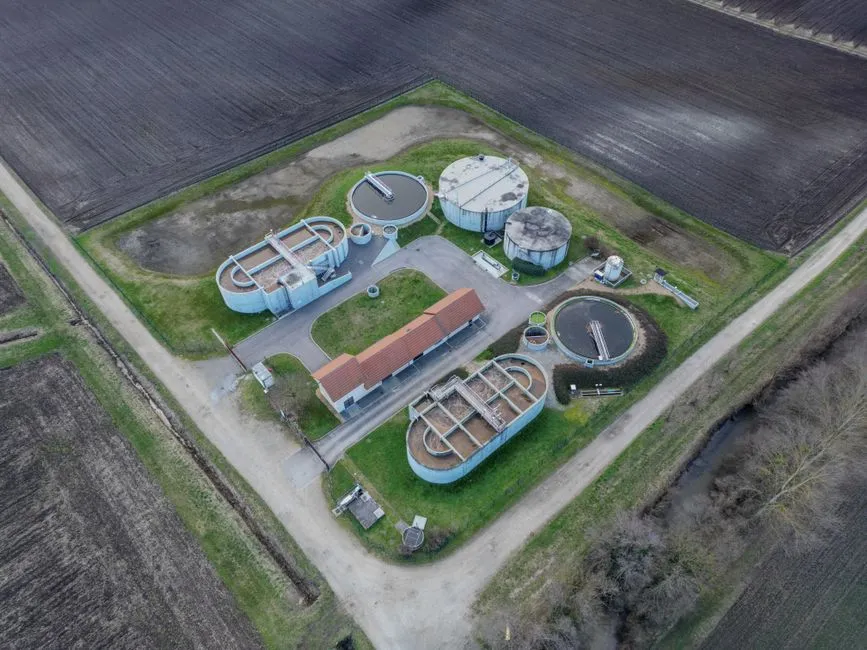
Procurement wants numbers in $/m³/day of design flow, not $/m³ treated — that's the convention for equipment comparison because it normalizes across operating hours. For 2026 industrial turnkey systems in the 100–1,000 m³/day range, the equipment-only CAPEX (membranes or carriers, blowers, pumps, controls, skid packaging) runs $1,200–$2,200/m³/day for MBR and $650–$1,200/m³/day for MBBR. MBBR carrier media alone is $80–$150/m³ of reactor volume at 2026 polymer prices. Civil works, installation, and commissioning typically add 30–50% on top of equipment CAPEX, and that multiplier is what flips the decision on brownfield sites (Zhongsheng 2026 project data, 100–1,000 m³/day range).
| Design flow | MBR CAPEX (equipment, $/m³/day) | MBBR CAPEX (equipment, $/m³/day) | Notes |
|---|---|---|---|
| <100 m³/day | $2,000–$2,500+ | $900–$1,300 | MBR skid-packaging overhead dominates; MBBR scales linearly |
| 100–1,000 m³/day | $1,200–$2,200 | $650–$1,200 | Typical industrial reuse window |
| 1,000–5,000 m³/day | $900–$1,500 | $550–$900 | MBR membrane bulk pricing improves |
| >5,000 m³/day | $700–$1,100 | $450–$750 | Gap narrows; civil cost dominates both |
| Retrofit MBBR into existing basins | — | 30–50% of greenfield MBBR | Civil CAPEX near zero if aeration basin exists |
For the dairy and food industries, the comparable MBR economics are detailed in MBR for dairy wastewater design in 2026; the flux-rate and CAPEX-per-kg-COD-removed tables there are the same numbers that hold for food and beverage reuse loops.
When to Choose MBR, When to Choose MBBR: A Decision Framework
Use the table below as a rule, not a guideline. If two or more rows match your project, that row wins.
| If your project looks like this… | Choose… | Why |
|---|---|---|
| Reuse is the explicit goal; RO feed required; footprint constrained; TSS <10 mg/L 24/7 | MBR + RO | Single-step reuse-quality effluent; no tertiary polish |
| Budget is the binding constraint; existing aeration basins available; hydraulic shock loads common; nitrification is the main goal | MBBR (possibly with DAF) | Lowest CAPEX; no membranes to foul on shock loads |
| Reuse upgrade plausible but not yet funded | MBBR + UF/RO polish (deferred) | MBBR carries today's load; polishing skidded in later |
| Boiler makeup, pharma process water, semiconductor rinse | MBR + RO (with EDI for HP boiler) | Ultra-pure permeate, 95% RO recovery per spec |
| High oil & grease (>50 mg/L influent) | DAF → MBR | Oil fouls PVDF irreversibly; pre-polish with a DAF pre-treatment system |
| Discharge compliance only, <10 mg/L TSS not required | MBBR | No reuse polish step; minimum CAPEX |
| Variable C/N ratio, simultaneous C and N removal | IFAS / MBBR-augmented-MBR | Springer 2017 evidence of highest removal at C/N 5 and 10 |
For ZLD roadmaps on PCB or similar complex streams, the ZLD engineering blueprint with cost breakdown walks through the MBR + RO + evaporator stack. MBBR alone is not a ZLD pretreatment.
Three Real Industrial Scenarios Where the Choice Changes
Textile dyeing, 800 m³/day, RO downstream for process-water reuse. Dye bath dumps cause COD and color spikes of 2–3× the daily average. An MBBR clarifier would carry color into the RO feed and foul the RO membranes prematurely. MBR with submerged PVDF holds TSS <5 mg/L and turbidity <1 NTU through the spike, protecting the RO. Equipment CAPEX lands near $1.4–1.8M; OPEX ~$0.18–0.25/m³ including RO CIP.
Food processing, 300 m³/day, ±40% seasonal load swings, discharge compliance only. No reuse target, no RO. The plant has two existing 600 m³ aeration basins oversized for the current load. MBBR with carriers at 50% fill in the existing basins handles the swing, hits BOD <20 mg/L and TSS <60 mg/L, and clears the local discharge consent. Retrofit CAPEX ~$250–400k, roughly 35% of a greenfield MBBR.
Pharma API, 500 m³/day, tight COD and toxicity limits, future ZLD roadmap. Solvent traces and toxicity variability make this a hard feed for biofilm carriers. MBR + RO + evaporator polish hits the 99.9% recovery benchmark the ZLD blueprint targets (see the ZLD engineering blueprint with cost breakdown for the recovery math). Equipment CAPEX ~$2.5–3.5M including RO and evaporator; OPEX $0.45–0.65/m³ dominated by thermal energy. All three scenario flows sit inside the integrated MBR membrane bioreactor system capacity range of 10–2,000 m³/day.
Frequently Asked Questions
Which is better for industrial wastewater reuse, MBR or MBBR? MBR is the better answer when reuse is the project goal. Submerged PVDF membranes deliver TSS <5 mg/L, turbidity <1 NTU, and COD <50 mg/L in a single step (per the effluent table above), which is reuse-ready. MBBR effluent at 20–80 mg/L TSS almost always needs a downstream DAF, sand filter, or UF polish to reach the same threshold.
How do MBR and MBBR compare on CAPEX and OPEX? MBR CAPEX runs $1,200–$2,200/m³/day in 2026 for 100–1,000 m³/day industrial plants, with PVDF membrane replacement every 5–8 years. MBBR CAPEX is $650–$1,200/m³/day, energy is 0.3–0.5 kWh/m³ versus MBR's 0.6–1.2 kWh/m³, and there is no membrane replacement line. Civil CAPEX can flip the decision on brownfield sites.
Can MBR and MBBR be combined? Yes. IFAS (Integrated Fixed-film Activated Sludge) and biofilm-augmented MBR are documented in the Springer 2017 UCT-MBR vs IFAS-UCT-MBR study, which reported the highest carbon and nutrient removal in the hybrid configuration at both C/N=5 and C/N=10, with the lowest N₂O emissions.
How long do MBR membranes last in industrial service? PVDF submerged modules in well-operated industrial plants last 5–8 years. The range depends on influent oil & grease, CIP discipline, and whether a DAF precedes the membrane tank to keep oil below 5 mg/L.
What pretreatment do I need before RO for zero liquid discharge? MBR effluent is the standard RO feed for ZLD because it holds SDI <3 consistently. MBBR effluent typically requires an intermediate UF or DAF before RO to keep the SDI in range; skipping that step is the most common cause of premature RO fouling on MBBR-based reuse trains.