What Drives Phosphorus Cost for Plant Upgrades?
Typical phosphorus cost runs $42–$61 per pound of P removed, with annual CAPEX plus OPEX of $1.2M–$4.8M at 10–50 MGD (EPA Maumee Watershed TMDL data, 2024). Chemical trains need about $0.5M–$2M CAPEX and $150K–$600K/year OPEX. EBPR cuts chemical use 30–50% but needs more footprint. Hybrid chemical-plus-DAF often saves 20–30% when TSS exceeds 500 mg/L.
Regulatory pressure is the main reason phosphorus cost keeps climbing in 2025. The EPA Maumee Watershed TMDL (2024) sets Total Phosphorus (TP) limits as low as 0.5–1.0 mg/L for plants above 10 MGD. Fines for exceeding those limits now average $50,000 to $200,000 per year per facility. The same squeeze shows up overseas. In China, GB 31573-2025 industrial TP limits moved toward 0.5 mg/L from 1.0 mg/L in 2020, pushing upgrades at roughly 60% of chemical and petrochemical plants still on aging trains. Teams also need regional compliance strategies for phosphorus discharge limits before nutrient loading penalties hit the budget.
A 20 MGD food plant in Ohio shows the cash impact. Influent P spikes above 15 mg/L during peak production produced $1.2M in cumulative fines over 24 months. After a chemical precipitation retrofit with Dissolved Air Flotation (DAF), effluent TP fell to 0.4 mg/L while high-strength organics stayed manageable. Hidden costs still showed up: alum sludge landfill fees ran $120–$200 per ton, and ferric chloride storage needed another $50,000 CAPEX for corrosion-resistant, double-walled tanks. Most plants we size for 10–30 MGD run chemical dosing at the lower end of the published range until peak seasons force a second dosing point.
Phosphorus Removal Methods Compared: Chemical vs Biological vs Physical Systems
Chemical precipitation remains the default industrial phosphorus removal path because it is reliable and capital-light. Operators dose metal salts—alum or ferric chloride—to form insoluble metal-phosphate solids. Engineering benchmarks from the EPA (2024) point to 80–150 mg/L alum to remove about 1 mg/L of P, depending on influent alkalinity. Alum works best at pH 5.5–6.5; ferric chloride stays effective from pH 6.0 to 7.0. The trade-off is sludge: each kilogram of phosphorus removed adds about 0.5 to 1.0 kg of dry sludge.
Enhanced Biological Phosphorus Removal (EBPR) uses Phosphorus Accumulating Organisms (PAOs) in A/O or A2O trains. PAOs take up phosphorus at 0.05–0.15 mg P/mg VSS when the process is healthy. EBPR cuts chemical spend, but it fails when the influent BOD:P ratio drops below 20:1 unless acetate or another carbon source is added. For high-solids industrial streams, DAF systems for colloidal phosphorus removal often sit downstream to catch particulate phosphorus biology misses. Those DAF units use 30–50 μm microbubbles at 5–10 m/h surface loading and routinely deliver 90–95% TSS removal.
| Technology | Removal Mechanism | Best For... | Key Limitation |
|---|---|---|---|
| Chemical Precipitation | Metal salt complexation | High-P influents, retrofits | High sludge volume |
| EBPR (A/O, A2O) | Biological luxury uptake | Low-P influents, large plants | Sensitivity to BOD:P ratio |
| DAF (Physical) | Microbubble flotation | High-TSS, colloidal P | Requires chemical pre-treatment |
| Hybrid (EBPR + DAF) | Bio-uptake + Polishing | Ultra-low limits (< 0.1 mg/L) | Highest CAPEX |
Hybrid trains are winning more industrial bids. Pairing PLC-controlled chemical dosing for precise phosphorus precipitation with downstream DAF or tertiary filtration can cut chemical use about 30% versus standalone precipitation. That layout also gives redundancy when influent swings, which matters when the permit sits at 0.5 mg/L TP under modern TMDL programs.
CAPEX Breakdown: How Plant Size and Technology Impact Upfront Costs
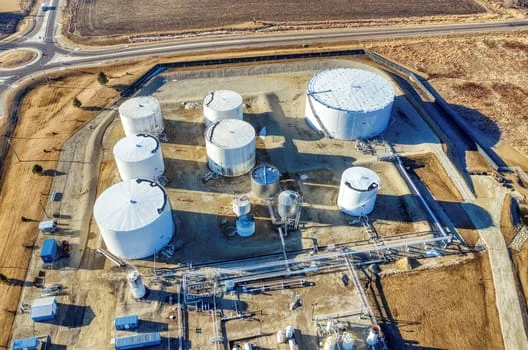
Capital spend that shapes phosphorus cost scales non-linearly with flow and effluent quality. For a 10 MGD plant, chemical precipitation usually costs $0.5M–$0.8M for storage, dosing pumps, rapid mixers, and clarifier tweaks. An EBPR train for the same flow often exceeds $1.2M because anaerobic zones, recycle pumps, and aeration controls add civil and mechanical scope. EBPR footprints run 40–60% larger than chemical systems, which can force land or site-prep spend most owners underestimate.
| Plant Size (MGD) | Chemical System CAPEX | EBPR System CAPEX | Hybrid (DAF + Chem) CAPEX |
|---|---|---|---|
| 10 MGD | $0.5M – $0.8M | $1.2M – $1.8M | $0.8M – $1.1M |
| 20 MGD | $0.9M – $1.3M | $2.1M – $2.9M | $1.4M – $1.9M |
| 30 MGD | $1.4M – $2.0M | $3.2M – $4.1M | $2.2M – $2.8M |
| 50 MGD | $2.2M – $3.1M | $4.8M – $6.2M | $3.5M – $4.6M |
Retrofitting existing tanks usually costs 30–50% less than greenfield construction. Adding a secondary chemical dosing point on an existing secondary clarifier is often enough to move from 1.0 mg/L to 0.5 mg/L TP. Ultra-low targets below 0.1 mg/L need tertiary cloth filters or DAF, which pushes the project into the hybrid CAPEX band. SCADA integration typically adds another 5–10% to equipment cost on industrial sites.
OPEX Deep Dive: Chemical Costs, Sludge Disposal, and Energy Consumption
Operating cost is where low-CAPEX chemical systems often lose ground. Chemical prices moved sharply through 2024 and 2025 on supply shocks and export limits. Alum trades around $300–$500 per ton; ferric chloride runs $400–$700 per ton. Lime looks cheap at $100–$200 per ton, yet higher sludge mass and handling labor erase that advantage at many smaller plants.
Sludge disposal is the largest OPEX swing factor. Alum sludge is usually non-hazardous but still carries $120–$200 per ton landfill fees. Ferric sludge can tip into hazardous classification when heavy metals co-precipitate, pushing disposal above $250 per ton. Plants fighting that line item invest in sludge dewatering to reduce disposal costs by 40–60%. Raising cake solids from 2% to 25% or higher cuts the tonnage hauled to landfill fast.
| OPEX Category | Chemical Precipitation | EBPR | Hybrid (DAF + Chem) |
|---|---|---|---|
| Chemicals ($/yr) | $150K – $400K | $20K – $50K | $80K – $180K |
| Energy (kWh/m³) | 0.05 – 0.10 | 0.30 – 0.50 | 0.15 – 0.25 |
| Sludge Disposal | High ($$$) | Low ($) | Moderate ($$) |
| Labor (hrs/week) | 2 – 4 | 8 – 12 | 4 – 6 |
EBPR energy is mostly aeration in oxic zones at 0.3–0.5 kWh/m³. DAF recycle pumps typically draw 0.1–0.2 kWh/m³. A 30 MGD plant that shifted from alum alone to ferric chloride plus DAF cut total OPEX about 25% by lowering dose and producing a more dewaterable sludge. That chemical-physical interface is where most industrial operators we audit find the next durable savings.
How Much Does Doubling Solids Content Save?
Doubling solids content with a thickener or filter press can cut hauled sludge mass about 40–60% when cake dryness moves from roughly 2% toward 25–40%. At landfill fees of $120–$200 per ton, that step often pays for dewatering hardware in under 18 months when disposal volume is already high. The cost savings calculator is simple: compare wet tons hauled before and after, then subtract press power and polymer at plant-specific unit prices.
ROI Calculator: How to Justify Your Phosphorus Treatment Upgrade
Procurement teams win capital approval with a clear payback story. Fine avoidance and OPEX reduction drive most phosphorus ROI cases. For a 20 MGD plant with 5 mg/L influent P and a 0.5 mg/L target, moving from a failing biological train to a chemical + DAF hybrid often lands near a 3.2-year payback. If the site also treats metals or other toxics, a cost comparison for other industrial wastewater contaminants can show whether a shared pretreatment train raises consolidated ROI.
ROI Calculation Formula:
ROI (%) = [(Annual Fine Avoidance + OPEX Savings) / Total CAPEX] x 100
| Input Variable | Baseline (No Upgrade) | Upgraded System (Hybrid) |
|---|---|---|
| Annual Compliance Fines | $150,000 | $0 |
| Annual Chemical Cost | $50,000 (Inefficient) | $110,000 (Optimized) |
| Annual Sludge Cost | $80,000 | $45,000 (With Pressing) |
| Total Annual Cost | $280,000 | $155,000 |
Annual savings of $125,000 against a $400,000 retrofit CAPEX equals a 3.2-year payback in the table above. A 20% chemical price rise can stretch payback to about 3.8 years. Rising landfill fees—common through 2025—improve the ROI case for filter presses and thickeners even faster.
Traditional vs Compact Process: Cost Comparison
Traditional civil EBPR trains cost more up front and need 40–60% more footprint than compact chemical-plus-DAF packages at the same flow. Confined-space-free, skid-mounted dosing and flotation units shift spend from concrete to factory modules and shorten install windows. Plants short on land usually prefer compact phosphorus treatment solutions for space-constrained plants even when unit CAPEX looks higher on a spreadsheet.
Decision Framework: Which Phosphorus Removal System Is Right for Your Plant?
Technology choice should follow influent data and site constraints, not brochure claims. Use this checklist before locking a process:
- Step 1: Influent P Concentration. If P > 10 mg/L, chemical precipitation is needed as a primary or secondary stage. EBPR struggles with high-strength P peaks.
- Step 2: Discharge Limit. If the limit is < 0.1 mg/L, specify a hybrid system (EBPR + chemical polishing or Chemical + DAF/Filtration).
- Step 3: Footprint Availability. If land is expensive or unavailable, avoid EBPR. Chemical systems and DAF load higher and occupy less area.
- Step 4: BOD:P Ratio. If the ratio is < 20:1, EBPR needs costly carbon supplementation, so chemical systems usually win.
- Step 5: Sludge Disposal Sensitivity. If landfill costs exceed $200/ton, prioritize EBPR or high-performance dewatering to control OPEX.
Field patterns match the checklist. A 50 MGD municipal plant with 3 mg/L influent P chose EBPR because chemical mass at that scale dominated OPEX. A 2 MGD chemical plant with 20 mg/L influent P selected chemical + DAF because toxic spikes made EBPR unstable. A food plant chasing 0.05 mg/L TP used three stages: EBPR for bulk removal, chemical polishing, then DAF for final solids capture.
Who This Is For / Next Step
Plant engineers, EPC contractors, and procurement managers sizing phosphorus upgrades for 10–50 MGD industrial or municipal flows are the primary readers. Facilities already meeting <0.1 mg/L TP with stable EBPR and low sludge fees can stay put. If you need a CAPEX/OPEX screen for your flow and permit limit, send the influent profile through our phosphorus treatment quote request and we will map chemical, EBPR, and hybrid options against payback.
Frequently Asked Questions
What is the most cost-effective phosphorus removal method for a 10 MGD plant with 8 mg/L influent P?
Chemical precipitation with alum is usually the lowest-cost path for that profile. Unit cost typically lands at $45–$55 per pound of P removed when alum dose and sludge handling stay controlled. Payback versus non-compliance and high-CAPEX biological options often sits near 2.8 years for 10 MGD industrial plants.
How does pH affect chemical phosphorus removal efficiency?
pH controls precipitate stability and dose efficiency. Alum performs best at pH 5.5–6.5; ferric chloride prefers pH 6.0–7.0. Running outside those windows can raise chemical consumption by up to 40% for the same TP target, which shows up quickly in monthly OPEX reports.
Can DAF systems remove dissolved phosphorus?
No. DAF is a physical separator for particulate and colloidal phosphorus only. Dissolved P must first be converted to a settleable or floatable floc by chemical precipitation, after which DAF can float and remove that solids mass at 5–10 m/h loading rates.
What are the hidden costs of EBPR?
Beyond higher CAPEX, EBPR often needs fermentation capacity for volatile fatty acids, more operator training, and a standby chemical dose skid for process upsets. Those items are easy to omit from early estimates and then appear during commissioning when BOD:P ratios swing.
How do I reduce sludge disposal costs for phosphorus treatment?
High-pressure dewatering is the fastest lever. A plate and frame filter press can raise cake dryness to 30–40%, cutting disposal mass about 40–60% and trimming landfill plus haul fees in the same proportion when wet sludge starts near 2% solids.