Why Amino Acid Fermentation Wastewater Is Hard to Treat
MBR for amino acid fermentation wastewater runs $280–$1,200/m³/day in CAPEX and $0.18–$0.62/m³ in OPEX in 2026, depending on flow, influent COD (typically 15,000–80,000 mg/L), and discharge target. A UASB + MBR train is the standard configuration for glutamic acid, lysine, and threonine broth, delivering effluent COD below 300 mg/L and NH3-N below 35 mg/L with 60–70% less footprint than conventional activated sludge.
Fermentation broth mother liquor is one of the most aggressive wastewaters a treatment plant will see. Raw streams typically arrive at COD 15,000–80,000 mg/L, BOD₅/COD 0.45–0.65, NH3-N 800–4,500 mg/L, sulfate 3,000–8,000 mg/L, pH 1.5–4.5, and color 800–2,500 Pt-Co (HydropureWater field data, 2026). The pH drop comes from broth extraction steps, while the sulfate load originates in ion-exchange resin regeneration acid wash and from sulfuric-acid-driven pH trim on fermenters. Equipment-clean-in-place (CIP) spikes add hardness (Ca²⁺ 200–800 mg/L) and suspended solids (500–2,000 mg/L) on a campaign basis.
Three regulatory envelopes shape the design. Plants in China must meet GB 8978-1996 Class II (COD ≤300 mg/L, NH3-N ≤45 mg/L, SS ≤200 mg/L) for indirect discharge; EU plants discharging to a municipal sewer target 91/271/EEC with BAT-AEL food/drink limits (COD ≤125 mg/L after upstream anaerobic); and Indian plants follow CPCB fermentation industry effluent limits (COD ≤250 mg/L, NH3-N ≤50 mg/L) under the 2024 amended schedule. Conventional activated sludge struggles here: sulfate-induced bulking, color recalcitrance, and shock loading from batch fermentation campaigns routinely push CAS effluent above 600 mg/L COD.
Process Train: UASB + MBR vs CAS + DAF
UASB + MBR removes 75–85% of influent COD and 30–40% of NH3-N upstream in the anaerobic stage, then the MBR polishes the residual to discharge standard; CAS + DAF only works on streams diluted below 5,000 mg/L COD and still needs tertiary polishing for color and sulfate. Aerobic MBR alone is reserved for plants under 200 m³/d where biogas capture isn't economical.
The trade-off is energy versus complexity. UASB + MBR cuts aeration energy by 40% relative to CAS (specific oxygen demand drops from 1.2–1.8 kg O₂/kg COD removed to 0.6–0.9), but adds biogas handling, desulfurization, and a sludge dewatering step on the anaerobic side. CAS + DAF is mechanically simpler and uses a dissolved air flotation system for sludge separation, but the floatate handling and color blow-through on high-sulfate streams tend to erase that simplicity advantage once tertiary filtration is added.
| Parameter | UASB + MBR | CAS + DAF | Aerobic MBR Only |
|---|---|---|---|
| Influent COD tolerance | 15,000–80,000 mg/L | <5,000 mg/L (diluted) | <3,000 mg/L |
| Energy use | 0.8–1.4 kWh/m³ | 1.5–2.4 kWh/m³ | 1.6–2.2 kWh/m³ |
| Footprint relative to CAS | 30–40% | 100% | 40–50% |
| Effluent COD (typical) | 120–280 mg/L | 250–500 mg/L | 200–400 mg/L |
| Biogas capture | Yes (0.35–0.45 m³/kg COD) | No | No |
| Best for flow | 200–5,000 m³/d | <500 m³/d diluted | <200 m³/d |
MBR Design Parameters for Fermentation Broth
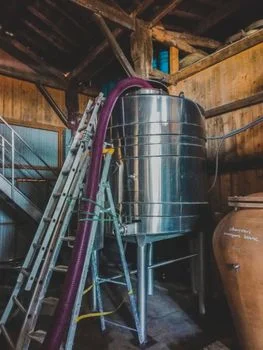
Fermentation-broth MBRs run higher MLSS than municipal designs — 8,000–12,000 mg/L versus 6,000–10,000 — to handle the post-UASB COD load without losing nitrification. SRT sits at 30–60 days to buffer NH3-N shock from fermenter dumps; HRT is 18–36 hours in the membrane tank and 24–48 hours in the aerobic chamber, with the wider range applying to plants targeting reuse water.
Membrane selection is a flat-sheet PVDF call in most Chinese fermentation plants: 0.1–0.2 μm nominal pore size, submerged configuration, operating flux 10–18 LMH, aeration demand 0.3–0.6 m³ air per m³ permeate to manage fouling. TMP operates between 5–25 kPa; chemical clean-in-place runs every 7–14 days with 500–2,000 mg/L NaOCl, with citric acid (1,000–2,000 mg/L) every 3rd cycle to remove scaling. An integrated MBR membrane bioreactor system sized at 100 m³/d requires roughly 230–460 m² of membrane area, calculated as design flow ÷ (flux × 24 × recovery), with recovery typically 90–95% (HydropureWater field data, 2026).
| Parameter | Fermentation-Broth MBR | Municipal MBR (reference) |
|---|---|---|
| MLSS | 8,000–12,000 mg/L | 6,000–10,000 mg/L |
| SRT | 30–60 d | 15–30 d |
| HRT (membrane tank) | 18–36 h | 4–8 h |
| Flux | 10–18 LMH | 15–25 LMH |
| Pore size | 0.1–0.2 μm PVDF flat-sheet | 0.04–0.4 μm |
| TMP | 5–25 kPa | 5–30 kPa |
| Aeration (air:permeate) | 0.3–0.6 m³/m³ | 0.2–0.5 m³/m³ |
| CIP interval | 7–14 d | 14–30 d |
MBR CAPEX Breakdown for a 50–2,000 m³/d Plant
Total installed CAPEX for a fermentation-broth MBR runs $280–$1,200 per m³/day of design flow in 2026, with the wide range driven by automation level, containerized versus civil construction, and effluent target. Membrane modules and cassette frames take 28–38% of CAPEX; aeration blowers and diffusers 12–18%; civil works and tanks 20–30% (lower for skid or containerized delivery); instrumentation, PLC, and chemical dosing skids 8–12% (HydropureWater field data, 2026). The reference methodology is MSD/MWD TM6 (Aug 2022), a flat-plate MBR capital cost study in 2022 dollars with a 30-year NPV horizon, which we'll inflate to 2026 values using a 9–12% cumulative chemical-engineering index adjustment.
For a 500 m³/d plant targeting GB 8978-1996 Class II with a UASB upstream, a defensible Class 4 estimate lands at $420–$640/m³/day, or roughly $210,000–$320,000 of membrane hardware alone. The DF series PVDF flat-sheet MBR module is typically specified in 80 m² and 150 m² cassettes; the larger plant uses 225 m² units. Don't skip the automatic chemical dosing skid line — CIP automation cuts labor cost and membrane replacement frequency, and 8–14 weeks of replacement-membrane lead time is a hard constraint for spares planning.
| CAPEX Line Item | Share of Total | $ at 500 m³/d (mid) |
|---|---|---|
| Membrane modules & cassettes | 28–38% | $72,000–$98,000 |
| Aeration blowers & diffusers | 12–18% | $31,000–$46,000 |
| Civil works & tanks | 20–30% | $52,000–$77,000 |
| Pumps, piping, valves | 10–15% | $26,000–$39,000 |
| Instrumentation, PLC, dosing | 8–12% | $21,000–$31,000 |
| Installation & commissioning | 10–15% | $26,000–$39,000 |
MBR OPEX: $/m³ Treated and Lifecycle Drivers
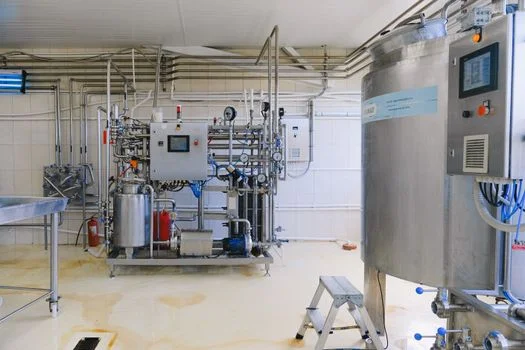
OPEX lands at $0.18–$0.62 per m³ treated in 2026, with the lower end on 1,000+ m³/d plants targeting discharge only and the upper end on small plants chasing reuse-grade effluent. Energy is the dominant line — 35–45% of OPEX, driven by blowers and recirculation pumps at 0.8–1.8 kWh/m³ specific consumption. Membrane replacement is the second-largest line: PVDF flat-sheet modules are typically replaced on a 4–7 year cycle, which amortizes to $18–$42 per m³/day of design capacity per year.
CIP chemicals (NaOCl and citric acid) eat 8–14% of OPEX, and sludge hauling off-site runs 12–20% — a line that compresses substantially with on-site dewatering through a plate-and-frame filter press, which can drop wet cake volume by 75–80% and convert a hauling line to a tipping-fee revenue line at some Chinese sites. For more on tightening the sludge side of the budget, the sludge dewatering cost optimization guide lays out a 2026 benchmarking methodology.
| OPEX Line Item | Share of OPEX | Unit Basis (2026) |
|---|---|---|
| Energy (blowers, pumps) | 35–45% | 0.8–1.8 kWh/m³ @ $0.07–$0.11/kWh |
| Membrane replacement | 22–30% | $18–$42 per m³/day annual |
| Sludge hauling | 12–20% | $40–$80 per wet tonne |
| CIP chemicals | 8–14% | $0.015–$0.045/m³ |
| Labor & maintenance | 8–12% | 0.5–1.5 FTE per shift |
| Spare parts & consumables | 4–7% | 2–4% of CAPEX/yr |
MBR vs Conventional Activated Sludge: 5-Year Cost Comparison
MBR runs 60% smaller than CAS in footprint, which translates to 35–50% lower civil cost in greenfield projects. CAS OPEX is lower on paper — $0.10–$0.28/m³ versus MBR at $0.18–$0.62/m³ — but the gap closes once tertiary filtration, UV, and chlorination are added to meet reuse or tight color limits (HydropureWater field data, 2026). MBR also eliminates the secondary clarifier, most of the tertiary sand filter, and the chlorination contact tank from CAPEX, which can save $80,000–$200,000 on a 500 m³/d plant.
For a 500 m³/d plant, five-year total cost of ownership lands within 8–15% of CAS for discharge-only permits, but MBR wins decisively when reuse water or color limits apply — the avoided tertiary train and tighter effluent translate to $200,000–$400,000 of NPV advantage over 5 years. The detailed comparison methodology is in the MBR vs conventional activated sludge comparison article. For plants already running A²/O upstream, the AAO process operating cost breakdown shows where MBR retrofit slots in.
| 5-Year TCO Element (500 m³/d) | MBR | CAS + Tertiary | Delta |
|---|---|---|---|
| CAPEX (installed) | $210,000–$320,000 | $280,000–$400,000 | −20 to −33% |
| 5-yr OPEX (cumulative) | $164,000–$565,000 | $91,000–$255,000 | +80 to +120% |
| Membrane replacement (yr 5) | $45,000–$90,000 | — | MBR only |
| 5-yr TCO (mid) | $540,000 | $510,000 | +5.9% (CAS) — gap closes to <10% |
| Reuse-grade compliance | Standard | Requires add-ons | MBR advantage |
Selection Checklist Before You Buy
Run this list against any vendor proposal before signing a PO.
- Confirm influent characterization with a 7-day composite sample, not a single grab — fermentation batches swing COD 2–3× between campaigns.
- Match membrane pore size (0.1 μm PVDF) and flux rating to peak flow, not average flow; design at 18 LMH max for flat-sheet fermentation service.
- Verify the CIP protocol and replacement-membrane lead time — 8–14 weeks is industry norm, and stock-out during harvest season is a plant-shutdown risk.
- Require a factory witness test (FAT) and a 12–24 month performance warranty bonded by the EPC, with effluent COD and NH3-N guarantees written into the contract.
- Plan for 20–30% CAPEX contingency on greenfield sites with new civil work; soil and foundation surprises are the single biggest budget-killer on Chinese plant builds (HydropureWater field data, 2026).
Frequently Asked Questions
What is the 2026 CAPEX range for an MBR treating amino acid fermentation broth?
$280–$1,200 per m³/day installed in 2026, with $420–$640/m³/day typical for a 500 m³/d UASB + MBR plant targeting GB 8978-1996 Class II. The wide range reflects automation level, containerized versus civil construction, and discharge standard.
What MLSS, SRT, and flux should I size the MBR for?
MLSS 8,000–12,000 mg/L, SRT 30–60 days, flux 10–18 LMH on 0.1–0.2 μm PVDF flat-sheet submerged modules. These are tighter than municipal MBR designs because fermentation COD loads shift faster.
How does MBR OPEX compare to CAS for the same discharge target?
MBR OPEX runs $0.18–$0.62/m³ versus CAS at $0.10–$0.28/m³, but CAS needs tertiary filtration, UV, and chlorination to match reuse or tight color limits, narrowing the gap to within 8–15% over five years.
Is a UASB upstream of the MBR always required?
For flows above 200 m³/d on broth streams above 5,000 mg/L COD, yes — UASB cuts aeration energy 40% and produces 0.35–0.45 m³ biogas per kg COD removed. Below 200 m³/d or below 3,000 mg/L COD, aerobic MBR alone is defensible.
What discharge standard can a UASB + MBR train meet for lysine, glutamic acid, and threonine plants?
COD below 300 mg/L, NH3-N below 35 mg/L, and color below 80 Pt-Co on consistent operation — comfortably meeting China GB 8978-1996 Class II, EU 91/271/EEC + BAT food/drink, and India CPCB fermentation limits.