Industrial Wastewater Treatment in California USA: 2026 Engineering Specs, EPA Compliance & Zero-Risk Equipment Guide
Industrial wastewater treatment in California requires compliance with EPA pretreatment standards and NPDES permits, enforced by the State Water Resources Control Board (RWQCB). Facilities must achieve effluent limits of ≤200 mg/L BOD₅, ≤250 mg/L TSS, and ≤10 mg/L oil/grease (per 40 CFR 403 and RWQCB Basin Plans). Non-compliance risks fines up to $56,000/day (EPA 2024), making zero-risk equipment selection critical for sectors like food processing, manufacturing, and data centers.
California’s Regulatory Framework: EPA Pretreatment, NPDES Permits & RWQCB Enforcement
California enforces some of the most stringent industrial discharge requirements in the United States, often exceeding federal 40 CFR 403 standards to protect sensitive groundwater basins and coastal ecosystems. Under the Industrial Pretreatment Program (IPP), the State Water Resources Control Board delegates enforcement to nine Regional Water Quality Control Boards (RWQCB), which establish "Local Limits" that are frequently more restrictive than EPA benchmarks. For example, while federal standards for copper might allow up to 1.3 mg/L, many California RWQCB Basin Plans cap copper at ≤0.4 mg/L to prevent toxicity in Publicly Owned Treatment Works (POTWs).
Compliance is tracked through National Pollutant Discharge Elimination System (NPDES) permits, which mandate Self-Monitoring Reports (SMRs). Facilities are required to perform quarterly sampling for pH, BOD₅, TSS, and heavy metals. The RWQCB utilizes these reports to trigger unannounced inspections and compliance audits. An "Audit Trigger" typically occurs when a facility exceeds 80% of its permitted limit for three consecutive months or if a single discharge event exceeds the limit by 20% or more. Enforcement actions include mandatory Corrective Action Plans (CAPs) and administrative civil liabilities that range from $10,000 to $56,000 per day of violation.
Categorical industrial users, such as electroplaters and metal finishers, face specific effluent limits under 40 CFR 433. In California, these facilities must often meet a chromium limit of ≤2.77 mg/L and a cyanide limit of ≤1.20 mg/L. Understanding EPA compliance for specialized industrial wastewater is essential for facility managers to navigate these overlapping federal and state mandates.
| Pollutant Parameter | EPA Federal Standard (40 CFR 403) | Typical California RWQCB Limit | Monitoring Frequency |
|---|---|---|---|
| BOD₅ (Biochemical Oxygen Demand) | 250 mg/L | ≤200 mg/L | Monthly/Quarterly |
| TSS (Total Suspended Solids) | 300 mg/L | ≤250 mg/L | Monthly/Quarterly |
| Oil & Grease (FOG) | 100 mg/L | ≤10 mg/L | Weekly/Monthly |
| Copper (Total) | 1.3 mg/L | ≤0.4 mg/L | Quarterly |
| Chromium (Total) | 2.77 mg/L | ≤1.0 mg/L (Region 4/9) | Quarterly |
| pH Range | 5.0 – 9.0 | 6.0 – 9.0 | Continuous/Daily |
The regulatory framework in California is stringent, with the RWQCB enforcing Local Limits that often exceed federal standards. This has significant implications for facilities, which must carefully monitor their effluent to avoid non-compliance and associated fines.
Industrial Wastewater Treatment Technologies: Process Parameters & California-Specific Use Cases
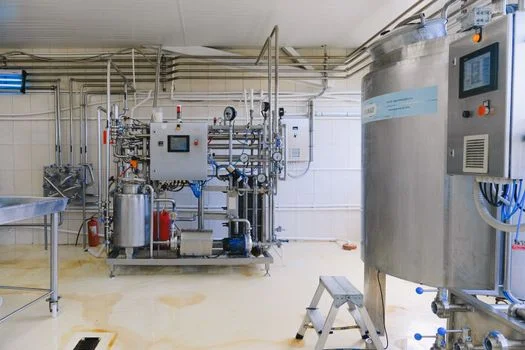
Selecting the appropriate treatment technology in California depends heavily on whether the goal is simple pretreatment for sewer discharge or high-level reclamation for Title 22 water reuse. Membrane Bioreactor (MBR) systems have become the gold standard for facilities in water-stressed regions like the Central Valley and Southern California. These systems operate with a Hydraulic Retention Time (HRT) of 4–8 hours and maintain a Mixed Liquor Suspended Solids (MLSS) concentration of 8,000–12,000 mg/L. By utilizing a membrane flux of 15–25 LMH, MBR systems for California’s Title 22 reuse standards produce effluent with turbidity <0.2 NTU and pathogen removal rates of 99.99%, making the water suitable for cooling towers or irrigation.
For industries dealing with high organic loads, such as food processing and dairy, Dissolved Air Flotation (DAF) is the primary physical-chemical solution. DAF systems utilize micro-bubbles (30–50 μm) to float Fats, Oils, and Grease (FOG) and suspended solids to the surface for mechanical skimming. In California applications, DAF systems typically operate at a hydraulic loading rate of 5–10 m³/m²·h. Implementing DAF systems for FOG and TSS removal in food processing can achieve 92–97% removal efficiency even when influent FOG concentrations exceed 1,000 mg/L.
Heavy metal removal in manufacturing and metal finishing relies on chemical precipitation. This process involves precise pH adjustment (typically 6.5–8.5) and the application of coagulants like ferric chloride (50–150 mg/L) or alum (100–300 mg/L). To ensure compliance with California’s strict lead (≤0.1 mg/L) and nickel limits, automated chemical dosing systems for metals precipitation are required to manage real-time fluctuations in influent chemistry and prevent over-dosing, which can lead to excessive sludge production.
| Technology | Influent Target | Effluent Quality (TSS) | OPEX Level | California Reuse Potential |
|---|---|---|---|---|
| MBR | High BOD/COD, Low FOG | <1 mg/L | High (Energy) | High (Title 22) |
| DAF | High FOG, High TSS | <50 mg/L | Medium (Chemicals) | Moderate (Pre-treatment) |
| Chemical Precipitation | Heavy Metals, Inorganic TSS | <20 mg/L | Medium (Sludge) | Low (Industrial Only) |
| Activated Sludge | Standard BOD | 20-30 mg/L | Low/Medium | Low |
Cost Breakdown: CAPEX, OPEX & ROI for California Industrial Wastewater Systems
Budgeting for industrial wastewater projects in California requires a comprehensive look at both immediate capital expenditure (CAPEX) and the long-term operational costs (OPEX) driven by high utility rates and disposal fees. CAPEX for DAF systems typically ranges from $80,000 to $500,000 depending on flow rate and automation level. In contrast, MBR systems for large-scale industrial facilities can range from $500,000 to over $5 million, reflecting the cost of high-grade membranes and sophisticated control logic. These figures align with cost benchmarks for West Coast wastewater projects, where labor and material standards are significantly higher than in the Midwest.
OPEX in California is heavily influenced by energy costs and sludge management. MBR aeration accounts for 40–60% of energy consumption, averaging 0.5–1.0 kWh/m³ of treated water. Chemical costs for precipitation or DAF flocculation range from $0.10 to $0.50/m³. However, the most significant OPEX variable is sludge disposal; in California, tipping fees for industrial sludge can range from $200 to $500 per ton, incentivizing the use of dewatering equipment to reduce volume.
The Return on Investment (ROI) is primarily driven by three factors: water reuse savings, avoided fines, and utility rebates. In Southern California, where municipal water rates can exceed $2.00/m³, recycling treated effluent provides a direct offset to OPEX. programs like SoCal Water$mart offer rebates of up to $0.50 per gallon of water recycling capacity. A food processing plant in Fresno recently demonstrated this by switching from traditional chemical precipitation to a DAF-centric process, reducing their sludge volume by 25% and achieving a full ROI in 2.5 years through lowered disposal fees and avoided RWQCB non-compliance penalties.
Zero-Risk Compliance Checklist: Meeting California’s Pretreatment & NPDES Requirements
To avoid the $56,000/day fines associated with EPA and RWQCB enforcement, facility managers must implement a "zero-risk" operational strategy. This begins with rigorous data logging; the RWQCB often requires flow meters to record data at 15-minute intervals to ensure that peak discharge events do not overwhelm the local POTW. Comparing how other U.S. states handle industrial wastewater compliance shows that California’s documentation requirements are significantly more intensive, requiring three years of on-site record retention for all calibration and maintenance logs.
Audit triggers are the most common cause of enforcement actions. Facilities should set "Internal Action Levels" at 70% of their permit limit. If a TSS limit is 250 mg/L, the facility should trigger a process review if effluent hits 175 mg/L. This buffer prevents minor process fluctuations from becoming legal liabilities. Regular calibration of pH probes and TSS meters—at least annually, though quarterly is recommended—is non-negotiable for maintaining the integrity of SMR submissions.
| Audit Red Flag | Threshold/Condition | Regulatory Consequence |
|---|---|---|
| pH Deviation | <6.0 or >9.0 for >15 mins | Immediate Violation Notice |
| SMR Data Gaps | Missing >10% of flow data | Mandatory Audit/Fine |
| TSS Exceedance | >250 mg/L (Daily Max) | Notice of Violation (NOV) |
| Oil & Grease Visual | Visible sheen in effluent | Immediate Shutdown/Inspection |
| Heavy Metal Spike | >20% over Local Limit | Cease and Desist Order |
Equipment Selection Framework: Matching Technology to California’s Industrial Needs
The selection of wastewater equipment in California must be guided by the specific chemical profile of the influent and the discharge destination. A reliable decision framework follows a logical "If-Then" progression: If influent