Why Data Center Makeup Water Treatment is a 2026 Priority: Water Scarcity, AI Heat Loads, and Regulatory Pressure
Data centers face unprecedented water demands in 2026, with cooling systems consuming 80-90% of an estimated 200 billion gallons annually in the U.S. (Genesis Water Technologies, 2025). The burgeoning AI sector drives this demand, with AI data centers alone consuming anywhere from 300,000 to 5 million gallons of water daily, a volume comparable to a small city. This significant water footprint, coupled with increasing operational costs and tightening regulatory mandates, positions advanced makeup water treatment and blowdown recovery systems as critical investments. Regulatory bodies, such as the EPA, are enforcing stringent Water Usage Effectiveness (WUE) targets, often below 1.2 L/kWh, particularly in water-scarce regions like Phoenix and Northern Virginia (EPA 2024). Non-compliance risks not only substantial fines but also severe reputational damage. Proactive adoption of efficient water management strategies, including cooling tower blowdown treatment for reuse, offers a tangible path to sustainability and cost savings. A notable case study from a hyperscale data center in Arizona demonstrated a 40% reduction in water consumption and annual savings of $1.8 million through optimized blowdown reuse systems (Saltworks).
Makeup Water Quality Requirements for Data Centers: 2026 Engineering Specs and Compliance Thresholds
Achieving precise makeup water quality is fundamental to maintaining data center operational reliability and meeting discharge compliance for 2026. Cooling towers require influent with Total Dissolved Solids (TDS) consistently below 1,500 ppm to mitigate scaling and corrosion. Further critical parameters include hardness, ideally below 100 mg/L as CaCO₃, and silica levels below 50 mg/L to prevent the formation of problematic mineral deposits on heat exchange surfaces (Hydropure Water, 2026). Influent water exhibiting high Total Suspended Solids (TSS) exceeding 50 mg/L or Fats, Oils, and Grease (FOG) above 10 mg/L necessitates robust pre-treatment, such as Dissolved Air Flotation (DAF), before advanced processes like Reverse Osmosis (RO) to prevent premature membrane fouling. For discharge compliance, National Pollutant Discharge Elimination System (NPDES) regulations typically impose limits such as Chemical Oxygen Demand (COD) below 120 mg/L, Biochemical Oxygen Demand (BOD) below 30 mg/L, and a pH range of 6–9 (EPA 2024). Effective management of these parameters relies on carefully controlled chemical dosing. Antiscalants, commonly phosphonates like HEDP, play a crucial role in maintaining higher Cycles of Concentration (COC) without scaling, typically dosed at 0.5–2 mg/L, ensuring compatibility with RO membranes.
| Parameter | Makeup Water Specification | Cooling Tower Blowdown Discharge Limit (Typical NPDES) | Impact of Non-Compliance |
|---|---|---|---|
| Total Dissolved Solids (TDS) | < 1,500 ppm | Varies by permit, often < 5,000 ppm | Scaling, corrosion, reduced heat transfer efficiency |
| Hardness (as CaCO₃) | < 100 mg/L | Varies | Calcium carbonate scaling, reduced heat transfer |
| Silica | < 50 mg/L | Varies | Silica scaling, difficult to remove |
| Total Suspended Solids (TSS) | < 50 mg/L (requires pre-treatment if higher) | < 30 mg/L (typical) | Membrane fouling, biofouling, reduced system performance |
| Fats, Oils, Grease (FOG) | < 10 mg/L (requires pre-treatment if higher) | < 15 mg/L (typical) | Membrane fouling, operational issues |
| Chemical Oxygen Demand (COD) | N/A (for makeup) | < 120 mg/L | Environmental impact, regulatory fines |
| Biochemical Oxygen Demand (BOD) | N/A (for makeup) | < 30 mg/L | Environmental impact, regulatory fines |
| pH | 6.5 - 8.5 (ideal for cooling systems) | 6.0 - 9.0 | Corrosion (low pH), scaling (high pH) |
Treatment Train Design: RO vs. MBR vs. DAF for Data Center Makeup Water
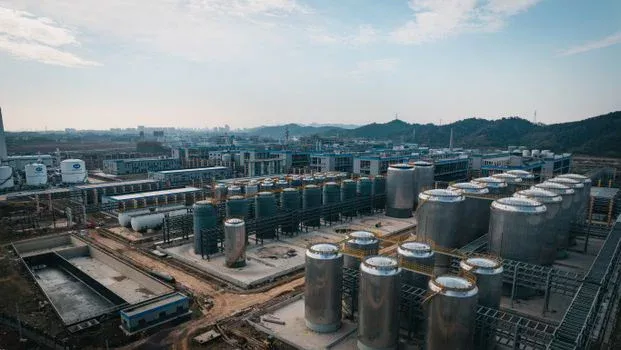
Selecting the optimal treatment train for data center makeup water is a critical engineering decision, hinging on influent water quality, specific heat load requirements, and ambitious water recovery goals. Reverse Osmosis (RO) systems are highly effective, capable of achieving over 95% water recovery and producing ultra-pure water essential for high-density cooling systems. However, RO performance is heavily dependent on effective pre-treatment; influent with TSS above 50 mg/L necessitates technologies like DAF to prevent rapid membrane fouling. The energy consumption for RO typically ranges from 2–4 kWh/m³ (Ecologix Systems). Membrane Bioreactors (MBR) offer a compact solution producing effluent of near-reuse quality with sub-micron filtration, ideal for applications demanding high purity. While MBRs are efficient in pollutant removal, they present higher capital expenditures, often ranging from $1.2M to $3M for capacities between 100–500 m³/day, and require membrane cleaning every 3–6 months. Dissolved Air Flotation (DAF) systems excel at removing a broad spectrum of suspended solids and FOG (92–97%), making them an indispensable pre-treatment step, particularly for surface water sources with high colloidal matter, though DAF alone is not sufficient for makeup water purification.
A typical advanced treatment train for data center makeup water might begin with screening to remove gross solids, followed by DAF systems for pre-treatment of high-TSS makeup water. Subsequently, the water would pass through RO systems for ultra-pure makeup water in cooling loops, potentially followed by a disinfection stage (e.g., UV or chlorination) to ensure microbial control. For such a train, initial screening might have a hydraulic retention time (HRT) of minutes, DAF typically 15-30 minutes, and RO membrane operation is characterized by flux rates, often in the range of 15-25 L/m²/hr, influenced by pressure, temperature, and water chemistry. The choice between these technologies is a deliberate engineering trade-off between CAPEX, OPEX, footprint, and the specific water quality challenges presented by the influent source.
| Technology | Primary Function | Typical Recovery Rate | Key Advantages | Key Disadvantages | Typical CAPEX Range (for 100-500 m³/day) | Typical OPEX Considerations |
|---|---|---|---|---|---|---|
| Dissolved Air Flotation (DAF) | TSS, FOG, and colloidal solids removal | N/A (pre-treatment) | Highly effective for turbid water, removes buoyant solids | Limited to pre-treatment, chemical coagulants/flocculants required | $200K - $700K | Chemical costs, sludge disposal |
| Membrane Bioreactor (MBR) | Biological nutrient removal, high-quality effluent | 90%+ | Compact footprint, excellent effluent quality (<1 μm filtration) | Higher CAPEX, membrane fouling potential, complex operation | $1.2M - $3M | Membrane replacement/cleaning, energy consumption |
| Reverse Osmosis (RO) | Dissolved salts, minerals, and organic removal | 95%+ | Produces high-purity water, effective for TDS reduction | Requires extensive pre-treatment, susceptible to fouling/scaling, energy intensive | $500K - $1.5M (including pre-treatment) | Membrane replacement, energy costs, cleaning chemicals |
Pre-Treatment Chemical Equilibria: Antiscalants, pH Adjustment, and Membrane Flux Optimization
Optimizing chemical dosing is paramount for safeguarding data center water treatment systems against scaling, corrosion, and membrane fouling, thereby extending equipment life and ensuring consistent performance. Antiscalant dosing rates, typically ranging from 0.5–2 mg/L, are precisely calibrated based on influent water characteristics, particularly hardness, and the target COC for the cooling system. Phosphonate-based antiscalants, such as 1-hydroxyethylidene-1,1-diphosphonic acid (HEDP), are often favored for RO systems due to their low propensity to foul membranes. pH adjustment is another critical control point; maintaining a pH target of 7.5–8.5 is essential to minimize calcium carbonate precipitation. This is commonly achieved through the controlled injection of sulfuric acid or CO₂ gas, with precise dosing rates determined by real-time monitoring of the Langelier Saturation Index (LSI). Understanding membrane flux is vital for operational efficiency; flux (J) is calculated as the flow rate (Q) divided by the membrane surface area (A), represented by the equation J = Q/A. Factors like temperature significantly impact flux, with a general increase of approximately 1% in flux observed for every 1°C rise in water temperature, influencing system performance and energy requirements. A data center in Singapore, by optimizing its antiscalant dosing strategy and pH adjustment protocols, successfully reduced RO cleaning frequency by 40% (Veolia), demonstrating the tangible benefits of precise chemical control.
Effective chemical management is best supported by automated systems. PLC-controlled chemical dosing for antiscalants and pH adjustment ensures accurate and consistent application, minimizing human error and optimizing chemical consumption. This automation is crucial for maintaining the delicate chemical equilibria required for efficient operation of both cooling towers and RO systems.
Blowdown Recovery Systems: How to Achieve 40% Water Savings and $1.8M Annual ROI
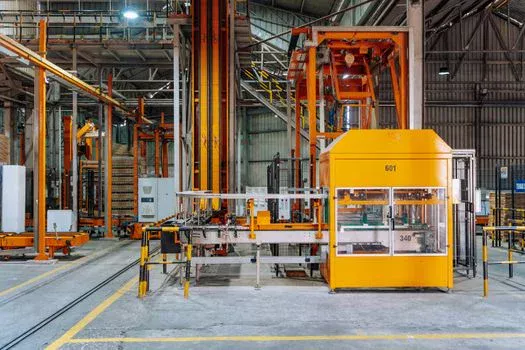
Cooling tower blowdown, typically representing 20–40% of a data center's total water usage, presents a substantial opportunity for water recovery and cost reduction. Implementing dedicated blowdown recovery systems treats this concentrated wastewater stream, enabling its reuse as makeup water and achieving significant water savings. Case studies demonstrate that such systems can facilitate up to 40% water savings (Saltworks case study), directly translating into reduced potable water intake and lower wastewater discharge costs. A typical treatment train for blowdown recovery might involve initial softening to reduce hardness, followed by RO to achieve high water purity, and a final disinfection step. These systems can achieve recovery rates of 70–90% from the blowdown stream, producing effluent with TDS typically below 500 ppm, suitable for reuse in cooling towers. The capital expenditure (CAPEX) for these systems can range from $500K to $2M, depending on the size and complexity. However, the payback period is often attractive, typically ranging from 1.5 to 3 years, driven by water costs that can vary significantly from $0.005 to $0.02 per gallon. Investing in these systems not only enhances sustainability but also provides a strong financial return on investment.
To estimate potential savings, a simplified ROI calculation can be used:
Annual Savings = [Blowdown Volume × Recovery Rate × Water Cost] – [OPEX + Annualized CAPEX]
Where:
- Blowdown Volume: Daily or annual volume of cooling tower blowdown (gallons).
- Recovery Rate: Percentage of blowdown treated and reused (e.g., 80% or 0.8).
- Water Cost: Cost per gallon of potable makeup water.
- OPEX: Operational expenditures including chemicals, energy, maintenance.
- Annualized CAPEX: Total CAPEX divided by the system's expected lifespan (e.g., 10-15 years).
| Metric | Value | Notes |
|---|---|---|
| Daily Blowdown Volume | 100,000 gallons | Assumes 20% blowdown of 500,000 gal/day makeup |
| Water Cost | $0.01 / gallon | Average regional cost |
| System Recovery Rate | 80% | |
| Annual Water Savings (Gross) | $292,000 | (100,000 gal/day * 365 days/yr * 0.8 * $0.01/gal) |
| Estimated CAPEX | $1,000,000 | For a system achieving 80% recovery |
| Estimated Annualized CAPEX (15-year lifespan) | $66,667 | ($1,000,000 / 15 years) |
| Estimated Annual OPEX | $50,000 | Chemicals, energy, maintenance |
| Estimated Annual Net Savings | $175,333 | ($292,000 - $66,667 - $50,000) |
| Estimated Payback Period | ~5.7 years | ($1,000,000 CAPEX / $175,333 Annual Net Savings) |
This analysis highlights the potential for significant financial returns, encouraging investment in data center water reuse systems.
Frequently Asked Questions
What are the primary drivers for advanced makeup water treatment in data centers by 2026?
The primary drivers are increasing AI-driven heat loads leading to higher water consumption, growing regional water scarcity, and stringent regulatory mandates for Water Usage Effectiveness (WUE) and discharge limits. These factors necessitate efficient water treatment and reuse to maintain operational reliability and sustainability.
How does influent water quality dictate the choice between RO, MBR, and DAF?
DAF is ideal for high TSS/FOG influent as a pre-treatment. RO is chosen for high-purity makeup water, but requires effective pre-treatment if influent quality is poor. MBR offers advanced biological treatment and high-quality effluent, suitable when biological contaminants are a concern or space is limited, though it has higher CAPEX.
What are the typical challenges with RO membrane fouling and how can they be mitigated?
RO membranes can foul from suspended solids, organic matter, biological growth, and mineral scaling. Mitigation involves robust pre-treatment (e.g., DAF, media filtration), proper antiscalant dosing calibrated to influent chemistry, maintaining optimal pH, and regular membrane cleaning protocols.
Is cooling tower blowdown treatment a viable option for achieving 40% water recovery?
Yes, blowdown recovery systems are specifically designed to treat cooling tower discharge, which represents a significant portion of total water usage. By treating this stream, recovery rates of 70-90% from the blowdown itself are achievable, contributing to an overall data center water recovery of up to 40%.
What is the role of Langelier Saturation Index (LSI) in data center water treatment?
LSI is a calculation used to predict the tendency of water to either precipitate calcium carbonate scale (positive LSI) or become corrosive (negative LSI). For cooling towers, maintaining a slightly positive LSI (e.g., +0.5 to +1.5) with appropriate chemical treatment (like antiscalants and pH control) balances scale prevention with minimizing corrosion.
Related Equipment
The following HydropureWater products are engineered for the wastewater challenges discussed above:
- DAF systems for pre-treatment of high-TSS makeup water — view specifications, capacity range, and technical data
- RO systems for ultra-pure makeup water in cooling loops — view specifications, capacity range, and technical data
- PLC-controlled chemical dosing for antiscalants and pH adjustment — view specifications, capacity range, and technical data
Need a customized solution? Request a free quote with your specific flow rate and pollutant parameters.