Wastewater treatment expert: +86-181-0655-2851 Get Expert Consultation
Equipment & Technology Guide

Evaporation Crystallization for COD Removal: 2026 Engineering Specs, 95%+ Efficiency & Zero-Risk Process Design

Evaporation Crystallization for COD Removal: 2026 Engineering Specs, 95%+ Efficiency & Zero-Risk Process Design

Evaporation Crystallization for COD Removal: 2026 Engineering Specs, 95%+ Efficiency & Zero-Risk Process Design

Evaporation crystallization removes 95%+ of COD from industrial wastewater by concentrating contaminants into a crystalline slurry, achieving effluent COD levels as low as 100 mgO₂/L—well below China’s GB 8978-1996 discharge limit of 1000 mgO₂/L for most industries. MVR (Mechanical Vapor Recompression) systems reduce energy costs by 40-60% compared to steam-driven units, with payback periods of 2-4 years for high-COD streams (e.g., chemical, pharmaceutical, and textile wastewater).

How Evaporation Crystallization Removes COD: Process Mechanisms and Efficiency

Evaporation crystallization fundamentally separates COD from wastewater by converting the liquid phase into vapor, leaving behind concentrated contaminants that then crystallize. This process operates on thermodynamic principles, leveraging the difference in volatility between water and dissolved organic and inorganic compounds. The typical three-phase process begins with pre-concentration via evaporation, where water is vaporized, increasing the concentration of dissolved solids and COD in the remaining liquid. Subsequently, as the solution becomes supersaturated, nucleation occurs, forming microscopic crystal seeds. Finally, these seeds grow into larger crystals, which are then separated from the mother liquor, typically as a concentrated slurry. The COD removal efficiency of evaporation crystallization systems is notably high. For influent Chemical Oxygen Demand (COD) ranging from 500–5000 mgO₂/L, removal rates typically fall between 92-97%. In cases of higher influent COD, specifically 5000–10,000 mgO₂/L, the efficiency often improves to 95-99% (per Veolia 2024 benchmarks). Key ions such as silica, nitrate, and the COD itself significantly influence process stability and crystal purity. High concentrations of silica present a substantial fouling risk, while nitrate can lead to scaling issues within the crystallizer. Maintaining crystal purity requires careful control over COD concentration during the crystallization phase (per CN110028119B patent data). Vacuum evaporation systems typically operate at temperatures between 40–80°C and pressures of 0.05–0.2 bar, whereas Mechanical Vapor Recompression (MVR) systems, offering greater energy efficiency, commonly run at higher temperatures of 60–100°C and pressures ranging from 0.1–0.3 bar.
Parameter Vacuum Evaporation (Typical) MVR Evaporation (Typical)
Operating Temperature 40–80°C 60–100°C
Operating Pressure 0.05–0.2 bar 0.1–0.3 bar
COD Removal Efficiency (500-5000 mgO₂/L influent) 92-97% 95-99%
COD Removal Efficiency (5000-10000 mgO₂/L influent) 95-99% 97-99.5%
Key Fouling/Scaling Risks Silica, High COD, Specific Inorganics Silica, High COD, Specific Inorganics

MVR vs. Steam-Driven Crystallization: Energy, Cost, and Performance Comparison
evaporation crystallization for COD removal - MVR vs. Steam-Driven Crystallization: Energy, Cost, and Performance Comparison
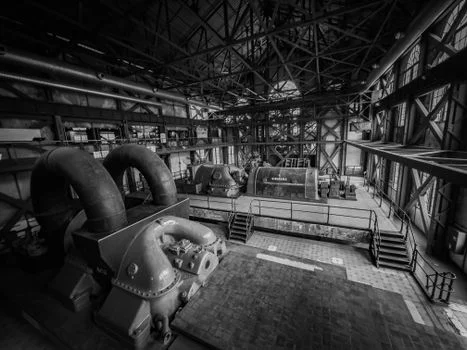
Mechanical Vapor Recompression (MVR) crystallizers offer substantial energy savings compared to traditional steam-driven systems, making them a preferred choice for many industrial wastewater applications. MVR systems typically consume 0.02–0.05 kWh/kg of water evaporated, while steam-driven units require significantly more energy, ranging from 0.6–0.8 kWh/kg of water evaporated (per Veolia 2024 data). This disparity directly translates into operational cost differences. Regarding Capital Expenditure (CAPEX), MVR systems generally have a higher upfront investment, costing between ¥1.5M–¥3.5M per m³/h of capacity in 2026. In contrast, steam-driven systems are more economical initially, with CAPEX ranging from ¥0.8M–¥2.0M per m³/h (2026 pricing). However, the operational expenditure (OPEX) heavily favors MVR technology. MVR systems can save ¥50–¥150/m³ on energy costs due to their efficient vapor recycling. Steam-driven systems, reliant on boilers, incur higher energy costs, typically requiring ¥200–¥400/m³ for fuel. Both technologies demonstrate high COD removal efficiency, with MVR achieving 95-99% removal and steam-driven systems typically reaching 90-95%, often due to the latter's lower operating temperatures. MVR technology is particularly suitable for high-COD streams found in chemical and pharmaceutical manufacturing, where energy efficiency and high purity are paramount. Steam-driven systems, while less energy-efficient, remain a viable option for industrial applications with lower COD concentrations, such as certain food processing or textile wastewater streams, where CAPEX is a primary concern.
Feature MVR Crystallization Steam-Driven Crystallization
Energy Consumption (kWh/kg water evaporated) 0.02–0.05 0.6–0.8
CAPEX (2026, per m³/h capacity) ¥1.5M–¥3.5M ¥0.8M–¥2.0M
OPEX - Energy Savings/Cost (per m³) Saves ¥50–¥150 Requires ¥200–¥400
COD Removal Efficiency 95-99% 90-95%
Industry Suitability (Primary) High-COD (chemical, pharmaceutical) Lower-COD (food processing, textiles)
Payback Period (High-COD streams) 2-4 years 3-6 years

Pre-Treatment Requirements for Stable COD Removal: Silica, Nitrate, and Suspended Solids

Effective pre-treatment is critical for preventing fouling and scaling in evaporation crystallization systems, which can otherwise reduce COD removal efficiency by 15-25% and increase operational costs. One of the primary concerns is silica, which readily precipitates as scale. Silica removal typically requires precise pH adjustment to a range of pH 9–10, followed by the dosing of magnesium oxide to precipitate silica as magnesium silicate (per CN110028119B patent data). This chemical precipitation step effectively removes dissolved silica before it can cause issues within the evaporator. Nitrate control is another essential pre-treatment step, especially for wastewaters with high nitrogen content. High nitrate concentrations can contribute to scaling and affect the overall stability of the crystallization process. Biological denitrification or ion exchange are common methods employed to reduce nitrate levels to below 50 mg/L before the wastewater enters the evaporation unit. These processes specifically target the conversion or removal of nitrate ions, mitigating their scaling potential. suspended solids (TSS) are a significant fouling agent for heat exchangers and crystallization surfaces. Dissolved Air Flotation (DAF) or lamella clarifiers are highly effective technologies for reducing TSS to below 50 mg/L. For instance, Zhongsheng Environmental's ZSQ series DAF system for pre-treatment of suspended solids and COD is engineered to achieve these low TSS levels, safeguarding the downstream evaporation process. A compelling case example from a Springer 2019 study demonstrated that a textile plant successfully reduced COD from 8400 to 1100 mgO₂/L after implementing a pre-treatment stage followed by vacuum evaporation and reverse osmosis, highlighting the importance of integrated pre-treatment.

2026 Cost Models: CAPEX, OPEX, and ROI for Evaporation Crystallization Systems
evaporation crystallization for COD removal - 2026 Cost Models: CAPEX, OPEX, and ROI for Evaporation Crystallization Systems
Evaluating the financial viability of evaporation crystallization systems requires a detailed understanding of both Capital Expenditure (CAPEX) and Operational Expenditure (OPEX), alongside a clear Return on Investment (ROI) calculation. For 2026, the CAPEX for MVR evaporation crystallization systems typically ranges from ¥1.2M–¥3.5M per m³/h capacity, encompassing the cost of equipment, installation, and commissioning. Steam-driven systems present a lower initial CAPEX, generally between ¥0.8M–¥2.0M per m³/h capacity, due to less complex compressor technology. Operational Expenditure (OPEX) is primarily driven by energy consumption, chemicals, and maintenance. Energy costs for MVR systems are significantly lower, estimated at ¥50–¥150/m³ of treated wastewater, reflecting their high energy efficiency. In contrast, steam-driven systems incur higher energy costs, ranging from ¥200–¥400/m³ due to the fuel required for steam generation. Chemical consumption, for applications such as anti-scaling agents or pH adjustment, typically adds ¥20–¥50/m³ to OPEX, with an automatic chemical dosing system ensuring precise and efficient application. Maintenance, including routine servicing and component replacement, generally accounts for ¥10–¥30/m³ of treated wastewater for both system types. The Return on Investment (ROI) for evaporation crystallization systems is often attractive, particularly for industries facing stringent discharge limits and high COD loads. MVR systems, despite their higher CAPEX, typically achieve payback periods of 2–4 years for high-COD streams, such as those found in chemical or pharmaceutical plants, owing to substantial energy savings. Steam-driven systems, with lower initial investment but higher operating costs, generally have payback periods of 3–6 years for lower-COD streams like textile wastewater. When comparing evaporation crystallization to alternative COD removal technologies, the cost per cubic meter can vary significantly. Electrocoagulation as an alternative for COD removal, for example, typically ranges from ¥800–¥1500/m³ depending on the wastewater characteristics and required effluent quality. Membrane Bioreactors (MBR) can cost between ¥1200–¥2500/m³, making evaporation crystallization a competitive option for achieving very low COD levels, especially for zero liquid discharge (ZLD) objectives.
Cost Category MVR Evaporation Crystallization Steam-Driven Evaporation Crystallization
CAPEX (per m³/h capacity, 2026) ¥1.2M–¥3.5M ¥0.8M–¥2.0M
OPEX - Energy (per m³) ¥50–¥150 ¥200–¥400
OPEX - Chemicals (per m³) ¥20–¥50 ¥20–¥50
OPEX - Maintenance (per m³) ¥10–¥30 ¥10–¥30
ROI (High-COD Streams) 2–4 years 3–6 years
Cost Comparison vs. Alternatives (Electrocoagulation) Competitive for high-COD/ZLD where electrocoagulation (¥800–¥1500/m³) and MBR (¥1200–¥2500/m³) may not achieve ultra-low limits or ZLD.

Compliance and Discharge Limits: Meeting EPA, China GB, and EU Standards

Evaporation crystallization consistently produces effluent with exceptionally low COD levels, enabling industrial facilities to meet and often surpass stringent global discharge standards. For instance, China's GB 8978-1996 standard sets a COD discharge limit of 1000 mgO₂/L for most industrial sectors. Evaporation crystallization systems regularly achieve effluent COD levels of ≤100 mgO₂/L, providing a significant compliance buffer and reducing the risk of fines. In the United States, EPA 40 CFR Part 437 regulations, specifically for the metal finishing industry, set a COD limit of 500 mgO₂/L. Evaporation crystallization can reduce COD to ≤50 mgO₂/L, easily satisfying these federal guidelines. Similarly, the EU Urban Waste Water Directive 91/271/EEC specifies a COD limit of 125 mgO₂/L for discharges. Evaporation crystallization typically yields effluent with COD as low as ≤30 mgO₂/L, ensuring full compliance with European environmental directives. Beyond direct discharge, evaporation crystallization is a foundational technology for achieving Zero Liquid Discharge (ZLD). By converting industrial wastewater into reusable water and concentrated solid crystals, it eliminates liquid waste streams entirely, providing a robust solution for industries seeking to minimize environmental impact and achieve full regulatory compliance, even in regions with the most demanding ZLD mandates.

Frequently Asked Questions

evaporation crystallization for COD removal - Frequently Asked Questions

What is the typical COD removal efficiency of evaporation crystallization?

Evaporation crystallization typically removes 95-99% of COD from industrial wastewater. For influent COD levels between 500–10,000 mgO₂/L, effluent COD can be reduced to as low as 100 mgO₂/L, consistently meeting stringent discharge limits like China's GB 8978-1996.

How do MVR systems reduce energy costs compared to steam-driven crystallizers?

MVR systems reduce energy costs by 40-60% because they recompress the evaporated vapor, recovering latent heat and reusing it for further evaporation. This significantly lowers external energy input, consuming only 0.02–0.05 kWh/kg water evaporated compared to 0.6–0.8 kWh/kg for steam-driven units.

What pre-treatment steps are necessary to ensure stable operation and high COD removal?

Pre-treatment is crucial to prevent fouling and scaling. Key steps include pH adjustment and magnesium oxide dosing for silica removal, biological denitrification or ion exchange for nitrate control (<50 mg/L), and DAF or lamella clarifiers to reduce suspended solids (<50 mg/L).

What is the typical ROI for an MVR evaporation crystallization system?

MVR systems generally offer a rapid Return on Investment, with payback periods typically ranging from 2–4 years for high-COD industrial wastewater streams. This quick payback is primarily driven by significant operational savings from reduced energy consumption compared to conventional systems.

Can evaporation crystallization help achieve Zero Liquid Discharge (ZLD)?

Yes, evaporation crystallization is a core technology for achieving Zero Liquid Discharge (ZLD). It concentrates all dissolved solids and contaminants into a crystalline or solid form, allowing the recovered water to be reused and eliminating liquid waste discharge.

Recommended Equipment for This Application

The following Zhongsheng Environmental products are engineered for the wastewater challenges discussed above:

Need a customized solution? Request a free quote with your specific flow rate and pollutant parameters.

Related Guides and Technical Resources

Explore these in-depth articles on related wastewater treatment topics:

Related Articles

Top 7 Sewage Treatment Equipment Suppliers in Connecticut USA: 2026 Specs, Costs & Zero-Risk Selection Guide
Jul 9, 2026

Top 7 Sewage Treatment Equipment Suppliers in Connecticut USA: 2026 Specs, Costs & Zero-Risk Selection Guide

Discover 2026 engineering specs, CAPEX ($80K–$2.1M), and zero-risk supplier selection for sewage tr…

Semiconductor UPW Treatment 2026: Engineering Specs, Zero-Risk Equipment Selection & Cost Breakdown
Jul 9, 2026

Semiconductor UPW Treatment 2026: Engineering Specs, Zero-Risk Equipment Selection & Cost Breakdown

Discover 2026 semiconductor UPW treatment specs, process stages, equipment selection criteria, and …

Industrial Wastewater Treatment in Cleveland: 2026 Engineering Specs, Costs & Zero-Risk Compliance Guide
Jul 9, 2026

Industrial Wastewater Treatment in Cleveland: 2026 Engineering Specs, Costs & Zero-Risk Compliance Guide

Discover 2026 engineering specs, CAPEX ($80K–$2.5M), and zero-risk compliance strategies for indust…

Contact
Contact Us
Call Us
+86-181-0655-2851
Email Us Get a Quote Contact Us