Industrial wastewater treatment in Ludhiana is governed by Punjab Pollution Control Board (PPCB) consent limits and by highly variable influent from textile dyeing, electroplating, and food processing plants. Typical consent packages still target COD ≤ 250 mg/L and TSS ≤ 100 mg/L for many textile discharges, while electroplating units are held to Cr(VI) ≤ 0.1 mg/L and total chromium ≤ 2.0 mg/L. For a 100 KLD electroplating line, dissolved air flotation (DAF) followed by chemical precipitation commonly achieves about 95% chromium removal at ₹18–22L per KLD CAPEX. Food plants that need reuse-grade water often specify membrane bioreactor (MBR) trains near ₹30–35L per KLD when product-water TDS ≤ 500 mg/L is required.
Industrial Wastewater Treatment in Ludhiana: Specs Buyers Need First
Ludhiana industrial ETP design starts from consent limits, not equipment catalogues. Textile plants typically face COD ≤ 250 mg/L, TSS ≤ 100 mg/L, pH 6.5–8.5, and TDS ≤ 2,100 mg/L. Electroplating caps Cr(VI) at 0.1 mg/L and total chromium at 2.0 mg/L. 2026 CAPEX is about ₹15–25L/KLD for DAF, ₹25–35L for MBBR, and ₹30–45L for MBR including civil work.
Ludhiana Industrial Effluent: Key Pollutants and PPCB Discharge Norms
The Punjab Pollution Control Board sets industry-specific discharge conditions for Ludhiana plants, usually aligned with national schedules and tightened in consent where local receptors demand it. For textile effluent, plants commonly work to COD ≤ 250 mg/L, TSS ≤ 100 mg/L, and pH 6.5–8.5 under current consent practice. Electroplating units face metal limits that include Hexavalent Chromium (Cr(VI)) ≤ 0.1 mg/L, total chromium ≤ 2.0 mg/L, and additional nickel and cyanide caps. Food processing facilities must meet oil and grease ≤ 2 mg/L in addition to general organic parameters.
Influent quality in Ludhiana’s key industries creates the real design load that civil and mechanical scopes must absorb. Textile wastewater typically shows COD 800–1,500 mg/L and TDS 3,000–5,000 mg/L from dyes and process salts. Electroplating effluent often carries chromium at 50–200 mg/L and nickel at 20–80 mg/L before reduction and precipitation. Food processing wastewater is usually high in organics, with BOD 1,200–2,500 mg/L and fats, oils, and grease (FOG) between 300–800 mg/L (HydropureWater field data, 2025).
Compliance failures remain common across the city’s industrial belts. PPCB’s 2023 enforcement data indicates that 42% of textile plants exceeded TDS limits, while 28% of electroplating units failed Cr(VI) tests. These failures often stem from inadequate pretreatment capacity, weak operational oversight, or outdated equipment rather than missing paperwork alone.
Comparing PPCB consent practice with Central Pollution Control Board (CPCB) national schedules shows Ludhiana conditions are often at least as strict on dissolved solids and metals. Earlier secondary summaries sometimes cited a CPCB TDS figure of 2,500 mg/L for general industrial effluent; Ludhiana consent packages used in current sizing still apply TDS ≤ 2,100 mg/L for many discharges. CPCB publishes separate industry-specific effluent standards for textile dyeing and printing, electroplating and anodizing, food processing, and CETPs, which PPCB implements through Consent to Establish and Consent to Operate (CPCB industry-specific effluent standards listing). Color for textile streams and cyanide for plating remain frequent consent add-ons that buyers should read line by line.
| Parameter | PPCB Discharge Norms (2026) | Textile Influent Benchmarks | Electroplating Influent Benchmarks | Food Processing Influent Benchmarks |
|---|---|---|---|---|
| pH | 6.5–8.5 | 6.0–10.0 | 2.0–5.0 | 4.0–7.0 |
| COD (mg/L) | ≤ 250 | 800–1,500 | 100–300 | 1,500–3,000 |
| BOD (mg/L) | ≤ 30 | 250–500 | 50–150 | 1,200–2,500 |
| TSS (mg/L) | ≤ 100 | 150–400 | 50–150 | 200–500 |
| TDS (mg/L) | ≤ 2,100 | 3,000–5,000 | 500–1,500 | 800–2,000 |
| Oil & Grease (mg/L) | ≤ 2 (Food Processing) | 10–50 | 5–20 | 300–800 |
| Cr (Total) (mg/L) | ≤ 2.0 | — | 50–200 | — |
| Cr (VI) (mg/L) | ≤ 0.1 | — | 5–20 | — |
| Ni (mg/L) | ≤ 3.0 | — | 20–80 | — |
| Color (Pt-Co) | ≤ 100 | 200–1,000 | — | — |
Treatment Technologies for Ludhiana’s Top 3 Industries: Process Flow and Efficiency Benchmarks
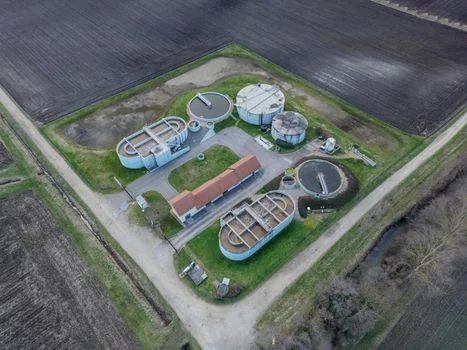
Effective treatment for Ludhiana’s top three industrial streams requires trains matched to pollutant chemistry, not a single package plant for every site. Electroplating wastewater usually needs a two-stage system: DAF for oils, greases, and suspended solids, then chemical precipitation for heavy metals. DAF units on plating streams typically operate at a hydraulic loading rate of 4–6 m³/m²/h. After DAF, operators raise pH to 9–10 with lime or caustic soda so chromium and nickel form insoluble hydroxides. That precipitation step reaches about 95% heavy metal removal when Cr(VI) has already been reduced to Cr(III). A typical flow includes screening, equalization, DAF, chemical dosing, clarification, and a filter press for sludge dewatering.
Textile wastewater, high in COD, TDS, and color, often benefits from anaerobic-aerobic (A/O) Moving Bed Biofilm Reactor (MBBR) biology. These MBBR systems reduce COD by 80–85% at organic loading rates of 0.8–1.2 kg COD/m³/day on plastic carrier media. Meeting PPCB color norms and enabling reuse in Punjab mills usually requires tertiary treatment. Electrocoagulation at current densities of 0.5–1.0 A/dm² is effective for color removal, while reverse osmosis systems at 15–20 bar cut TDS for process reuse. For robust primary solids and FOG control ahead of biology or metals trains, plants often specify a dissolved air flotation (DAF) machine.
Food processing wastewater, rich in organic matter and FOG, responds well to MBR systems that deliver reuse-grade BOD ≤ 10 mg/L and TSS ≤ 5 mg/L at a membrane flux of 0.05–0.1 kg BOD/m²/day. Initial FOG removal is critical for membrane life and is typically done with DAF at a 30–50% recycle ratio. Most plants we size for Ludhiana food lines keep that DAF stage even when the owner prefers a compact MBR skid downstream. Effluent quality targets for food reuse are covered in the MBR effluent quality guide for food processing.
Across all three sectors, equalization volume is the silent capacity driver. Dye houses with batch dumps and plating shops with rinse spikes both need 6–12 hours of equalization at design flow before DAF or biology sees a stable load. Skipping that tank to save civil cost is a common reason COD or metals spikes still breach consent after a new ETP is commissioned.
| Industry | Primary Technology | Key Process Step | Key Parameter | Efficiency Benchmark | Typical Process Flow |
|---|---|---|---|---|---|
| Electroplating | DAF + Chemical Precipitation | Heavy Metal Precipitation (pH 9-10) | Cr/Ni Removal | 95% | Screen → Equalization → DAF → Chemical Dosing → Clarifier → Filter Press |
| Textile | A/O MBBR (+ Tertiary) | Biological COD Reduction (0.8–1.2 kg COD/m³/day) | COD Reduction | 80–85% | Screen → Equalization → A/O MBBR → Clarifier → (Electrocoagulation/RO) → Filtration |
| Food Processing | MBR (+ DAF Pre-treatment) | Membrane Filtration (0.05–0.1 kg BOD/m²/day flux) | BOD/TSS Removal | >95% (reuse-grade) | Screen → Equalization → DAF → Anoxic/Aerobic Tank → MBR → Disinfection |
MBBR vs MBR vs DAF: Tech Comparison for Ludhiana’s Industrial Effluent
Choosing among MBBR, MBR, and DAF for Ludhiana industrial effluent requires a side-by-side look at footprint, effluent quality, energy, and sludge—not brochure claims. DAF primary units usually need the smallest footprint for their duty, about 0.2–0.4 m²/m³/day. MBBR systems are moderately compact at 0.5–1.0 m²/m³/day. MBR plants typically occupy 0.3–0.6 m²/m³/day and remain more space-efficient than conventional activated sludge for the same BOD load.
Effluent quality diverges sharply. MBR systems consistently deliver BOD ≤ 10 mg/L and TSS ≤ 5 mg/L, which suits non-potable reuse. MBBR biology typically reaches BOD 20–30 mg/L and TSS 10–20 mg/L and often needs tertiary polishing for stricter norms. DAF alone brings TSS to 30–50 mg/L and FOG to ≤ 10 mg/L but does not provide meaningful biological treatment. Where textile or food plants need reuse-grade water, an integrated MBR wastewater treatment unit is often the compact finishing step after solids and FOG control.
Energy consumption is a standing OPEX line because Ludhiana industrial electricity commonly averages ₹8–10/kWh. DAF systems are the leanest at about 0.1–0.2 kWh/m³. MBBR aeration typically needs 0.3–0.5 kWh/m³. MBR trains, with membrane scour air and higher dissolved oxygen setpoints, use about 0.6–1.0 kWh/m³—roughly 2–3 times the electrical cost of DAF on a treated-volume basis.
Sludge yield and cake dryness also differ. DAF float often reaches 30–40% dry solids and yields about 0.1–0.3 kg TSS/kg TSS removed, which is easier to press. MBBR yields about 0.3–0.5 kg TSS/kg BOD removed; MBR yields about 0.2–0.4 kg TSS/kg BOD removed. Biological cakes are wetter (15–25% solids) and usually need plate-and-frame presses. For that duty, plants specify plate frame filter press sludge dewatering sized on peak solids, not average flow.
Local water chemistry adds operating risk that generic catalogues miss. Ludhiana groundwater TDS of 1,200–1,800 mg/L can accelerate MBR fouling, so softening or stronger pretreatment is common. Textile DAF units need frequent skimming because fiber mats cut rise rates if ignored. Most plants we size for Focal Point and Bahadur Ke Road dyeing clusters run DAF hydraulic loading at the lower end of 4–6 m³/m²/h for that fiber load.
| Feature | MBBR (Moving Bed Biofilm Reactor) | MBR (Membrane Bioreactor) | DAF (Dissolved Air Flotation) |
|---|---|---|---|
| Primary Function | Biological treatment (COD/BOD reduction) | Advanced biological & physical treatment (high-quality effluent) | Physical-chemical separation (TSS, FOG, heavy metals) |
| Footprint (m²/m³/day) | 0.5–1.0 | 0.3–0.6 | 0.2–0.4 |
| Effluent Quality (BOD mg/L) | 20–30 | ≤ 10 (reuse-grade) | N/A (pre-treatment only) |
| Effluent Quality (TSS mg/L) | 10–20 | ≤ 5 (reuse-grade) | 30–50 |
| Energy Use (kWh/m³) | 0.3–0.5 | 0.6–1.0 | 0.1–0.2 |
| Sludge Production (kg TSS/kg pollutant removed) | 0.3–0.5 (BOD) | 0.2–0.4 (BOD) | 0.1–0.3 (TSS) |
| CAPEX (per KLD) | ₹25–35L | ₹30–45L | ₹15–25L |
| Ludhiana Specific Challenge | Requires tertiary for color/TDS in textiles | Membrane fouling due to high TDS groundwater | Frequent skimming for textile fibers |
Cost Breakdown: CAPEX, OPEX, and ROI for Ludhiana’s Wastewater Treatment Plants
The total cost of a Ludhiana industrial ETP splits into CAPEX and ongoing OPEX that must be modeled before ROI claims are accepted. CAPEX benchmarks for a new plant in 2026 sizing fall near ₹15–25L per KLD for DAF systems, ₹25–35L per KLD for MBBR systems, and ₹30–45L per KLD for MBR systems. Those figures cover civil work, equipment procurement, and installation, with local skilled labor typically ₹600–800/hour (HydropureWater project data, 2025). Owners should separate civil contingencies from mechanical scope before ranking vendor bids.
Operational expenditure varies strongly by energy and membrane replacement. Energy for MBR systems can run ₹1.5–3.0/m³ treated, while DAF systems are leaner at ₹0.5–1.0/m³. Chemical costs for coagulants and flocculants on DAF and precipitation trains typically range ₹0.8–1.5/m³. Labor for a dedicated ETP operator is around ₹20–30K/month. For MBR systems, membrane replacement is a recurring capital item, estimated at ₹5–8L per module every 3–5 years. At ₹8–10/kWh, aeration-heavy trains dominate the monthly bill.
ROI is driven by reuse savings, avoided penalties, and sludge disposal—not by nameplate recovery rates alone. Textile plants can save ₹40–60/m³ by cutting freshwater intake through treated-water reuse. Avoiding PPCB penalties matters because fines can range from ₹5L to ₹25L per violation. Efficient sludge dewatering can cut disposal from ₹8–12/kg for liquid sludge to ₹2–4/kg for dewatered cake. A 200 KLD textile ETP in Ludhiana demonstrated a 24-month payback after a 50% reduction in freshwater intake and ₹12L in avoided penalties over two years. How Ludhiana’s cost stack compares with Gujarat textile hubs also matters: Gujarat ZLD add-ons often raise CAPEX further even when primary biology looks similar on paper.
Main cost drivers to freeze in the bid sheet are civil volume for equalization, power tariff assumptions, chemical unit prices, membrane replacement year, sludge transport distance, and whether RO reject or MEE is in or out of scope. Changing any one of those six lines can move payback by more than a year on a 100–200 KLD plant.
| Cost Category | DAF System (per KLD) | MBBR System (per KLD) | MBR System (per KLD) |
|---|---|---|---|
| CAPEX (Lakhs INR) | 15–25 | 25–35 | 30–45 |
| OPEX (per m³ treated) | ₹1.5–2.5 | ₹2.5–4.0 | ₹4.0–6.0 |
| Energy Cost (per m³) | ₹0.5–1.0 | ₹1.0–2.0 | ₹1.5–3.0 |
| Chemical Cost (per m³) | ₹0.8–1.5 | ₹0.2–0.5 | ₹0.2–0.5 |
| Labor Cost (per month) | ₹20–30K | ₹20–30K | ₹25–35K |
| Membrane Replacement (5 years) | N/A | N/A | ₹5–8L per module |
| Water Reuse Savings (per m³) | ₹40–60 (potential) | ||
| PPCB Penalty Avoidance (per violation) | ₹5–25L (potential) | ||
Selecting a Supplier in Ludhiana: PPCB Approval, After-Sales Service, and Red Flags
Selecting a supplier for a Ludhiana industrial ETP directly affects consent compliance, uptime, and life-cycle cost. A basic due-diligence step is to verify the vendor’s Consent to Operate track record for industrial ETPs—consents are typically valid for five years and can be checked on the PPCB online portal. PPCB’s 2023 audit data reveals that only about 40% of Ludhiana-based suppliers held active and valid consents at that review, which is a clear signal to demand documentary proof before paying advances.
After-sales service and spare-parts lead times decide whether a plant recovers after a night shift failure. Local suppliers typically offer 1–2 year warranties and often respond within 24 hours. International vendors may offer longer membrane warranties, such as five-year packages, but response times of 48–72 hours are common when parts ship from outside Punjab. For DAF skimmers and MBBR media, Ludhiana’s industrial area usually has three to four local sources. MBR membranes often need import, with lead times of 4–6 weeks that must be covered by on-site spares.
Several red flags should stop a purchase. They include a supplier that will not pilot-test complex wastewater, cannot name Ludhiana references with similar effluent profiles, or cannot provide PPCB compliance documentation for installed systems. In 2022, one Ludhiana textile plant incurred ₹8L in PPCB penalties because a non-compliant vendor’s ETP failed discharge tests repeatedly after handover.
Negotiation still moves total cost of ownership. Bundling civil work with equipment supply can save 10–15%. Locking chemical prices for 12 months reduces OPEX volatility. Contracts should include performance guarantees such as minimum 90% uptime or named effluent quality limits. Use this selection checklist before award: (1) valid PPCB consent references, (2) pilot or jar-test data on your wastewater, (3) spare-parts lead times in writing, (4) sludge handling included in scope, (5) OPEX model at ₹8–10/kWh, (6) performance bond tied to consent parameters, (7) commissioning and operator training hours defined.
Factory-direct pricing without documented after-sales coverage is a recurring trap in the Ludhiana market. Local vendors may undercut capital cost, yet plants that cannot secure PPCB-aligned service commitments still face shutdown risk when a critical skimmer, blower, or membrane module fails during a production peak.
Who This Is For / Next Step
This article is for plant engineers, EPC contractors, and procurement managers sizing or upgrading ETPs for Ludhiana textile, electroplating, or food facilities under PPCB consent. Look elsewhere if you need municipal STP design alone, a pure ZLD crystallizer package without a primary ETP, or laboratory method development rather than process selection. To match DAF, MBBR, or MBR scope to your flow and pollutant list, request a technical quote with KLD capacity, COD/BOD, metals, FOG, and the discharge or reuse destination.
Frequently Asked Questions
What are the PPCB’s penalties for non-compliance in Ludhiana?
Fines for non-compliance in Ludhiana range from ₹5L to ₹25L per violation, with plant shutdowns enforced for repeated offenses, as documented in PPCB’s 2023 enforcement data. Penalty exposure often exceeds the OPEX gap between a compliant train and an undersized one within a single inspection cycle, especially for chromium or TDS exceedances on textile and plating lines.
How much does a 100 KLD electroplating ETP cost in Ludhiana?
A 100 KLD electroplating ETP using DAF and chemical precipitation typically costs ₹18–22L per KLD, including civil work and installation. Operational expenditure is approximately ₹2.5–3.5/m³ treated when chemicals, power at ₹8–10/kWh, labor, and sludge disposal are included. Final quotes still depend on metal load, cyanide presence, and how the sludge is classified for disposal.
Can MBR systems handle Ludhiana’s high-TDS groundwater?
Yes, MBR systems can treat streams influenced by high-TDS groundwater, but membrane fouling rates may increase by 30–40% compared with lower-TDS regions. Softening, stronger equalization, and DAF FOG removal before the membranes are the usual mitigations. Most plants we size for Ludhiana food lines add CIP chemical budget specifically for that fouling uplift.
What’s the lead time for a new ETP in Ludhiana?
For local suppliers in Ludhiana, lead time for a new ETP is typically 8–12 weeks from drawing approval to wet commissioning. International vendors may need 16–20 weeks when fabricated skids and membranes ship into Punjab. Membrane-critical trains should order first-fill spares with the capital package to cover the common 4–6 week import lag.
Are there subsidies for wastewater treatment plants in Punjab?
Yes, the Punjab State Council for Science & Technology offers capital subsidies. Small and Medium Enterprises (SMEs) can avail up to 30% capital subsidy, capped at ₹50L per project, for installing wastewater treatment plants. Confirm current scheme windows and eligible technology lists before locking CAPEX, because documentation often runs in parallel with Consent to Establish.