A monocrystalline silicon wastewater treatment system must strip fluoride, phosphorus, and submicron silicon solids from acid etch streams. Hybrid DAF-RO-MBR trains deliver that with $500K–$15M CAPEX and $0.80–$2.50/m³ OPEX across 50–500 m³/h plants.
Monocrystalline Silicon Wastewater Treatment System at a Glance
Monocrystalline silicon wastewater carries 5–15% v/v HF/HNO3 from saw damage removal and phosphorus-rich streams at 100–500 mg/L COD from PSG etching. Hybrid DAF-RO-MBR systems achieve 95–99% fluoride removal and 92–97% COD reduction, meeting EPA 40 CFR Part 469 and China GB 31573-2015 limits. CAPEX spans $500K at 50 m³/h to $15M at 500 m³/h, with OPEX of $0.80–$2.50/m³.
OPEX within that band depends heavily on membrane lifespan and chemical dosing requirements, which is why two plants with identical flows can report unit costs a factor of three apart. On the regulatory side, 40 CFR Part 469 is formally the Electrical and Electronic Components Point Source Category, with Subpart A covering the semiconductor subcategory (§§ 469.10–469.19) (Cornell LII, 40 CFR Part 469). Buyers should read the fluoride, phosphorus, COD, TSS, pH, and copper limits below against the permit pathway their plant actually holds.
Why Monocrystalline Silicon Wastewater Requires Specialized Treatment
Monocrystalline silicon wafer production generates wastewater containing high concentrations of hydrofluoric acid (HF), nitric acid (HNO3), silicon particles, and phosphorus, which demands treatment approaches beyond conventional industrial systems (HydropureWater field data, 2025). Each manufacturing step contributes its own contaminant signature. Generic industrial treatment trains frequently fail on these streams, and the failure shows up as regulatory violations and operational inefficiencies rather than subtle performance loss.
The core process steps that generate significant wastewater are:
- Saw Damage Removal/Texturing: This initial step prepares the wafer surface. For monocrystalline silicon it typically involves alkaline solutions, generating wastewater with high silicon particle loads and sometimes residual etchants. Volumes can range from 2–3 m³/1,000 wafers, containing 5–15% v/v HF/HNO3 if acid texturing is used, or high pH and suspended solids if alkaline.
- Emitter Formation (Doping with Phosphorus): Introduces phosphorus into the silicon crystal lattice. Wastewater streams typically contain phosphorus compounds and residual acids.
- Phosphorus Silicate Glass (PSG) Etching: Removes the PSG layer formed during doping. This process is a major source of phosphorus (up to 80 mg/L) and fluoride (from HF etching) in the wastewater, often with low pH.
- Silicon Nitride (Si₃N₄) Deposition: Creates an anti-reflection coating. Rinse waters from this stage can contain trace amounts of ammonia or silane byproducts.
- Screen Printing of Metallization: Applies metal contacts. Wastewater may contain trace metals like copper or nickel, along with organic binders and solvents.
- Edge Isolation: Separates active areas. Rinse waters typically have lower contaminant concentrations but contribute to overall flow.
Compared to polycrystalline silicon production, monocrystalline wafer manufacturing often utilizes alkaline texturing processes, which produce different pH profiles and a higher load of fine silicon particles — potentially 30% greater than poly-silicon processes (HydropureWater process analysis, 2025). These fine particles are particularly challenging for filtration.
Failure to treat these streams adequately leads to common regulatory violations: fluoride exceedances (>15 mg/L), phosphorus concentrations above permitted levels (>1 mg/L), and pH values outside the neutral range (<6 or >9). Conventional chemical precipitation, while effective for some industrial wastewaters, often proves insufficient here. Silicon particles below 1 micrometer blind filter media rapidly, and the highly corrosive nature of HF degrades standard steel tanks and piping, demanding specialized materials and system designs.
| Process Step | Primary Contaminants | Typical Volume (m³/1,000 wafers) | Impact on Treatment |
|---|---|---|---|
| Saw Damage Removal/Texturing | HF/HNO₃ (if acid-based), Silicon particles, High pH (if alkaline) | 2–3 | Corrosion, high TSS, fluoride removal |
| Emitter Formation | Phosphorus compounds, Acids | 0.5–1.0 | Phosphorus removal, pH adjustment |
| PSG Etching | Phosphorus, Fluoride, Low pH | 1.0–1.5 | Complex fluoride/phosphorus removal, pH adjustment |
| Si₃N₄ Deposition | Trace ammonia, Silane byproducts | 0.2–0.5 | Minor COD/nutrient load |
| Metallization | Trace metals (Cu, Ni), Organics | 0.3–0.8 | Heavy metal removal, COD reduction |
| Edge Isolation | Dilute acids/alkalis | 0.5–1.0 | pH equalization |
Contaminant Profile: What’s in Monocrystalline Silicon Wastewater?
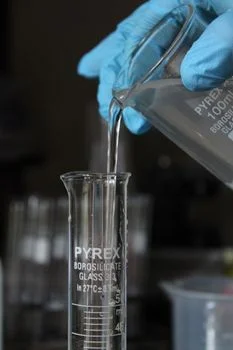
Monocrystalline silicon wastewater is characterized by high suspended solids, fluoride, phosphorus, and fluctuating pH, and each of those four parameters directly shapes treatment system design and performance (HydropureWater field data, 2025). The streams are heterogeneous: concentration and flow rate swing with the specific process step and production volume. Engineers who size against an average load, rather than the step-by-step profile below, routinely under-size equalization and dosing.
The table below details typical contaminant loads from key process steps in monocrystalline silicon manufacturing:
| Process | Flow Rate (m³/h) | COD (mg/L) | TSS (mg/L) | Fluoride (mg/L) | Phosphorus (mg/L) | pH |
|---|---|---|---|---|---|---|
| Saw Damage Removal (Alkaline) | 1.5–2.5 | 50–150 | 500–1,500 | <5 | <1 | 10.0–12.0 |
| Saw Damage Removal (Acid) | 1.5–2.5 | 20–80 | 100–300 | 5,000–15,000 | <1 | 1.0–2.0 |
| PSG Etching | 1.0–1.2 | 400–600 | 150–250 | 10–20 | 70–90 | 2.0–2.5 |
| Emitter Formation Rinse | 0.8–1.0 | 100–200 | 50–100 | <5 | 20–40 | 3.0–4.0 |
| Metallization Rinse | 0.5–0.8 | 100–300 | 50–100 | <5 | <1 | 6.0–8.0 |
Silicon Particle Removal Submicron Wastewater Pre-Treatment
Silicon particles generated during sawing and etching typically range from 0.1 to 10 μm, with approximately 80% smaller than 1 μm (HydropureWater lab analysis, 2025). Particles that fine are highly prone to membrane fouling, so effective pre-treatment is crucial for MBR and RO stages. Without a high-efficiency DAF system for silicon particle removal ahead of the membranes, flux decays fast, cleaning frequency climbs, and membrane lifespan shrinks.
Seasonal variability also impacts contaminant loads. During peak summer production, increased demand accelerates chemical bath degradation, which can elevate the HF load by as much as 25% in certain streams due to more frequent bath changes. Treatment systems therefore need hydraulic and chemical flexibility, not just nameplate capacity. Trace metals — copper from metallization and nickel from plating — are also present and must be removed to meet EPA discharge limits under 40 CFR Part 469, which specifies effluent limitations for the semiconductor manufacturing point source category.
Hybrid DAF-RO-MBR System: Engineering Specs for Monocrystalline Silicon Wastewater
A hybrid DAF-RO-MBR system treats complex monocrystalline silicon wastewater by stacking three barriers in series: DAF for robust solids removal, RO for dissolved inorganic reduction, and MBR for organic degradation and final polishing (HydropureWater engineering analysis, 2025). The multi-barrier layout exists because no single stage handles fine silicon particles, dissolved fluoride, phosphorus, and COD at once. The typical process flow for a 3-stage hybrid system begins with DAF, continues through RO or nanofiltration, and finishes in the MBR.
DAF System Specifications:
The DAF unit is the primary pre-treatment stage, critical for removing suspended solids — especially fine silicon particles that foul downstream membranes:
- Loading Rate: 4–8 m³/m²/h (optimizing for high TSS removal).
- Microbubble Size: 20–50 μm (ensuring efficient particle attachment and flotation).
- Polymer Dosage: 2–5 mg/L (cationic polymer for enhanced flocculation).
- TSS Removal: 92–97% (achieving consistent effluent quality for subsequent stages).
- Design Consideration: Integrated pH adjustment for optimal coagulation/flocculation.
DAF effectively removes over 90% of TSS and significant portions of oil and grease, drastically reducing the particulate load on the RO and MBR systems. For unit fundamentals, the daf system design explainer covers loading-rate selection and recycle ratios in plain terms.
RO/NF System Specifications:
Following DAF, the RO or Nanofiltration (NF) stage targets dissolved inorganic contaminants, particularly fluoride and phosphorus:
- Membrane Type: Spiral-wound polyamide composite membranes (selected for high rejection and chemical resistance).
- Recovery Rate: 75–85% (balancing water reuse with concentrate management).
- Operating Pressure: 15–30 bar (depending on influent TDS and desired permeate quality).
- Fluoride Rejection: 95–99% (achieving discharge limits for fluoride).
- Phosphorus Rejection: 90–95% (critical for phosphorus removal from semiconductor wastewater).
- Design Consideration: Pre-pH adjustment to 5–6 is crucial for optimal fluoride rejection and to prevent scaling.
The high-rejection RO membranes for fluoride and phosphorus removal are key to meeting stringent inorganic discharge limits and enabling water reuse.
Phosphorus Removal PSG Etching Wastewater Treatment
PSG etching wastewater carries 70–90 mg/L of phosphorus at pH 2.0–2.5, making it the dominant nutrient load in the plant. Lime or alum dosing precipitates the bulk of it, and the 90–95% phosphorus rejection of the RO stage carries the effluent below 0.2 mg/L. That margin matters against the 0.5 mg/L daily-average limits in EU Directive 2010/75/EU BAT-AELs and China GB 31573-2015. Plants that skip precipitation and rely on RO alone typically scale their membranes within weeks.
MBR System Specifications:
The MBR system provides advanced biological treatment and physical separation, polishing the effluent for organic contaminants and remaining suspended solids:
- Membrane Type: PVDF flat-sheet, 0.1 μm pore size (selected for durability, chemical resistance, and zero-fouling characteristics).
- Flux: 15–25 LMH (Liters per square meter per hour) (optimized for monocrystalline silicon wastewater and sustainable operation).
- MLSS (Mixed Liquor Suspended Solids): 8,000–12,000 mg/L (ensuring high biomass concentration for efficient COD reduction).
- Aeration Rate: 0.2–0.4 m³/m²/h (for biological activity and membrane scouring).
- COD Removal: 92–97% (consistently meeting discharge standards).
The PVDF flat-sheet MBR for zero-fouling silicon wastewater treatment is highly effective, removing over 99% of COD and TSS and providing effluent suitable for further polishing or direct discharge.
Where fluoride and phosphorus are already controlled upstream, specifying an MBR for sludge separation and COD polish is often the lowest-cost compliant finish. The packaged MBR Membrane Bioreactor Wastewater Treatment System pairs the flat-sheet cassettes with aeration and automated CIP on a single skid, which shortens installation on crowded fab sites.
Zero-Fouling Design and Maintenance:
To ensure membrane longevity and efficiency, a zero-fouling design approach is implemented. Continuous coarse bubble aeration (airflow of 0.3 m³/m²/h) scours the PVDF membranes in the MBR and prevents cake layer formation. Chemical cleaning protocols are followed strictly: RO membranes typically require weekly Clean-In-Place (CIP) using citric acid for inorganic scaling and NaOH for organic fouling, while MBR membranes undergo monthly CIP with similar agents. Regular maintenance and monitoring, often supported by an PLC-controlled chemical dosing for pH adjustment and coagulation, extend membrane lifespan and keep performance on spec.
| Component | Key Parameter | Specification Range | Removal Efficiency (Target) |
|---|---|---|---|
| DAF Pre-treatment | Loading Rate | 4–8 m³/m²/h | TSS: 92–97% |
| Microbubble Size | 20–50 μm | ||
| Polymer Dosage | 2–5 mg/L | ||
| pH Adjustment | 6.5–7.5 (optimal flocculation) | ||
| RO/NF System | Membrane Type | Spiral-wound Polyamide | Fluoride: 95–99%, Phosphorus: 90–95% |
| Recovery Rate | 75–85% | ||
| Operating Pressure | 15–30 bar | ||
| Pre-pH | 5.0–6.0 (for F⁻ rejection) | ||
| MBR System | Membrane Type | PVDF Flat-sheet, 0.1 μm | COD: 92–97%, TSS: >99% |
| Flux | 15–25 LMH | ||
| MLSS | 8,000–12,000 mg/L | ||
| Aeration Rate | 0.2–0.4 m³/m²/h (for scouring) |
Treatment Technology Comparison: DAF vs. MBR vs. RO vs. Hybrid
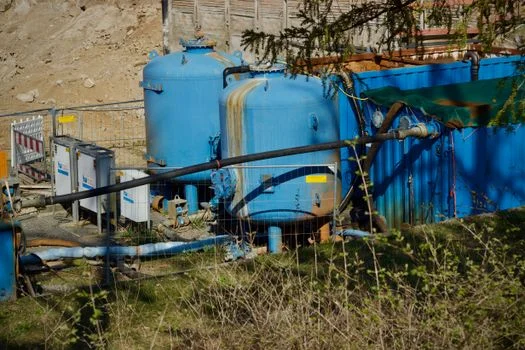
Technology selection among DAF, MBR, RO, and hybrid trains comes down to CAPEX, OPEX, footprint, and the effluent quality the permit demands (HydropureWater market research, 2025). Each technology carries distinct advantages and limitations, so the correct choice depends on influent characteristics, discharge regulations, and reuse goals rather than on any single number.
| Technology | CAPEX ($/m³/h) | OPEX ($/m³) | Footprint (m²/100 m³/h) | Key Limitations |
|---|---|---|---|---|
| DAF (alone) | $5,000–$15,000 | $0.20–$0.60 | 5–8 | Limited dissolved contaminant removal (F⁻, P), high sludge volume |
| MBR (alone) | $15,000–$30,000 | $0.60–$1.20 | 8–15 | Sensitive to high TSS/F⁻, requires pre-treatment for heavy metals |
| RO (alone) | $20,000–$40,000 | $0.80–$2.00 | 10–20 | High energy consumption (2–4 kWh/m³), extreme fouling risk without pre-treatment, concentrate disposal |
| Hybrid DAF-RO-MBR | $30,000–$50,000 | $1.00–$2.50 | 12–25 | Higher initial CAPEX, requires skilled operators, complex system integration |
Use-Case Matching:
- DAF alone: Best suited for facilities with relatively low fluoride concentrations (typically <50 mg/L) and primary focus on suspended solids removal. It's an excellent pre-treatment but insufficient for stringent dissolved contaminant limits.
- MBR alone: Ideal for high-COD streams (>1,000 mg/L) where biological treatment and solids separation are paramount, and dissolved inorganics are not the primary concern. It provides a compact footprint compared to conventional activated sludge.
- RO alone: Reserved for applications where ultra-high fluoride removal (up to 99%) or significant total dissolved solids (TDS) reduction is the primary goal, often for water reuse. Requires extensive pre-treatment to prevent fouling.
- Hybrid DAF-RO-MBR: The most comprehensive solution for monocrystalline silicon wastewater, offering full compliance with the most stringent discharge limits and enabling high-quality water reuse. This system effectively handles high TSS, fluoride, phosphorus, and COD.
Pros and Cons per Technology:
- DAF:
- Pros: Excellent for suspended solids and oil/grease removal, relatively low CAPEX.
- Cons: Ineffective for dissolved contaminants like fluoride and phosphorus, produces significant sludge volume.
- MBR:
- Pros: Compact footprint, high effluent quality (low COD, TSS), good for biological nutrient removal.
- Cons: Sensitive to pH swings and high particulate loads without pre-treatment, moderate CAPEX/OPEX.
- RO:
- Pros: Achieves 95–99% fluoride removal, high TDS reduction, enables water reuse.
- Cons: High energy use (2–4 kWh/m³), susceptible to fouling, high concentrate disposal costs.
- Hybrid DAF-RO-MBR:
- Pros: Comprehensive contaminant removal, meets ultra-stringent discharge limits, maximizes water reuse potential.
- Cons: Highest CAPEX and OPEX, requires skilled operators, larger footprint than individual systems.
Decision Tree Framework:
A simplified decision framework guides initial technology selection:
- Assess Influent Quality:
- If Fluoride >100 mg/L AND high COD → Consider Hybrid DAF-RO-MBR.
- If high TSS only, low dissolved contaminants → DAF.
- If high COD only, low TSS/inorganics → MBR.
- If high TDS/inorganics, pre-treated stream → RO.
- Determine Discharge Limits & Water Reuse Goals:
- If stringent limits (e.g., F⁻ <10 mg/L, P <1 mg/L) OR water reuse desired → Hybrid DAF-RO-MBR.
- If less stringent limits, no reuse → DAF or MBR alone may suffice.
- Evaluate Budget & Footprint Constraints:
- If limited CAPEX/OPEX and larger footprint acceptable → DAF.
- If compact footprint is critical → MBR.
- If budget allows for comprehensive, high-performance system → Hybrid.
Wafer-scale variants of the same stack are covered in the Silicon Wafer Wastewater Treatment System: 2027 Engineering Specs guide, which applies the same DAF-RO-MBR logic at fab scale. In practice, most buyers shortlist two configurations and let the penalty and reuse numbers decide.
Monocrystalline Silicon Wafer Manufacturing Wastewater CAPEX Breakdown
Monocrystalline silicon wafer manufacturing wastewater CAPEX runs from $500K for a 50 m³/h hybrid plant to $15M at 500 m³/h, and unit costs fall as scale rises because of economies of scale (HydropureWater financial modeling, 2025). Budgeting therefore means pricing both the initial investment and the ongoing operational spend, with system scale as the dominant variable. Procurement leads who budget CAPEX only are the ones who get surprised by chemical and membrane line items in year two.
CAPEX Breakdown by System Scale (Hybrid DAF-RO-MBR)
The capital expenditure for a hybrid DAF-RO-MBR system depends heavily on required treatment capacity, with per-unit-volume costs decreasing at larger scales:
| System Scale (m³/h) | Total CAPEX (USD) | DAF System | RO System | MBR System | Piping & Tanks | Automation & Controls | Installation & Commissioning |
|---|---|---|---|---|---|---|---|
| 50 | $500,000 – $1,200,000 | $100K–$200K | $150K–$300K | $120K–$250K | $50K–$100K | $30K–$60K | $50K–$100K |
| 100 | $1,000,000 – $2,500,000 | $200K–$400K | $300K–$600K | $250K–$500K | $100K–$200K | $60K–$120K | $80K–$180K |
| 200 | $2,500,000 – $5,000,000 | $400K–$800K | $800K–$1.5M | $600K–$1.2M | $200K–$400K | $120K–$250K | $180K–$350K |
| 300 | $4,000,000 – $8,000,000 | $600K–$1.2M | $1.2M–$2.5M | $1.0M–$2.0M | $300K–$600K | $200K–$400K | $250K–$500K |
| 500 | $8,000,000 – $15,000,000 | $1.2M–$2.5M | $2.5M–$5.0M | $1.8M–$3.5M | $500K–$1.0M | $300K–$600K | $500K–$1.0M |
OPEX Breakdown (Per Cubic Meter Treated)
Operational expenditures recur daily and directly affect plant profitability. Expressed per cubic meter treated, the components are:
- Chemicals: $0.30–$0.80/m³ (for pH adjustment, coagulation, flocculation, membrane cleaning).
- Energy: $0.20–$0.50/m³ (for pumps, blowers, RO high-pressure pumps – RO is the most energy-intensive component, consuming 2–4 kWh/m³).
- Membrane Replacement: $0.15–$0.40/m³ (amortized cost over membrane lifespan; RO membranes last 3–5 years, PVDF MBR membranes 5–8 years).
- Labor: $0.10–$0.30/m³ (for operation, monitoring, maintenance, and sludge handling).
- Sludge Disposal: $0.10–$0.20/m³ (cost of dewatering and disposing of treatment byproducts, typically $50–$120/ton of dry sludge).
Return on Investment (ROI) Calculation:
ROI for a hybrid DAF-RO-MBR system can be significant and is driven by several quantifiable factors:
- Water Reuse Savings: $0.50–$1.50/m³ (cost avoidance for fresh water intake and discharge fees).
- Sludge Disposal Savings: Reduced volume of hazardous sludge due to efficient dewatering can save $50–$120/ton.
- Regulatory Penalty Avoidance: Preventing daily fines offers substantial financial protection.
- Enhanced Brand Reputation: Demonstrating environmental stewardship can lead to market advantages.
A typical payback period for systems over 200 m³/h ranges from 3–5 years, driven primarily by water reuse and avoided penalties.
Cost-Saving Strategies:
- Modular Design: Implementing a modular system can reduce initial CAPEX by 15–20% and allow for phased expansion.
- Solar-Powered RO: Integrating solar energy for RO operations can reduce energy costs by up to 30%, particularly in regions with high solar irradiance.
- Membrane Leasing Programs: Shifting membrane replacement CAPEX to OPEX through leasing agreements can improve cash flow.
- Advanced Automation: Utilizing advanced PLC and SCADA systems for optimized chemical dosing and energy management can reduce chemical consumption by 10–15% and energy use by 5–10%.
Compliance Benchmarks: Meeting EPA, EU, and China GB Standards
Adhering to strict global discharge regulations — EPA 40 CFR Part 469, EU Directive 2010/75/EU, and China GB 31573-2015 — is paramount for monocrystalline silicon operations to avoid penalties and maintain environmental performance (HydropureWater regulatory compliance guide, 2025). These standards set specific limits for the key contaminants in semiconductor wastewater, so the treatment train must hold its effluent below them continuously, not on average.
The table below outlines typical discharge limits from major regulatory bodies and compares them to the expected effluent quality from a well-designed hybrid DAF-RO-MBR system:
| Parameter | EPA 40 CFR Part 469 (Semiconductor) | EU Directive 2010/75/EU (BAT-AEL) | China GB 31573-2015 (Semiconductor) | Typical Treated Effluent (Hybrid DAF-RO-MBR) |
|---|---|---|---|---|
| Fluoride (F⁻) | 15 mg/L | 10 mg/L (daily average) | 10 mg/L | <5 mg/L |
| Phosphorus (Total P) | 1 mg/L | 0.5 mg/L (daily average) | 0.5 mg/L | <0.2 mg/L |
| COD | 100 mg/L | 50 mg/L (daily average) | 60 mg/L | <30 mg/L |
| TSS | 30 mg/L | 10 mg/L (daily average) | 10 mg/L | <5 mg/L |
| pH | 6.0–9.0 | 6.0–9.0 | 6.0–9.0 | 6.5–8.5 |
| Copper (Total Cu) | 0.2 mg/L | 0.1 mg/L | 0.1 mg/L | <0.05 mg/L |
Permit requirements usually involve self-monitoring and reporting. EPA 40 CFR Part 469 mandates regular sampling and reporting to demonstrate compliance. In the European Union, facilities must adhere to Best Available Techniques Associated Emission Levels (BAT-AELs) under the Industrial Emissions Directive (IED 2010/75/EU), which often implies higher performance standards than basic discharge limits. China's GB 31573-2015 sets specific limits for pollutants from the semiconductor manufacturing industry, with stringent control over heavy metals and nutrients. For a deeper regulatory read, consult a compliance guide for photovoltaic wastewater treatment.
Common compliance failures include fluoride spikes during concentrated bath changes, which can overwhelm chemical precipitation systems, and phosphorus exceedances from PSG etching where removal is inadequate. Mitigation strategies include equalization tanks to buffer influent swings, real-time monitoring with automated feedback loops for chemical dosing, and robust pre-treatment such as DAF to protect downstream membrane processes.
Beyond discharge, many facilities target water reuse. Post-RO permeate can meet ASTM D5127 Type II (1–10 MΩ·cm) for general rinse water, while further polishing with ion exchange can achieve ultrapure water (18 MΩ·cm) for critical process steps. ISO 16075 provides guidelines for agricultural reuse, showing how versatile highly treated wastewater can be. For help matching a system to a reuse goal, refer to a selection guide for solar cell wastewater treatment plants.
Who this is for: process engineers, EPC contractors, and procurement leads at mono-wafer and solar cell plants evaluating a treatment upgrade. Who should look elsewhere: plants with only dilute, neutral rinse water. Next step: send a 24-hour flow profile with fluoride and phosphorus loadings through our request a quote page for a sized hybrid DAF-RO-MBR proposal.
Frequently Asked Questions
What’s the biggest challenge in treating monocrystalline silicon wastewater?
The most significant challenge is fluoride removal to levels below 15 mg/L, often combined with high silicon particle loads and phosphorus. RO membranes achieve 95–99% rejection but require precise pH adjustment, typically to 5–6, to prevent silica and fluoride scaling. Hybrid DAF-RO systems are generally the most reliable route to consistent fluoride compliance.
Can we reuse treated wastewater in our production process?
Yes, treated wastewater can be reused, but typically only after advanced polishing such as RO or NF. MBR effluent usually meets ASTM D5127 Type II (1–10 MΩ·cm) for non-critical rinse water applications. Achieving ultrapure water (18 MΩ·cm) for critical manufacturing steps requires additional post-treatment like ion exchange (IX) or electrodeionization (EDI) after the RO stage.
How often do membranes need replacement?
RO membranes typically last 3–5 years, while PVDF MBR membranes can last 5–8 years with proper Clean-In-Place (CIP) protocols and effective pre-treatment. Fouling from fine silicon particles or inadequate pH control can cut membrane lifespan by 20–30% when robust pre-treatment such as DAF is missing. Track flux decline and differential pressure as leading indicators.
What’s the payback period for a hybrid DAF-RO-MBR system?
Typical payback runs 3–5 years for hybrid systems above 200 m³/h capacity. The return is driven by water reuse savings of $0.50–$1.50/m³, sludge disposal reductions of $50–$120/ton, and avoided regulatory penalties. Plants with high fresh-water costs and tight discharge limits sit at the fast end of that range.
Are there any emerging technologies for silicon wastewater treatment?
Electrocoagulation for fluoride removal leads the field, demonstrating up to 90% efficiency with potentially 30% lower OPEX than traditional RO on certain streams. Forward Osmosis (FO) is also gaining traction for zero-liquid discharge (ZLD) applications with lower fouling propensity. The hybrid DAF-RO-MBR train remains the industry standard for proven, comprehensive removal. For future-facing designs, see 2027 engineering specs for silicon wafer wastewater treatment equipment.