Why Conventional Systems Fail Ammonia Limits
Ammonia wastewater treatment MBR design parameters pair 0.1 μm PVDF membranes with SRT above 15 days and MLSS of 8–12 g/L, delivering 95%+ NH4 removal and effluent NH4 below 10 mg/L at 20–30°C, with flux of 15–25 LMH and DO of 2–3 mg/L.
Conventional plants miss ammonia limits for structural reasons. Activated sludge often runs at a sludge retention time (SRT) below 5 days, washing out the slow-growing nitrifiers — Ammonia-Oxidizing Bacteria (AOB) and Nitrite-Oxidizing Bacteria (NOB) — that do the work. Those bacteria are also temperature-sensitive: activity can drop by as much as 50% below 15°C, so winter compliance becomes a gamble in colder climates.
Industrial load patterns make it worse. Fertilizer production and chemical manufacturing introduce ammonia shock loads that overwhelm the microbial population and disrupt nitrification kinetics in MBR and conventional systems alike. According to EPA 2023 data, 40% of industrial wastewater treatment plants nationwide fail to comply with ammonia discharge limits, mostly through inadequate SRT or inconsistent dissolved oxygen (DO) control.
One chemical plant in Shandong, China reduced influent ammonia from 400 mg/L to roughly 250 mg/L with conventional activated sludge — and still violated China's GB 18918-2002 discharge limits by an order of magnitude. Earlier write-ups cite Class IA at below 15 mg/L NH4-N; the standard itself caps Class IA at 5 mg/L, or 8 mg/L when water temperature is at or below 12°C, while 15 mg/L matches the Class IB cold-weather value (China MEE, GB 18918-2002). Variable loads plus stable biology is exactly the combination MBR exists for.
How an MBR Removes Ammonia: Biology Plus Membrane
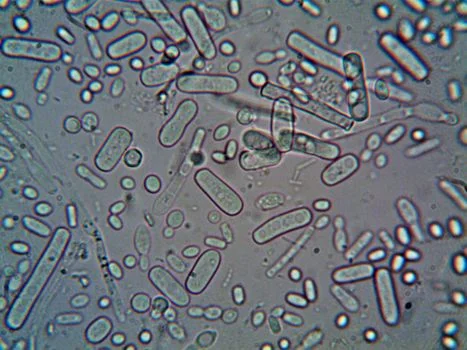
MBR systems pair biological nitrification with an absolute membrane barrier. Nitrification runs in two aerobic steps: AOB such as Nitrosomonas convert NH4+ to NO2- (2NH4+ + 3O2 → 2NO2- + 4H+ + 2H2O), then NOB such as Nitrospira and Nitrobacter oxidize nitrite to nitrate (Wikipedia, Nitrification). The oxidation consumes approximately 4.57 grams of oxygen per gram of ammonia-nitrogen (NH4-N) oxidized.
The membrane's job is retention. A 0.1 μm PVDF barrier holds all biomass, suspended solids, and colloids inside the bioreactor, so the system sustains MLSS of 8–12 g/L and an SRT beyond 15 days. Those long SRTs are what keep slow-growing nitrifiers stable through influent swings — the failure mode that sinks conventional plants. Nitrification kinetics in MBR systems stay predictable because the specialists never leave.
A typical process diagram for ammonia-rich wastewater runs a pre-anoxic tank for denitrification (nitrates back to nitrogen gas), an aeration tank for nitrification, and a membrane tank for solid-liquid separation. Aeration tank volume follows the required SRT and target MLSS, often sized with tools like the Plutocalc Designer Handbook. Tank depths of 4 to 5 meters optimize oxygen transfer while managing construction cost.
| Parameter | Description | Typical Range for Ammonia-Rich Streams |
|---|---|---|
| Nitrification Process | Biological conversion of NH4+ to NO3- | Two-step: NH4+ → NO2- (AOB), NO2- → NO3- (NOB) |
| Oxygen Requirement | Stoichiometric O2 for NH4-N oxidation | 4.57 g O2 / g NH4-N |
| Membrane Pore Size | Effective filtration barrier | 0.1 μm (PVDF material) |
| MLSS Concentration | Biomass concentration in bioreactor | 8–12 g/L |
| Sludge Retention Time (SRT) | Average time biomass remains in the system | >15 days (critical for nitrifiers) |
| Aeration Tank Depth | Optimizes oxygen transfer | 4–5 m |
Ammonia Wastewater Treatment MBR Design Parameters: 2026 Specs
Ammonia wastewater treatment MBR design parameters balance nitrification biology against membrane hydraulic limits. The 2026 specification set below reflects current industry practice for ammonia-rich industrial streams, from influent load to scour air.
| Parameter | Typical Range for Ammonia-Rich Streams | Source/Rationale |
|---|---|---|
| Influent NH4-N | 50–1,000 mg/L | MBR can handle high loads; pre-treatment for >500 mg/L |
| MLSS Concentration | 8–12 g/L | Plutocalc Designer Handbook; ensures high biomass concentration |
| SRT (Sludge Retention Time) | >15 days (typically 20–40 days) | Critical for slow-growing nitrifying bacteria stability |
| HRT (Hydraulic Retention Time) | 4–12 hours (aerobic tank) | Dependent on influent strength and desired effluent quality |
| Dissolved Oxygen (DO) | 2–3 mg/L | Optimal for AOB/NOB activity; higher DO may increase energy |
| Membrane Flux | 15–25 LMH (L/m²/hr) | Typical for industrial MBRs with PVDF membranes; balances throughput and fouling |
| Aeration Rate (for scour) | 0.3–0.6 Nm³/m²/hr | Maintains membrane cleanliness, prevents membrane fouling in high-ammonia wastewater |
| Temperature | 20–30°C (optimal) | Nitrification rate halves at 10°C vs. 20°C |
Temperature moves the biology more than any other variable. For every 10°C decrease, the nitrification rate can halve, and the Arrhenius correction R_T = R_20 × θ^(T-20) with a temperature coefficient θ of 1.07–1.09 translates bench kinetics to site conditions. Alkalinity is the second budget: approximately 7.14 grams of CaCO3 equivalent are consumed per gram of NH4-N oxidized (per EPA Nitrogen Control manual), so a PLC-controlled chemical dosing system for MBR pH/alkalinity adjustment is standard equipment on ammonia duty.
High Strength Ammonia Wastewater MBR Engineering Checklist
High strength ammonia wastewater MBR engineering checklists start with the load, not the equipment. Streams above 500 mg/L NH4-N push against oxygen transfer, alkalinity reserves, and membrane cleanliness simultaneously, so the specification has to close all three gaps at once:
- Confirm influent NH4-N across production swings; design for the campaign maximum, not the average.
- Set SRT at 20–40 days so nitrifier inventory survives the coldest design temperature.
- Budget 4.57 kg O2 per kg NH4-N oxidized and verify blower capacity against the Alpha-corrected transfer rate.
- Dose alkalinity at 7.14 g CaCO3 per g NH4-N to hold pH through peak nitrification.
- Pre-treat TSS and scaling precursors above 500 mg/L NH4-N influent with DAF to protect the membranes.
- Hold flux at 15–25 LMH with scour air at 0.3–0.6 Nm³/m²/hr.
For full-train sizing that pairs biology with polishing, the companion guide on amonia load in mbr system design criteria extends these parameters to hybrid MBR-RO designs and their CAPEX breakdown.
MBR Nitrification SRT MLSS Design Specifications
SRT above 15 days — typically 20–40 — is the single most important number in MBR nitrification design. The membrane makes it achievable at MLSS of 8–12 g/L, roughly triple a conventional plant, because solids separation no longer depends on settling. That inventory of AOB and NOB, retained rather than recycled, is what converts peak ammonia loads without a compliance excursion. Match it with DO of 2–3 mg/L and the kinetics hold across the 20–30°C optimum band.
MBR Membrane Fouling High Ammonia Influent Control
MBR membrane fouling high ammonia influent control centers on scaling and solids load. When influent NH4 exceeds 500 mg/L, inorganic scaling risk rises alongside the biology's alkalinity draw, and struvite-like precipitates find the membrane surface. Pre-treatment with dissolved air flotation (DAF) cuts particulate load first; scour air at 0.3–0.6 Nm³/m²/hr then keeps the cake layer thin. HydropureWater's DAF machines exist in the line-up precisely for this protection duty.
MBR Ammonia Removal Efficiency Industrial Wastewater: Plant Data
MBR ammonia removal efficiency industrial wastewater data shows 92–98% conversion across sectors, with effluent NH4 below 10 mg/L and COD below 50 mg/L in the strongest cases. The documented plants below all met stringent discharge standards, including China's GB 18918-2002 Class IA and EPA NPDES limits for direct discharge, without secondary clarification.
| Case Study | Influent NH4-N (mg/L) | Effluent NH4-N (mg/L) | Influent COD (mg/L) | Effluent COD (mg/L) | Influent TSS (mg/L) | Effluent TSS (mg/L) | Effluent TN (mg/L) |
|---|---|---|---|---|---|---|---|
| Landfill Leachate Plant, Zhejiang | 800 | 8 | 2500 | 120 | 300 | <5 | <50 |
| Chemical Manufacturing, Jiangsu | 450 | <5 | 1800 | <50 | 150 | <3 | <30 |
| Fertilizer Production, Sichuan | 600 | 7 | 2200 | 80 | 200 | <5 | <45 |
Variability across the table tracks influent load fluctuation and operational stability, not technology ceiling. The energy trade-off is real, though: holding DO at 2–3 mg/L is optimal for nitrification, and pushing toward the top of that band improves rates but can raise aeration cost by 15–20%. Most plants we size for run at the low end unless winter nitrification forces the issue.
Ammonia Removal MBR Landfill Leachate Case Study
The ammonia removal MBR landfill leachate case study from Zhejiang is the benchmark plant. Leachate punishes conventional biology with both load and toxicity, which is why the retained-biomass buffer of an MBR is the configuration that survives it.
MBR vs. Conventional Systems: Cost, Footprint, and Compliance
MBR systems typically carry 20–30% higher Capital Expenditure than SBRs, yet run about 30% lower OPEX through reduced sludge handling and chemical usage (Water Environment Federation 2025 report). The comparison below lines up the three main biological options where ammonia compliance is the deciding factor:
| Feature | MBR System | Sequencing Batch Reactor (SBR) | Conventional Activated Sludge |
|---|---|---|---|
| CapEx (Relative) | High (1.2-1.3x SBR) | Medium | Low |
| OPEX (Relative) | Medium (0.7x SBR) | High (aeration, sludge) | Medium (sludge, clarifier) |
| Footprint | Compact (0.3-0.5x Activated Sludge) | Medium | Large |
| NH4 Removal Efficiency | 95%+ (consistently <10 mg/L) | 90-95% (variable) | 60-90% (highly variable) |
| Sludge Production | Low (0.3-0.6 kg TSS/m³) | Medium (0.5-0.8 kg TSS/m³) | High (0.7-1.0 kg TSS/m³) |
| Compliance Reliability | Excellent (direct discharge quality) | Good (requires strict control) | Fair (frequent violations) |
| Effluent Quality | High (TSS <5 mg/L, turbidity <1 NTU) | Medium (TSS 10-30 mg/L) | Low (TSS 20-50 mg/L) |
| Post-Treatment Needs | Minimal to none for reuse | Often requires tertiary filtration | Requires secondary clarification & tertiary filtration |
Conventional trains hide their costs in add-ons. Secondary clarifiers alone can add $200K–$500K to a project, and tertiary filtration for reuse adds another $150K–$300K — components that inflate both footprint and complexity. The MBR Membrane Bioreactor Wastewater Treatment System collapses clarification, filtration, and disinfection-ready quality into one compact unit.
Footprint gaps decide constrained sites. MBR footprints run 30–50% smaller than comparable activated sludge, and modularity allows phased expansion — for example from 100 m³/day to 500 m³/day — without proportional land. That scalability plus predictable effluent quality is what makes MBR the long-term compliance and reuse choice.
Submerged vs. Side-Stream MBR for Ammonia Treatment

Submerged MBRs immerse membrane modules (such as DF series PVDF flat sheet membranes for submerged MBR applications) directly in the bioreactor, while side-stream MBRs pump mixed liquor through an external cross-flow filtration unit. The trade-offs for ammonia duty are summarized below:
| Feature | Submerged MBR | Side-Stream MBR |
|---|---|---|
| Energy Use | Lower (0.3–0.6 kWh/m³) | Higher (1.2–2.0 kWh/m³) |
| Fouling Risk | Lower (air scour effective) | Higher (requires higher cross-flow velocity) |
| Footprint | More compact (integrated) | Slightly larger (external module) |
| MLSS Tolerance | Higher (up to 12 g/L) | Lower (typically <8 g/L) |
| NH4 Removal Efficiency | Excellent | Excellent |
| Maintenance | Easier (in-situ cleaning) | More complex (external module handling) |
For most industrial ammonia applications, submerged MBRs are the recommendation. Energy runs 0.3–0.6 kWh/m³ versus 1.2–2.0 kWh/m³ side-stream, MLSS tolerance reaches 12 g/L for robust nitrification kinetics, and in-situ cleaning simplifies maintenance. The stable MBR sludge retention time for nitrifiers follows directly from that tolerance.
Side-stream configurations still win niches. High-temperature streams above 40°C and highly viscous effluents — certain pharmaceutical wastewaters among them — benefit from external modules with precise temperature control and higher shear. For general industrial ammonia treatment, the energy efficiency and operational simplicity of HydropureWater's MBR integrated wastewater treatment system with submerged flat sheet modules make it the default.
Hardware for an Ammonia MBR Specification
Three product lines carry most ammonia-duty MBR projects. Each is sized against the design parameters above and built for the cleaning chemistry that keeps nitrifiers and membranes healthy:
- HydropureWater's integrated MBR system for ammonia-rich wastewater — view specifications, capacity range, and technical data
- DF series PVDF flat sheet membranes for submerged MBR applications — view specifications, capacity range, and technical data
- PLC-controlled chemical dosing for MBR pH/alkalinity adjustment — view specifications, capacity range, and technical data
Who This Is For and Next Step
This page is for plant engineers and procurement leads at fertilizer, chemical, landfill, and food-processing sites where ammonia limits are the binding constraint. If your stream is dilute, warm, and already meeting permit on CAS biology, an MBR premium is hard to justify. If shock loads or winter nitrification keep putting you out of compliance, the SRT mathematics above argue the other way. Send flow, influent NH4-N, and the applicable standard with your inquiry — request a free quote with your specific pollutant parameters and receive a sizing basis built on these design parameters.
Frequently Asked Questions
What is the maximum influent NH4 concentration for MBR?
MBR systems effectively treat influent ammonia up to 1,000 mg/L. Above roughly 500 mg/L, plan on DAF pre-treatment, alkalinity dosing, and tighter fouling management as part of daily operation. For still higher loads, specialized Anammox-MBR hybrid systems offer an energy-efficient nitrogen-removal route.
How often do MBR membranes need cleaning for ammonia wastewater?
Chemical cleaning typically runs every 3–6 months, using sodium hypochlorite at 2,000 ppm or citric acid at 1–2%. Fouling in high-ammonia wastewater can accelerate, so streams consistently above 500 mg/L NH4 often need a shorter interval. Scour air at 0.3–0.6 Nm³/m²/hr between cleans keeps TMP in band.
Can MBR effluent be reused for industrial processes?
Yes, MBR effluent quality supports industrial reuse, with NH4 typically below 10 mg/L and TSS below 5 mg/L. That meets or exceeds common reuse standards such as cooling tower makeup water (ASTM D1193 Type IV) and process water. Reuse value often shortens the payback calculation by displacing fresh water.
What is the typical payback period for an MBR system treating ammonia wastewater?
Typical payback runs 3–5 years for industrial ammonia MBR systems (WEF 2025 cost benchmarking report). The return comes from avoided non-compliance fines, lower sludge disposal from reduced sludge production, and water reuse savings. Sites with high freshwater cost or heavy fines exposure sit at the fast end of that range.