How MBR Membrane Modules Solve Industrial Wastewater Challenges
The MBR working principle couples a high-MLSS bioreactor with 0.05–0.4 μm membranes driven by transmembrane pressure. At MLSS 8,000–12,000 mg/L, HRT 4–8 h and SRT 20–50 days, municipal plants typically remove 92–97% COD. Design flux is usually 15–30 LMH, and permeate TSS stays below 1 mg/L.
MBR replaces gravity clarification with a physical membrane barrier after biological treatment. A food processing plant in Shandong avoided a $2 million facility expansion by converting a conventional activated sludge train to MBR, cutting footprint by 60% while holding effluent COD below 50 mg/L. Plants face tighter discharge rules such as China’s GB 18918-2002 Class 1A and EU Directive 91/271/EEC, where secondary clarifiers often miss stable TSS and nutrient targets.
According to the Ministry of Ecology and Environment interpretation published via CUWA (2026), GB 18918—2002 remains in force with a 2025 amendment: COD, ammonia nitrogen, total nitrogen and total phosphorus now carry instantaneous limits as well as daily means, and non-reuse Class 1A fecal coliform is set at 10,000 MPN/L. Earlier practice relied mainly on daily-mean limits for those indicators. MBR systems keep MLSS at 8,000–12,000 mg/L and use 0.05–0.4 μm pores for solid-liquid separation and pathogen reduction, often supporting direct discharge or non-potable reuse without sand filters. According to US EPA 40 CFR Part 503 (current eCFR), pathogen rules in Part 503 apply to sewage sludge (biosolids) use or disposal, not to MBR permeate; permeate compliance is judged against the discharge or reuse permit.
| Challenge | Conventional Activated Sludge (CAS) | MBR Membrane Module Solution |
|---|---|---|
| Footprint Requirements | Large (requires secondary clarifiers) | Compact (60-70% reduction in land use) |
| Effluent Quality (TSS) | 10–30 mg/L (variable) | <1 mg/L (consistent) |
| Sludge Production | High (short SRT) | Low (long SRT of 20–50 days) |
| Water Reuse Capability | Requires tertiary treatment | Direct reuse for non-potable applications |
MBR Working Principle and Process Flow Diagram
The MBR working principle integrates a suspended-growth bioreactor with a microfiltration or ultrafiltration membrane unit so that solid-liquid separation no longer depends on floc settling velocity. Transmembrane pressure (TMP) draws treated water through the membrane. Field practice groups the process into four stages with fixed engineering ranges (HydropureWater field data, 2025).
Stage 1: Biological Reactor. Microorganisms degrade BOD/COD and nutrients in the bioreactor. MBR trains hold MLSS at 8,000–12,000 mg/L versus 2,000–4,000 mg/L in conventional plants. That density supports HRT of 4–8 hours and SRT of 20–50 days, with 92–97% COD removal on municipal wastewater.
Stage 2: Membrane Filtration. Size exclusion separates solids as a permeate pump creates vacuum across 0.05–0.4 μm pores. A dynamic cake layer forms on the surface and helps retain finer particles. Standard flux is 15–30 LMH for hollow fiber modules and 20–40 LMH for flat sheet modules at typical municipal temperatures.
Stage 3: Aeration and Scouring. Air at 0.2–0.4 Nm³/m²·h enters at the module base to scour the membrane and limit irreversible fouling. The same air also supplies oxygen for aerobic bacteria. Scouring energy usually falls between 0.2 and 0.6 kWh/m³, depending on packing density and MLSS.
Stage 4: Permeate Production. Clean membranes often run at 0.1–0.2 bar TMP; rising TMP toward 0.5 bar signals a cleaning cycle. Permeate turbidity is typically <0.2 NTU, with pathogen removal often exceeding 6-log for indicator organisms when integrity is maintained. For numeric removal rates by pollutant, see the sibling note on MBR effluent quality.
| Parameter | Typical Range (Industrial) | Typical Range (Municipal) |
|---|---|---|
| MLSS Concentration | 10,000–15,000 mg/L | 8,000–12,000 mg/L |
| Flux Rate (Design) | 15–25 LMH | 20–30 LMH |
| Aeration Rate | 0.3–0.5 Nm³/m²·h | 0.2–0.4 Nm³/m²·h |
| Transmembrane Pressure (TMP) | 0.1–0.5 bar | 0.05–0.3 bar |
| SRT (Solids Retention Time) | 30–60 days | 20–40 days |
What Is a Flat Sheet Membrane Module?
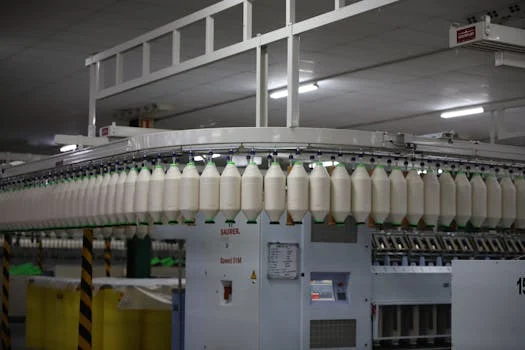
A flat sheet membrane module uses rigid or semi-rigid plates stacked in a cassette, while hollow fiber modules pack thousands of straw-like strands for higher surface area. Geometry choice drives CAPEX versus fouling risk. A pharmaceutical plant in Hangzhou moved from hollow fiber to flat sheet MBR at MLSS near 15,000 mg/L and cut chemical cleaning frequency by 40%.
Hollow fiber packing density of 300–600 m²/m³ suits large municipal plants that need compact tanks and backwash capability. Flat sheet units resist ragging better in oily or high-viscosity industrial streams. Specifiers often select the MBR Flat Sheet Membrane Module (DF Series) when MLSS stays high and manual panel access matters. Flat sheet scouring air is typically 0.3–0.5 Nm³/m²·h, slightly above many hollow fiber designs.
Can flat sheet MBR membranes be backwashed?
Most flat sheet MBR membranes are not backwashable; operators rely on air scour, relaxation, and chemical cleaning instead. Hollow fiber modules usually allow reverse permeate flow to dislodge foulants, which reduces chemical cleaning demand on municipal low-turbidity feeds. Flat sheet systems trade that feature for mechanical robustness at high MLSS. If pre-screening is weak, hollow fiber lines face higher ragging risk than flat sheet cassettes.
| Feature | Hollow Fiber MBR | Flat Sheet MBR |
|---|---|---|
| Pore Size | 0.03–0.1 μm (Ultrafiltration) | 0.1–0.4 μm (Microfiltration) |
| Operating Flux | 15–30 LMH | 20–40 LMH |
| Cleaning Method | Backwash + Air Scour + Chemical | Air Scour + Chemical (Relaxation) |
| Packing Density | High (Compact) | Moderate (Modular) |
| Energy Use | 0.2–0.4 kWh/m³ | 0.3–0.6 kWh/m³ |
| Best Use Case | Large Municipal, Low Turbidity | Industrial, High MLSS, Oily Waste |
MBR System Design: Key Engineering Parameters and Calculations
MBR membrane area must cover peak flow without exceeding critical flux, the point where foulant deposition outruns air scour removal. Industrial designers often use 20–25 LMH at 20°C as a starting flux. Temperature changes water viscosity and therefore the membrane area needed; engineers who compare hollow fiber MBR membrane technology should correct flux for cold-weather viscosity.
The sizing formula is: Membrane Area (m²) = Daily Flow (m³/day) / (24 × Flux (LMH) × 0.001). For 500 m³/day at 20 LMH, required area is 1,042 m². Scouring air scales with membrane area at about 0.2–0.4 Nm³/m²·h, while biological aeration must meet oxygen demand, typically 0.7–1.2 kg O₂ per kg BOD removed. Plants that automate MBR membrane cleaning with precise chemical dosing often dose NaOCl at 200–500 ppm for organic fouling and citric acid at 1–2% for inorganic scale.
| Design Parameter | Calculation Basis | Engineering Rule of Thumb |
|---|---|---|
| Design Flux (J) | LMH = Q / A | 20 LMH (Municipal), 15 LMH (Industrial) |
| Scouring Air (SADm) | Nm³/h = Rate × Area | 0.3 Nm³/m²·h per module |
| Membrane Lifespan | Operational Hours | 8–10 years with proper CIP |
| Chemical Dosing | Maintenance Clean | NaOCl (Weekly), Citric Acid (Quarterly) |
How Does MBBR Process Flow Differ From MBR?
MBBR process flow grows biofilm on plastic carriers inside an aerated tank, then sends mixed liquor to a clarifier or DAF for solids separation. MBR process flow keeps suspended biomass and replaces that clarifier with membranes, so effluent TSS is usually <1 mg/L versus 10–50 mg/L after MBBR plus clarification. MBBR energy is often 0.1–0.3 kWh/m³ and tolerates shock loads well, but it needs a separate solids step. Choose MBBR when load swings dominate; choose MBR when reuse or strict TSS limits dominate.
MBR vs. Conventional Wastewater Treatment: Performance, Costs, and ROI
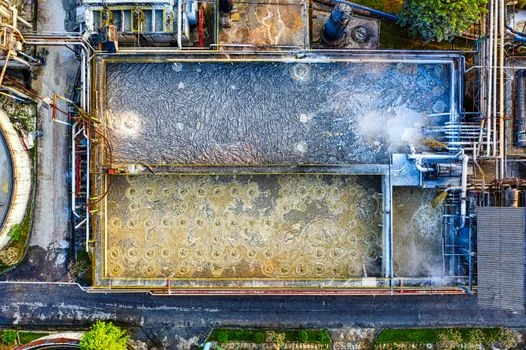
MBR capital cost is often $1,500–$3,000 per m³/day of capacity, versus $800–$1,500 per m³/day for CAS with clarifiers. MBR removes secondary clarifiers, tertiary filters, and large disinfection tanks, which can lower total project cost when land and civil works are expensive. Buyers evaluating turnkey MBR systems for municipal and industrial wastewater treatment usually recover cost through sludge reduction and reuse credits.
Aeration typically consumes 50–70% of MBR power. Longer SRT cuts sludge yield by about 30–50% versus CAS. For a 1,000 m³/day plant, lower hauling fees can save about $40,000 per year. Five-year TCO often favors MBR when land exceeds $500/m² or when TSS/BOD penalties are high.
| Metric | Conventional (CAS + Clarifier) | MBR System |
|---|---|---|
| Effluent TSS | 15–25 mg/L | <1 mg/L |
| Land Footprint | 100% (Baseline) | 30–40% of CAS |
| Energy (kWh/m³) | 0.3–0.4 | 0.5–0.7 |
| Sludge Yield | 0.4–0.6 kg TSS/kg BOD | 0.2–0.3 kg TSS/kg BOD |
| Disinfection | Required (UV/Chlorine) | Inherent (Membrane barrier) |
Selection checklist: (1) confirm peak and average flow at 20°C design flux; (2) match hollow fiber vs flat sheet to MLSS and screening quality; (3) separate biological oxygen demand from membrane scour air; (4) set TMP and CIP triggers before 0.5 bar; (5) verify discharge or reuse limits, including GB 18918 Class 1A where applicable; (6) price sludge haul and land separately from equipment CAPEX; (7) plan spare modules and chemical dosing redundancy.
Who this is for: plant engineers and EPC teams sizing compact reuse or Class 1A trains. Who should look elsewhere: sites with extreme salinity above about 10,000 mg/L without a halophilic or pre-treatment plan, or owners who only need secondary TSS around 15–25 mg/L on cheap land. Next step: send influent COD, peak flow, and target reuse quality for a membrane-area and aeration check.
Frequently Asked Questions
What is the typical lifespan of an MBR membrane module?
MBR modules typically last 8–10 years when TMP stays below 0.5 bar and CIP follows the vendor schedule. Lifespan shortens if flux stays above design for long periods or if screening fails. Flat sheet PVDF panels often reach the upper end of that range because mechanical stress is lower than on fine hollow fibers. Track permeability monthly and schedule recovery cleans before irreversible fouling locks in.
Can MBR systems handle high-salinity wastewater?
MBR can treat high-salinity wastewater, but salinity above 10,000 mg/L often slows ordinary heterotrophs and cuts COD removal. Textile and electronics plants usually need salt-tolerant biomass or upstream desalting before the membrane stage. Without that step, flux and biology both drift. See how MBR systems are applied in industrial wastewater treatment with complex chemical loads.
How does MBR compare to MBBR for effluent quality?
MBR produces lower TSS, typically below 1 mg/L, because membranes replace the clarifier used after MBBR. MBBR handles shock loads with less energy, often 0.1–0.3 kWh/m³, but effluent after clarification is usually 10–50 mg/L TSS. Pick MBR for reuse or tight solids limits. Pick MBBR when load swings dominate and a clarifier or DAF is acceptable.
What are the most common causes of MBR fouling?
Fouling usually follows excess flux, SADm below about 0.2 Nm³/m²·h, or high EPS from stressed biomass. Keeping MLSS in the 8,000–12,000 mg/L band and protecting screens reduces cake and pore blocking. Operators should trend TMP and specific flux together, not TMP alone. Early maintenance cleans cost less than delayed recovery cleans.
Are MBR systems suitable for small-scale applications?
Modular MBR packages suit hospitals, hotels, and small housing plants that need compact tanks and strong pathogen barriers. They fit sites where land is scarce and reuse of non-potable water offsets OPEX. Medical facilities often specify MBR for pathogen control before discharge. For clinic-scale trains, see medical wastewater treatment package options.
Further Reading

Explore these in-depth articles on related wastewater treatment topics: