Sand Filter Water Treatment Working Principle: Engineering Specs, 95%+ TSS Removal & Zero-Risk Selection Guide 2025
Sand filters remove 95%+ of total suspended solids (TSS) from industrial wastewater through a combination of mechanical straining, adsorption, and biological action. Rapid sand filters achieve 5–15 m³/m²/h flow rates with 0.5–1.0 mm media gradation, while slow sand filters deliver >99% pathogen removal at 0.1–0.3 m³/m²/h without chemicals. Both types meet EPA secondary treatment standards (TSS ≤30 mg/L) when properly sized for influent turbidity (typically 50–500 NTU).
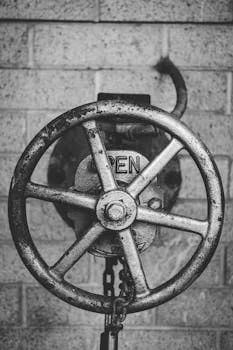
How Sand Filters Work: The 3 Core Mechanisms Behind 95%+ TSS Removal
Sand filtration effectively removes suspended solids and other contaminants from industrial wastewater through three primary mechanisms: mechanical straining, adsorption, and biological action. Understanding these processes is critical for engineers to predict and optimize filter performance based on specific influent characteristics.
- Mechanical Straining: This is the most straightforward mechanism, where particles larger than the interstitial spaces between sand grains are physically blocked and retained within the filter bed. In rapid sand filters, typical media sizes of 0.5–1.0 mm effectively trap particles down to approximately 20–50 micrometers. Slow sand filters, with finer media (0.15–0.3 mm), can strain even smaller particles, often down to 1–5 micrometers. The EPA's 2023 granular media guidelines emphasize that effective straining depends on a well-graded media bed to prevent premature clogging while maximizing particle capture.
- Adsorption: Beyond simple straining, sand filters utilize physicochemical forces to remove smaller, colloidal particles (typically <1 μm) that would otherwise pass through the media pores. Van der Waals forces and electrostatic attraction cause these charged particles to adhere to the surface of the sand grains. The efficiency of adsorption is influenced by the zeta potential of both the particles and the sand, with opposite charges promoting stronger binding. Pre-treatment with coagulants and flocculants (e.g., polyaluminum chloride or PAC) in rapid sand filters enhances this mechanism by neutralizing particle charges and forming larger, more easily adsorbed flocs.
- Biological Action: Slow sand filters uniquely incorporate a biological layer, known as the "Schmutzdecke" or "filter skin," which forms on the surface of the sand bed. This gelatinous layer, composed of bacteria, algae, fungi, and protozoa, actively degrades organic matter and consumes pathogens. The Schmutzdecke is responsible for the exceptional pathogen removal capabilities of slow sand filters, often achieving 90–99% removal of bacteria and viruses, as documented by WHO 2023 data. This biological activity contributes significantly to the overall effluent quality, especially for applications requiring high levels of disinfection without chemical intervention.
These mechanisms operate concurrently, with their relative importance varying depending on the filter type and operational parameters. Rapid filters emphasize straining and enhanced adsorption (with chemicals) at higher hydraulic loading rates (5–15 m³/m²/h), while slow filters rely on a combination of straining, adsorption, and extensive biological degradation at much lower rates (0.1–0.3 m³/m²/h), trading footprint for superior effluent quality and chemical-free operation.
Rapid vs. Slow vs. Upward Flow Sand Filters: Head-to-Head Comparison for Industrial Applications
Selecting the optimal sand filter for industrial wastewater requires a detailed understanding of each type's performance, design, and operational characteristics. Rapid, slow, and upward flow sand filters each offer distinct advantages and trade-offs in terms of effluent quality, footprint, and chemical requirements.
Performance Metrics
Rapid sand filters typically achieve 92–97% TSS removal and can reduce turbidity from hundreds of NTU down to 5–15 NTU with proper chemical dosing. Slow sand filters, due to their finer media and biological layer, deliver 95–99% TSS removal and can consistently produce effluent with turbidity <1 NTU, along with significant pathogen removal (2-4 log reduction for bacteria and viruses). Upward flow filters offer 90–95% TSS removal, often reaching 10–20 NTU effluent turbidity, making them suitable for robust pre-treatment applications.
Design Parameters
Media gradation is a primary differentiator: rapid filters use coarser sand (0.5–1.0 mm), while slow filters employ very fine sand (0.15–0.3 mm). Upward flow filters often use dual-media beds (e.g., anthracite over sand) for improved solids loading capacity. Bed depths range from 0.6–1.0 m for rapid and upward flow systems to 1.0–1.5 m for slow sand filters. Backwash frequency is a critical operational parameter, typically every 24–72 hours for rapid and upward flow filters, whereas slow sand filters are cleaned by scraping the Schmutzdecke every 1–3 months.
Chemical Requirements
Rapid and upward flow filters generally require chemical pre-treatment with coagulants and flocculants (e.g., 5–20 mg/L PAC or ferric chloride) to enhance particle aggregation and filtration efficiency. This directly impacts operational expenditure (OPEX) and sludge generation. Slow sand filters, by contrast, operate entirely without chemicals, making them attractive for applications where chemical addition is undesirable or prohibited, such as certain food processing or sensitive environmental discharges.
Footprint and Scalability
Upward flow filters offer a significant advantage in terms of footprint, reducing the required area by 30–40% compared to conventional gravity-fed rapid sand filters for the same flow rate. For example, a 100 m³/h system might require 20 m² for an upward flow design versus 30–35 m² for a rapid gravity filter. Slow sand filters, with their low hydraulic loading rates (0.1–0.3 m³/m²/h), demand the largest footprint, which can be a limiting factor for industrial sites with restricted space.
| Feature | Rapid Sand Filter (RSF) | Slow Sand Filter (SSF) | Upward Flow Sand Filter (UFSF) |
|---|---|---|---|
| TSS Removal Efficiency | 92–97% | 95–99% | 90–95% |
| Effluent Turbidity | 5–15 NTU (with chemicals) | <1 NTU (typically) | 10–20 NTU |
| Pathogen Removal | Limited (requires disinfection) | 2-4 Log Reduction (>99%) | Limited (requires disinfection) |
| Hydraulic Loading Rate | 5–15 m³/m²/h | 0.1–0.3 m³/m²/h | 5–12 m³/m²/h |
| Media Gradation | 0.5–1.0 mm sand | 0.15–0.3 mm sand | Dual-media (e.g., anthracite + sand) |
| Bed Depth | 0.6–1.0 m | 1.0–1.5 m | 0.8–1.2 m |
| Backwash Frequency | 24–72 hours | 1–3 months (scraping) | 24–48 hours |
| Chemical Requirement | Flocculants/Coagulants (e.g., PAC) | None | Flocculants/Coagulants (optional) |
| Footprint | Medium | Large | Small (30–40% less than RSF) |
| Typical Application | Industrial pre-treatment, municipal water | Rural water, high-purity applications | Industrial wastewater, pre-RO |
Engineering Specs: Media Gradation, Backwash Rates, and Influent/Effluent Quality Benchmarks
Precise engineering specifications are paramount for designing and operating sand filtration systems that consistently meet industrial wastewater treatment goals. These parameters dictate filtration efficiency, operational stability, and compliance with discharge standards.
Media Gradation and Characteristics
The choice and specification of filter media are fundamental. Rapid sand filters typically utilize sand with an effective size of 0.5–1.0 mm and a uniformity coefficient (UC) of ≤1.5. This ensures a balance between filtration capacity and backwash efficiency. Slow sand filters require much finer sand, with an effective size of 0.15–0.3 mm and a UC of ≤1.3, to achieve their high-purity effluent. Upward flow filters often employ a dual-media design, such as an upper layer of 0.8–1.2 mm anthracite over a lower layer of 0.5–0.8 mm sand, to optimize solids capture and allow for longer run times before backwash.
Backwash Parameters
Effective backwashing is crucial for maintaining filter performance and extending media lifespan. Backwash flow rates typically range from 30–50 m³/m²/h, sufficient to fluidize the filter bed and dislodge accumulated solids. The duration of a backwash cycle is usually 5–10 minutes, with frequency varying significantly from 24–72 hours depending on the influent TSS load, filter run time, and differential pressure across the bed. PLC-controlled chemical dosing for rapid sand filter optimization can integrate backwash cycles with filtration runs for maximum efficiency using systems like Zhongsheng Environmental's automatic chemical dosing system.
Influent Quality Limits
Sand filters perform optimally within specific influent quality ranges. Rapid filters can handle higher TSS loads, typically up to 500 mg/L, and turbidity up to 500 NTU. Slow sand filters are more sensitive, requiring influent TSS generally below 100 mg/L and turbidity below 50 NTU to maintain their biological activity and long run times. For all sand filter types, oil and grease content should ideally be kept below 10 mg/L to prevent media fouling and irreversible performance degradation. Pre-treatment steps, such as high-efficiency sedimentation tanks or dissolved air flotation, are often necessary to meet these influent limits.
Effluent Quality Benchmarks
Properly designed and operated sand filters can achieve stringent effluent quality targets. For industrial discharge, effluent TSS typically meets EPA secondary treatment standards of ≤30 mg/L. For applications requiring higher purity, such as pre-treatment for reverse osmosis (RO) systems, effluent turbidity can be reduced to ≤5 NTU (meeting WHO drinking water guidelines) and a Silt Density Index (SDI) of ≤5, which is critical for protecting RO membranes from fouling. Zhongsheng Environmental multi-media filters for RO pre-treatment often incorporate sand filtration as a primary stage.
| Parameter | Rapid Sand Filter (RSF) | Slow Sand Filter (SSF) | Upward Flow Sand Filter (UFSF) |
|---|---|---|---|
| Media Effective Size | 0.5–1.0 mm | 0.15–0.3 mm | 0.8–1.2 mm (anthracite), 0.5–0.8 mm (sand) |
| Uniformity Coefficient (UC) | ≤1.5 | ≤1.3 | ≤1.5 (for each media layer) |
| Bed Depth | 0.6–1.0 m | 1.0–1.5 m | 0.8–1.2 m |
| Backwash Flow Rate | 30–50 m³/m²/h | Manual scraping (no backwash) | 30–50 m³/m²/h |
| Backwash Duration | 5–10 minutes | N/A | 5–10 minutes |
| Backwash Frequency | 24–72 hours (based on ΔP/turbidity) | 1–3 months (scraping frequency) | 24–48 hours (based on ΔP/turbidity) |
| Max Influent TSS | 500 mg/L | 100 mg/L | 400 mg/L |
| Max Influent Turbidity | 500 NTU | 50 NTU | 400 NTU |
| Max Influent Oil/Grease | 10 mg/L | 10 mg/L | 10 mg/L |
| Effluent TSS Target | ≤30 mg/L (EPA secondary) | ≤10 mg/L | ≤30 mg/L |
| Effluent Turbidity Target | ≤5 NTU (with optimized chemicals) | <1 NTU | ≤10 NTU |
| Effluent SDI Target (for RO) | ≤5 | N/A | ≤5 |
Cost Breakdown: CAPEX, OPEX, and ROI for Industrial Sand Filtration Systems
Evaluating the financial viability of industrial sand filtration systems requires a comprehensive understanding of both capital expenditure (CAPEX) and operational expenditure (OPEX), alongside a clear return on investment (ROI) analysis. These costs vary significantly across different sand filter types.
Capital Expenditure (CAPEX)
CAPEX for rapid sand filters typically ranges from $50–$200 per m³/h of capacity, influenced by material choice (carbon steel, FRP, stainless steel), level of automation, and overall system complexity. Slow sand filters, requiring larger footprints and often more extensive civil works, command a higher CAPEX of $80–$300 per m³/h. Upward flow filters, due to their compact design and efficient use of media, generally fall between $60–$250 per m³/h. Key CAPEX drivers include the cost of filter vessels, media, underdrain systems, backwash pumps, controls, and installation.
Operational Expenditure (OPEX)
OPEX is a recurring cost that can significantly impact the long-term cost of ownership. For rapid sand filters, OPEX is typically $0.08–$0.25 per m³ of treated water, primarily driven by backwash energy (0.2–0.5 kWh/m³ of backwash water), chemical consumption (for coagulants/flocculants), and labor. Slow sand filters have a higher OPEX per m³ ($0.10–$0.30) due to manual media scraping and cleaning, despite zero chemical costs. Upward flow filters often have the lowest OPEX, ranging from $0.07–$0.20 per m³, benefiting from efficient backwash and potentially reduced chemical use. Media replacement is a significant OPEX component, with sand media typically lasting 5–10 years before requiring full replacement.
ROI Calculation Example
Consider a 100 m³/h industrial wastewater system treating influent with 500 mg/L TSS. A standalone dissolved air flotation (DAF) unit might achieve 80% TSS removal, resulting in 100 mg/L effluent TSS. Adding a rapid sand filter as a polishing step after DAF could reduce TSS to <30 mg/L, avoiding compliance fines (e.g., $500/day for exceeding discharge limits). The incremental CAPEX for the sand filter (e.g., $10,000–$20,000) and OPEX (e.g., $0.15/m³ or $360/day for 24/7 operation) could be offset by reduced fines and improved downstream process efficiency (e.g., less fouling of RO membranes, extending membrane lifespan). For more robust pre-treatment, Zhongsheng Environmental's dissolved air flotation (DAF) machines are often paired with sand filters.
Hidden Costs
Beyond direct CAPEX and OPEX, hidden costs can impact the total cost of ownership. These include media disposal, especially if the industrial wastewater contains hazardous contaminants that render the spent media a hazardous waste. Downtime for backwash or manual cleaning, particularly for slow sand filters, can also interrupt production. Labor costs for routine maintenance and monitoring, especially for more complex or manually intensive systems, should also be factored in.
| Cost Category | Rapid Sand Filter (RSF) | Slow Sand Filter (SSF) | Upward Flow Sand Filter (UFSF) |
|---|---|---|---|
| CAPEX ($/m³/h capacity) | $50–$200 | $80–$300 | $60–$250 |
| OPEX ($/m³ treated water) | $0.08–$0.25 | $0.10–$0.30 | $0.07–$0.20 |
| Primary OPEX Drivers | Chemicals, backwash energy, labor | Labor (scraping), backwash water | Backwash energy, minimal chemicals |
| Media Lifespan | 5–10 years | 10–20 years (with proper care) | 5–10 years |
| Backwash Energy (kWh/m³ backwash) | 0.2–0.5 | N/A | 0.2–0.4 |
| Chemical Costs (if applicable) | Moderate | None | Low (optional) |
| Footprint Cost Impact | Medium | High | Low (space saving) |
| Maintenance Complexity | Moderate (automated backwash) | High (manual scraping) | Moderate (automated backwash) |
How to Select the Right Sand Filter for Your Industrial Wastewater: A 5-Step Decision Framework
Selecting the appropriate sand filter type for industrial wastewater treatment requires a structured approach that considers specific site conditions, regulatory requirements, and operational preferences. This 5-step framework guides engineers and plant managers through the evaluation process.
Step 1: Define Effluent Quality Goals and Compliance Standards
The first critical step is to clearly establish the required effluent quality. This includes specific targets for TSS, turbidity, and potentially pathogen removal, along with any relevant compliance standards. For instance, discharge to public waterways might require meeting EPA secondary treatment standards (TSS ≤30 mg/L), while pre-treatment for an RO system demands much lower turbidity (≤5 NTU) and SDI (≤5). Local industrial discharge permits may impose additional, stricter limits.
Step 2: Characterize Influent Wastewater
Thorough characterization of the raw influent wastewater is essential. Key parameters to measure include TSS concentration, turbidity (NTU), oil and grease content, pH, temperature, and any specific contaminants relevant to your industry. A comprehensive checklist of lab tests should include these, as well as particle size distribution if possible. High TSS or turbidity often necessitates robust pre-treatment like sedimentation or DAF before sand filtration. Influent oil and grease above 10 mg/L can foul filter media, requiring upstream oil/water separation.
Step 3: Determine Flow Rate and Footprint Constraints
The required treatment flow rate (m³/h) and available physical space are critical design factors. High flow rates in limited footprints might push towards rapid sand filters or, more efficiently, upward flow filters, which can reduce the required area by 30–40% compared to gravity-fed systems. For sites with ample space and a desire for chemical-free treatment, slow sand filters are an option, despite their larger footprint. Zhongsheng Environmental offers all-in-one water purification systems that integrate sand filtration within compact designs.
Step 4: Evaluate Chemical Use Tolerance
Consider the willingness and capability to manage chemical addition. Rapid and upward flow filters often perform best with coagulants and flocculants, which adds to OPEX and requires handling and storage of chemicals. If chemical addition is undesirable due to cost, environmental concerns, or process restrictions (e.g., for certain food and beverage industries), a slow sand filter, which operates without chemicals, becomes a strong contender. This decision impacts not only cost but also operational complexity and environmental footprint.
Step 5: Compare CAPEX/OPEX and ROI
Finally, conduct a thorough financial analysis. Reference the cost breakdown section to compare the CAPEX and OPEX for rapid, slow, and upward flow filters based on your specific flow rate and effluent requirements. Calculate the potential ROI by factoring in avoided compliance fines, reduced maintenance on downstream equipment (e.g., how sand filters protect RO membranes from fouling), and any operational efficiencies gained. This comprehensive financial assessment, combined with the technical considerations, will guide the final selection.
Frequently Asked Questions
Q: What is the typical lifespan of sand filter media in industrial applications?
A: Sand filter media typically lasts 5–10 years in industrial applications, depending on the quality of influent water, frequency of backwashing, and the presence of corrosive or abrasive substances. Proper maintenance and regular backwashing can extend media life.
Q: Can sand filters remove oil and grease from industrial wastewater?
A: Sand filters are not ideal for high concentrations of oil and grease (>10 mg/L) as these can foul the media, leading to reduced efficiency and premature clogging. Pre-treatment with oil/water separators or DAF is typically required for oily wastewater streams.
Q: How do sand filters handle variable flow rates in industrial processes?
A: Rapid and upward flow sand filters can accommodate moderate variations in flow rate, especially if equipped with automated controls that adjust backwash frequency. Slow sand filters are less flexible and perform best with consistent, low flow rates.
Q: What are the main maintenance requirements for industrial sand filters?
A: For rapid and upward flow filters, primary maintenance involves routine backwashing, periodic inspection of media for channeling or loss, and calibration of chemical dosing systems. Slow sand filters require periodic scraping of the Schmutzdecke layer and eventual re-sanding.
Q: Are sand filters effective for pathogen removal in industrial wastewater?
A: Slow sand filters are highly effective for pathogen removal (90–99%) due to their biological layer. Rapid and upward flow filters offer limited pathogen removal and typically require a downstream disinfection step (e.g., UV, chlorination) if pathogen-free effluent is required.
Q: What is the significance of the Uniformity Coefficient (UC) for filter media?
A: The Uniformity Coefficient (UC) indicates the variation in particle sizes within the filter media. A lower UC (e.g., ≤1.5) signifies more uniform media, which is crucial for efficient filtration, consistent backwashing, and preventing channeling within the filter bed.