Ozone generators produce O₃ gas that oxidizes contaminants in water, delivering 99.99% microbial kill and 80–95% COD removal at 0.5–4 mg/L dose and 4–10 minutes contact time. Outputs range from 3–12 g/h for small units to 100 kg/h for municipal plants at 10–15 kWh/kg O₃. Dosage and contact time align with EPA 2024 guidance. Typical uses include food processing, pharmaceuticals, and semiconductor manufacturing where process water must meet ISO 22000 or WHO drinking-water criteria, and where residual-free oxidation is preferred over chlorination.
Why switch from chlorine to ozone for industrial water treatment?
Chlorine disinfection often fails modern industrial water-quality targets. EPA LT2ESWTR 2024 data shows chlorine achieving about 3-log removal of chlorine-resistant pathogens such as Cryptosporidium and Giardia, while ozone reaches 4-log removal. That gap matters in pharmaceutical and food plants that need ultra-pure process water.
Disinfection byproducts (DBPs) such as trihalomethanes (THMs) and haloacetic acids (HAAs) are another chlorine limitation. A 2023 Veolia study reported chlorine byproducts above EU Drinking Water Directive 98/83/EC limits in 22% of industrial applications. Ozone oxidizes contaminants without forming persistent halogenated DBPs. A dairy plant in Germany cut THM levels from 120 µg/L to below 10 µg/L after replacing chlorine with ozone disinfection, as reported in an Ozonia whitepaper, restoring compliance and improving process-water sensory quality.
Ozone’s electrochemical oxidation potential is 2.07 V, about 1.5 times that of chlorine (1.36 V). That higher potential breaks down a wider set of organics and inorganics—taste and odor compounds, color bodies, and complex pharmaceutical actives—so ozone functions as both a disinfectant and an oxidant in industrial wastewater and process-water trains.
How does an industrial ozone generator produce and dissolve O₃?
Industrial generators form ozone by splitting O₂ and recombining atomic oxygen into O₃, mainly by corona discharge or ultraviolet (UV) irradiation. Corona discharge covers over 90% of industrial systems because of higher efficiency and capacity; UV units are usually limited to outputs below 5 g/h.
In a corona discharge cell, a 3–20 kV field across a dielectric barrier acts on dry oxygen-rich feed gas (concentrated oxygen or dried ambient air). The discharge splits O₂ into atomic oxygen, which recombines with O₂ to form O₃. Conversion efficiency is typically 1–3% by weight. Feed gas must be dried to a dew point below −60°C to limit nitric acid formation that corrodes electrodes and cuts output.
Transfer into water follows Henry's Law; ozone solubility is about 13 mg/L at 20°C. Fine-bubble diffusers reach roughly 90% mass-transfer efficiency; venturi injectors can reach about 95% by drawing ozone into a high-velocity water stream. Method choice depends on system pressure, flow, and required contact time.
Microbial inactivation with ozone often follows first-order kinetics. For E. coli, the rate constant (k) is about 0.012 s⁻¹ at 1 mg/L O₃. Organic oxidation may follow second-order kinetics proportional to both ozone and contaminant concentration: -d[O₃]/dt = k[O₃][Contaminant]. After treatment, a residual of 0.1–0.4 mg/L is commonly targeted for sustained disinfection (EPA 2024). Excess ozone is removed by thermal or catalytic off-gas destruction, or by in-water quenching with activated carbon, UV, or sodium bisulfite.
| Ozone Generation Method | Feed Gas | Voltage/Wavelength | Typical Output | Conversion Efficiency | Primary Application |
|---|---|---|---|---|---|
| Corona Discharge | Dry Air or O₂ | 3-20 kV | 5 g/h - 100 kg/h | 1-3% (O₂ to O₃) | Industrial, Municipal |
| UV Irradiation | Ambient Air or O₂ | 185 nm UV-C | <5 g/h | <0.1% (O₂ to O₃) | Small-scale, Lab |
What ozone dosage and contact time does each contaminant need?
Dose and contact time must match the target contaminant and the required log reduction or COD cut. Typical engineering ranges are:
- Bacteria (e.g., E. coli, Legionella): 0.5–1 mg/L O₃ with 4–6 minutes contact in a well-designed contactor, consistent with EPA 2024 primary disinfection guidance.
- Viruses (e.g., Norovirus, Rotavirus): 1–2 mg/L O₃ with 8–10 minutes contact, aligned with WHO 2023 viral-pathogen recommendations.
- Chemical Oxygen Demand (COD) removal: 1–4 mg O₃ per mg COD and 10–15 minutes contact, depending on organic complexity (Ozotech benchmarks). Higher or more recalcitrant COD loads need higher dose or longer residence time.
- Color removal: For textile wastewater, 0.5–2 mg/L O₃ can remove up to 10 Pt-Co color units. HydropureWater field data from a dye plant showed 90% apparent-color reduction at 1.5 mg/L average dose over 7 minutes.
Residual ozone limits also drive post-treatment design. The EU Drinking Water Directive requires residual ozone below 0.05 mg/L at the tap. China’s GB 5749-2022 drinking-water standard sets a maximum residual of 0.3 mg/L. Both limits require quenching or off-gas destruction to stop ozone carryover.
| Contaminant Type / Objective | Typical Ozone Dosage (mg/L O₃) | Recommended Contact Time (min) | Relevant Standard / Benchmark |
|---|---|---|---|
| Bacteria (E. coli, Legionella) | 0.5 - 1.0 | 4 - 6 | EPA 2024 Guidelines |
| Viruses (Norovirus, Rotavirus) | 1.0 - 2.0 | 8 - 10 | WHO 2023 Recommendations |
| Chemical Oxygen Demand (COD) Reduction | 1.0 - 4.0 mg O₃/mg COD | 10 - 15 | Ozotech Benchmarks |
| Color Removal (per 10 Pt-Co units) | 0.5 - 2.0 | 5 - 8 | HydropureWater Field Data |
| Residual Ozone (EU Drinking Water) | <0.05 (post-treatment) | N/A | EU Drinking Water Directive |
| Residual Ozone (China Drinking Water) | <0.3 (post-treatment) | N/A | China GB 5749-2022 |
How do ozone, chlorine, and UV compare on kill rate, cost, and DBPs?
Technology selection should weigh microbial performance, CAPEX, OPEX, compliance, and maintenance together.
Ozone typically reaches 99.99% inactivation across a broad pathogen spectrum. Chlorine is usually near 99.9% and weaker against protozoan cysts. UV at standard doses (for example 40 mJ/cm²) also reaches about 99.9%, but performance falls when turbidity is high or UV transmittance is low (EPA 2024).
For plants treating 100–10,000 m³/h, ozone CAPEX commonly spans $150,000–$1,000,000; chlorine $50,000–$300,000; UV $80,000–$500,000. OPEX is often $0.05–$0.15/m³ for ozone (mainly generation energy), $0.02–$0.08/m³ for chlorine excluding DBP mitigation, and $0.03–$0.10/m³ for UV (lamp replacement and power), per 2023 Water Environment Federation data. For a deeper look at cost comparisons for advanced oxidation processes (AOP), further resources are available.
Ozone forms no regulated THMs or HAAs. Chlorine DBPs are tightly regulated and may need extra treatment. UV leaves no chemical residual, so distribution systems usually need secondary disinfection. Maintenance differs: ozone needs annual electrode replacement ($2,000–$10,000) and periodic cleaning; chlorine needs monthly cylinder handling and safety controls; UV needs quarterly lamp replacement ($5,000–$20,000/year) plus sleeve cleaning.
| Parameter | Ozone (O₃) | Chlorine (Cl₂) | Ultraviolet (UV) |
|---|---|---|---|
| Microbial Kill Rate | 99.99% (Broad-spectrum, Cysts) | 99.9% (Less effective on Cysts) | 99.9% (Turbidity-sensitive) |
| Disinfection Byproducts (DBPs) | None | THMs, HAAs (regulated) | None (but no residual) |
| Oxidation Potential | Very High (2.07 V) | Moderate (1.36 V) | N/A (Photochemical) |
| CAPEX (100-10,000 m³/h) | $150K – $1M | $50K – $300K | $80K – $500K |
| OPEX (per m³) | $0.05 – $0.15 | $0.02 – $0.08 | $0.03 – $0.10 |
| Maintenance | Annual electrode replacement ($2K-$10K) | Monthly cylinder handling, safety | Quarterly lamp replacement ($5K-$20K) |
| Residual Disinfection | Yes (0.1-0.4 mg/L) | Yes (0.2-2.0 mg/L) | No (requires secondary) |
Which engineering parameters decide the ozone generator size?
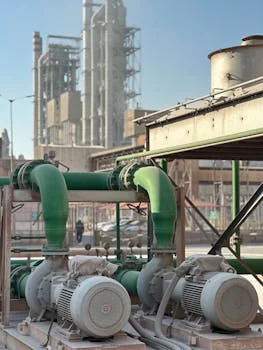
Match generator capacity to hydraulic load, water chemistry, and reliability needs using these seven parameters:
- Flow rate: Size output (g/h O₃) to flow (m³/h) and required dose. Treating 100 m³/h for general disinfection may need 50–200 g/h O₃, depending on contaminants and influent quality.
- Water quality and pre-treatment: Turbidity >5 NTU or TSS >10 mg/L lowers transfer efficiency and consumes ozone. Implementing pre-treatment for ozone water treatment systems, such as filtration or clarification, is crucial. One food plant saw a 30% rise in ozone efficiency after integrating pre-treatment systems for ozone water treatment to cut organic load and solids.
- Ozone concentration: Industrial units typically produce 3–12% O₃ by weight. Higher gas-phase concentration improves mass transfer and can shrink contactor volume and energy per gram transferred.
- Energy efficiency: Modern corona discharge generators run at about 8–15 kWh/kg O₃. Track kWh/kg O₃ when estimating long-term OPEX for high-capacity trains.
- Redundancy: Pharmaceutical loops and continuous manufacturing often need N+1 or 2N spare modules that auto-start on primary failure.
- Automation and control: PLC control with real-time residual ozone monitoring enables dose trim against influent quality and flow. Alarm setpoints for residual, feed-gas pressure, and off-gas ozone are required for safety and compliance.
- Footprint and integration: Skid-mounted or containerized layouts fit tight sites; a 500 g/h system can occupy about a 2×2 m footprint. For specialized duties such as ozone-based medical wastewater treatment systems, modular packages simplify installation.
What CAPEX, OPEX, and payback should a plant expect?
Budget both capital and operating costs before comparing ozone to chemical disinfection.
CAPEX: Industrial generators typically cost $1,500–$3,000 per g/h O₃ capacity. A 100 g/h package is roughly $150,000–$300,000, covering the generator, oxygen supply (PSA if used), contactor, off-gas destruct, controls, pumps, and instruments. Capacity, automation level, and redundancy drive most of the spread.
OPEX: Operating cost is usually $0.05–$0.15 per m³ treated, split approximately as energy 60%, maintenance 20%, oxygen source 15%, and labor 5%. Energy covers the generator, oxygen concentrator, and pumps; maintenance covers dielectric/electrode replacement every 1–3 years plus sensor calibration.
ROI: Food and beverage plants commonly see 1.5–3 year payback when chemical spend, discharge fees, or product quality losses are high. A $500,000 beverage-plant installation reported $200,000/year savings from lower chemical purchases, reduced discharge fees, and longer shelf life—about 2.5 years payback. Hidden costs include off-gas destruction, residual quenching (for example activated carbon), and pre-treatment such as filtration or pH adjustment.
| Cost Category | Typical Range | Key Drivers |
|---|---|---|
| CAPEX (per g/h O₃ capacity) | $1,500 – $3,000 | Ozone capacity, automation level, redundancy, feed gas system (PSA vs. LOX) |
| OPEX (per m³ treated water) | $0.05 – $0.15 | Energy cost, oxygen source, labor rates, maintenance frequency |
| OPEX Breakdown: | ||
| Energy | ~60% of OPEX | Ozone generator efficiency (kWh/kg O₃), electricity rates |
| Maintenance | ~20% of OPEX | Electrode replacement, routine servicing, parts |
| Oxygen Source | ~15% of OPEX | Cost of LOX or PSA energy/maintenance |
| Labor | ~5% of OPEX | Monitoring, minor adjustments |
| Typical ROI (Payback Period) | 1.5 – 3 years | Chemical savings, regulatory compliance, product quality improvement |
What do plant engineers ask most about ozone systems?
What is the lifespan of an industrial ozone generator?
Industrial corona discharge ozone generators typically have a lifespan of 10–15 years for the core unit, with dielectric cells or electrodes requiring replacement every 1–3 years depending on operational intensity. UV lamps in smaller systems generally last 5–8 years.
Can ozone treat pharmaceutical wastewater?
Yes, ozone is highly effective for pharmaceutical wastewater, achieving 90–98% Chemical Oxygen Demand (COD) removal for many Active Pharmaceutical Ingredients (APIs). However, for recalcitrant compounds, advanced oxidation processes (AOPs) like ozone combined with hydrogen peroxide (O₃/H₂O₂) or UV are often required to achieve complete degradation.
What are the safety risks of ozone generators?
Ozone is a strong oxidant and respiratory irritant, making safety paramount. The Occupational Safety and Health Administration (OSHA) sets a Permissible Exposure Limit (PEL) of 0.1 ppm for an 8-hour Time-Weighted Average (TWA). Industrial systems require robust safety measures, including continuous ozone leak detectors, adequate ventilation, and off-gas destruction units to prevent ozone release into the environment.
How does ozone compare to chlorine dioxide for water treatment?
Ozone offers faster microbial kill rates and does not produce regulated halogenated byproducts, making it a strong choice for primary disinfection and advanced oxidation. Chlorine dioxide (ClO₂) provides a longer-lasting residual and is effective against some chlorine-resistant organisms, making it better suited for maintaining disinfection in extensive distribution systems, though it can also form some byproducts.
What pre-treatment is needed for ozone water treatment?
Effective ozone treatment requires specific pre-treatment to optimize performance and protect equipment. This typically includes filtration to reduce turbidity to less than 5 NTU and total suspended solids (TSS) to below 10 mg/L. Additionally, pH adjustment to a range of 6–8 is often beneficial, and removal of iron and manganese to concentrations below 0.1 mg/L is critical to prevent ozone scavenging and scaling.
Who this is for / Who should look elsewhere / Next step
This guide is for plant owners, process engineers, and procurement teams sizing ozone for industrial process water or wastewater where DBP limits, cyst inactivation, or COD/color oxidation drive design. Facilities that only need a long distribution residual, treat very low flows under a few g/h, or cannot provide dry feed gas and off-gas destruct should evaluate chlorine, chlorine dioxide, or UV first. Next step: lock influent COD, turbidity, flow (m³/h), and residual limits, then size g/h output and contactor residence time against the dose table above.