Why PV Wastewater Discharge Standards Are Fragmenting in 2025
PV wastewater discharge standards vary significantly by region, directly impacting solar manufacturers' compliance costs and treatment strategies. China’s GB 31573-2015 mandates COD < 80 mg/L, TSS < 50 mg/L, and fluoride < 10 mg/L, while India’s CPCB enforces stricter fluoride limits (<2 mg/L). The US EPA’s 2024 ELG for steam electric plants (applicable to PV via subcategories) requires zero discharge for FGD wastewater using chemical precipitation + membrane filtration. Hybrid ZLD systems, like Gradiant’s 75% recovery solution, are emerging as cost-effective alternatives to meet these standards while enabling water reuse in water-scarce regions.
The regulatory landscape in 2025 is defined by a shift from broad industrial effluent limits to technology-based, subcategory-specific mandates. In the United States, the July 2024 revisions to the Effluent Limitations Guidelines (ELG) for the steam electric power generating category have created a ripple effect in the PV sector. While primarily targeting coal-fired plants, the BAT (Best Available Technology) requirements for combustion residual leachate and flue gas desulfurization (FGD) wastewater set a precedent for high-purity water sectors, including solar cell manufacturing. These rules prioritize zero liquid discharge (ZLD) for specific waste streams, forcing US-based manufacturers to evaluate membrane filtration and evaporation technologies earlier in the plant design phase.
In China, the enforcement of GB 31573-2015 (Standard for Emission of Pollutants from Electronic Industry) has entered a phase of strict environmental auditing. Non-compliance now carries penalties including fines up to 1 million RMB, immediate production halts, and mandatory public disclosure of violations. This has forced manufacturers in hubs like Jiangsu and Anhui to move beyond simple neutralization toward advanced MBR systems for COD and TSS compliance in solar manufacturing. The timeline for compliance is no longer a suggestion; quarterly inspections and real-time monitoring of discharge outlets are now standard across the Yangtze River Delta.
India represents the most aggressive shift in fluoride management. The Central Pollution Control Board (CPCB) has identified PV manufacturing hubs in Gujarat and Tamil Nadu as high-risk areas for groundwater contamination. Because natural water sources in these regions are already concentrated in fluorine, the discharge standard is strictly enforced at <2 mg/L. This is significantly more stringent than the 10-20 mg/L limits common in other industrial sectors, necessitating specialized fluoride removal strategies for semiconductor and PV wastewater. Meanwhile, the EU’s Urban Waste Water Directive 91/271/EEC continues to focus on oxygen-demanding substances, though new PV-specific guidance is expected by late 2025 to address heavy metal leaching from end-of-life and manufacturing scrap.
Global PV Wastewater Discharge Standards Compared: China GB vs US EPA vs EU vs India
Regional discharge limits for photovoltaic manufacturing are determined by local water scarcity, existing infrastructure, and the specific chemical profile of the manufacturing process (mono-Si vs. poly-Si). While pH and Temperature are universally regulated, the divergence in Chemical Oxygen Demand (COD) and Fluoride limits creates the most significant engineering challenges for global manufacturers. China’s standards are currently the most comprehensive for the electronic industry, providing specific limits for over 20 parameters, whereas US and EU standards often rely on broader Clean Water Act or Urban Waste Water mandates.
| Parameter | China (GB 31573-2015) | US (EPA ELG 2024*) | EU (UWWTD 91/271) | India (CPCB PV-Specific) |
|---|---|---|---|---|
| COD (mg/L) | < 80 (Direct) / < 200 (Indirect) | Case-by-case (Permit based) | < 125 | < 250 (General) / < 100 (Sensitive) |
| TSS (mg/L) | < 50 | < 30 (Monthly Avg) | < 35 | < 100 |
| Fluoride (mg/L) | < 10 | Not federally mandated** | Varies by State (e.g., < 15) | < 2.0 |
| Heavy Metals (Pb, Cd) | Pb < 0.2; Cd < 0.01 | Pb < 0.69; Cd < 0.11 (ELG) | Regulated by Member State | Pb < 0.1; Cd < 2.0 |
| pH | 6.0 – 9.0 | 6.0 – 9.0 | 6.5 – 9.5 | 5.5 – 9.0 |
| Sampling/Enforcement | 24-hour composite; Quarterly | Continuous for large units | Monthly grab samples | Weekly grab samples |
*US EPA ELG 2024 requirements focus on zero discharge for specific streams like FGD; other streams follow general NPDES permits. **Fluoride is typically managed via local POTW limits in the US.
In China, the distinction between "Direct" and "Indirect" discharge is critical for CAPEX planning. Direct discharge into surface waters requires an MBR system for COD and TSS compliance, while indirect discharge to a municipal plant allows for higher COD levels but still mandates pre-treatment for fluoride and heavy metals. In the US, the 2024 ELG revisions emphasize technology-based limits. For plants categorized under steam electric subcategories, the EPA now assumes the use of membrane filtration as the Best Available Technology, essentially mandating a level of treatment that approaches ZLD for toxic metal removal. India's CPCB enforcement is unique in its focus on fluoride; the <2 mg/L limit is a response to the "Fluorosis" health crisis, making a lamella clarifier for chemical precipitation sludge separation an indispensable component of any Indian PV factory’s ETP (Effluent Treatment Plant).
Engineering Solutions to Meet PV Wastewater Standards: Tech Specs and Performance Data

Achieving compliance with 2025 discharge standards requires a multi-stage treatment approach that balances pollutant removal efficiency with energy consumption. For high-volume TSS removal, particularly from wafer sawing and grinding, a high-efficiency DAF system for TSS removal in PV wastewater is the industry standard. DAF systems utilize micro-bubbles (30-50 μm) to float suspended solids, achieving removal rates of 92-97% (per EPA 2024 benchmarks). This is critical for meeting China's <50 mg/L TSS limit and protecting downstream membrane units from fouling.
Fluoride removal, the most difficult challenge in PV wastewater, relies on chemical precipitation followed by high-rate clarification. Using Calcium Chloride (CaCl₂) or Lime (Ca(OH)₂) at a pH of 8.5-9.0 allows for the formation of CaF₂ precipitates. To reach India’s <2 mg/L limit, a secondary polishing stage using activated alumina or an RO system for fluoride and heavy metal removal in PV wastewater is often required. The table below outlines the engineering parameters for the primary technologies used to meet global standards.
| Technology | Target Pollutant | Influent Range (mg/L) | Effluent Guarantee | Energy (kWh/m³) | Regional Suitability |
|---|---|---|---|---|---|
| DAF (Dissolved Air Flotation) | TSS, Oil/Grease | 500 - 2,000 | < 30 mg/L | 0.2 - 0.5 | China GB, EU UWWTD |
| Chemical Precipitation | Fluoride, Metals | 50 - 500 | < 8 mg/L | 0.1 - 0.3 | Universal (Pre-treatment) |
| MBR (Membrane Bioreactor) | COD, BOD, TSS | 200 - 1,000 | < 20 mg/L | 0.8 - 1.2 | China GB (Direct Discharge) |
| RO (Reverse Osmosis) | TDS, Fluoride | 1,000 - 5,000 | < 1 mg/L | 1.5 - 2.5 | India CPCB, US ZLD |
| Hybrid ZLD | All Pollutants | Variable | Zero Liquid | 4.0 - 8.0 | Water-Scarce Regions |
Operational parameters significantly influence these outcomes. For example, DAF performance is contingent on saturation pressure; HydropureWater field data (2025) suggests 4-6 bar is optimal for PV silicon powder removal. In chemical precipitation, a CaCl₂ dosage of 200-500 mg/L is standard, but the addition of an anionic polymer flocculant in a lamella clarifier is necessary to ensure the resulting sludge settles rapidly, preventing TSS carryover. For COD removal, MBR systems provide a 95%+ removal rate, which is essential when treating the organic-rich wastewater from cell cleaning and texturing processes.
Cost Breakdown: Compliance Solutions for PV Wastewater Discharge Standards
Procurement teams must weigh the high CAPEX of advanced treatment systems against the long-term OPEX and regulatory risks of non-compliance. In 2025, the "Hybrid ZLD" model has emerged as the most economically viable strategy for large-scale manufacturers. By combining membrane filtration with high-recovery RO and minimal evaporation, factories can achieve 75-85% water reuse, significantly reducing the cost of raw water intake in regions like Northern China or Southern India. A 2025 hybrid ZLD system design for PV wastewater recycling typically pays for itself within 3-5 years through water savings and avoided fines.
The following table compares the financial impact of different compliance strategies based on a 1,000 m³/day treatment capacity. Data is aggregated from recent EPA 2024 compliance cost studies and HydropureWater project benchmarks.
| Solution Strategy | CAPEX (Est. USD) | OPEX (USD/m³) | Recovery Rate | Primary Driver |
|---|---|---|---|---|
| Chemical + Discharge | $400k - $700k | $0.35 - $0.55 | 0% | Basic Compliance (China/EU) |
| Membrane + Discharge | $800k - $1.5M | $0.70 - $1.10 | 60 - 70% | US EPA ELG / China Direct |
| Hybrid ZLD | $2.0M - $3.5M | $1.50 - $2.50 | 85 - 95% | India Fluoride / Water Scarcity |
| Full ZLD (Evaporative) | $5.0M - $8.0M | $4.00 - $6.50 | 99%+ | Extreme Regulatory Mandate |
The primary cost drivers for ZLD are energy for thermal evaporators and the disposal of solid salt cakes. However, a hybrid ZLD system design for PV wastewater with 99.9% recovery minimizes these costs by utilizing high-pressure RO to concentrate the brine before it reaches the evaporator. For US and EU manufacturers, where discharge to a Publicly Owned Treatment Works (POTW) is often possible, a "Membrane + Discharge" strategy using an RO system for fluoride removal is usually sufficient. In contrast, Indian plants must prioritize the hybrid ZLD model because the cost of sludge disposal for high-fluoride waste is 30% higher than standard industrial sludge due to its classification as hazardous waste.
Case Study: How a 500 MW Solar Plant in India Achieved 99% Fluoride Compliance with Hybrid ZLD
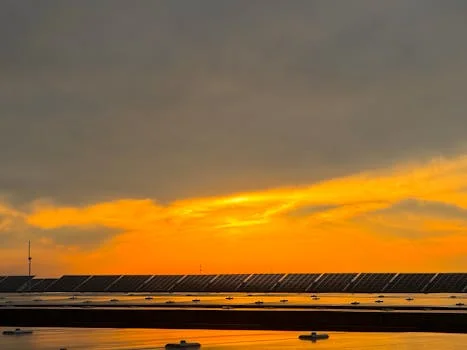
A 500 MW solar cell manufacturing facility in Gujarat faced a critical compliance challenge: influent fluoride levels reached 20 mg/L, while the local CPCB limit was strictly <2 mg/L. the high silica content in the wastewater (80-120 mg/L) caused rapid fouling of standard RO membranes, leading to weekly downtime for chemical cleaning. The plant needed a solution that could handle high-fluoride, high-silica waste while maintaining a recovery rate of at least 80% to meet sustainability goals.
The implemented solution utilized a three-stage process. First, chemical precipitation was performed using Calcium Chloride and Sodium Hydroxide to raise the pH to 8.8, facilitating the formation of calcium fluoride. This was followed by a lamella clarifier for chemical precipitation sludge separation, which reduced fluoride to <8 mg/L and TSS to <20 mg/L. To achieve the final <2 mg/L mandate, the water passed through a dual-stage RO system for fluoride and heavy metal removal in PV wastewater. To mitigate silica scaling, an antiscalant dosing system (10-15 mg/L) was integrated into the RO feed, and a crystallizer was used to handle the final RO reject.
The performance data post-commissioning showed fluoride levels consistently below 1.8 mg/L, comfortably meeting CPCB standards. The system achieved an 85% water recovery rate, and the total CAPEX for the 1 MLD (Million Liters per Day) system was approximately $2.1M. Key lessons learned from this installation include the criticality of precise pH control—dropping below pH 8.0 immediately increased effluent fluoride to >5 mg/L. By automating the dosing pumps and utilizing real-time fluoride sensors, the plant enabled a 2X production expansion without increasing its freshwater footprint.
Frequently Asked Questions About PV Wastewater Discharge Standards
Q: What are the penalties for exceeding PV wastewater discharge limits in China?
A: Under the enforcement guidelines of GB 31573-2015, penalties include fines up to 1M RMB, mandatory production halts for corrective action, and potential criminal liability for plant managers if toxic substances (like cadmium) are illegally discharged. Inspections occur quarterly, with continuous monitoring required for large-scale emitters.
Q: How do I choose between ZLD and hybrid systems for PV wastewater?
A: The decision depends on three factors: water scarcity, local fluoride limits, and factory scale. Use this decision framework:
1. Is water cost >$1.50/m³ or is there a "Zero Discharge" mandate? → Full ZLD.
2. Is the fluoride limit <2 mg/L (e.g., India) and water recovery a priority? → Hybrid ZLD.
3. Are local limits lenient and water abundant (e.g., portions of US/EU)? → Membrane Filtration + Discharge.
Q: What’s the most cost-effective way to remove fluoride from PV wastewater?
A: Chemical precipitation with Calcium Chloride (200-500 mg/L) at pH 8.5-9.0, followed by a lamella clarifier. This typically achieves <10 mg/L fluoride for approximately $0.30/m³ OPEX. If <2 mg/L is required, a polishing RO or activated alumina stage is necessary.
Q: Are there PV-specific wastewater standards in the EU?
A: Currently, there is no single "PV Directive." Manufacturers must comply with the Urban Waste Water Directive 91/271/EEC (COD <125 mg/L, TSS <35 mg/L). However, individual countries like Germany (AbwV) enforce stricter local limits for specific pollutants like copper and tin used in ribbon soldering.
Q: How often should PV wastewater be tested for compliance?
A: Requirements vary by region: China mandates quarterly composite sampling; the US requires continuous monitoring for units >50 MW and monthly for smaller plants; India typically requires weekly grab samples for fluoride to maintain CPCB compliance.