The TFT-LCD Wastewater Challenge: Why Conventional Treatment Fails
TFT-LCD color filter manufacturing processes generate high-strength wastewater with Chemical Oxygen Demand (COD) ranging from 1,200 to 3,500 mg/L and ethanolamine (MEA) concentrations between 200 and 600 mg/L. These contaminants, alongside tetramethylammonium hydroxide (TMAH) and various photoresists, create a complex chemical profile that resists standard biological degradation. The primary technical hurdle is the exceptionally low BOD/COD ratio, which typically falls below 0.2. This "refractory" nature means that directly applying an activated sludge process or traditional anaerobic digestion will result in biological inhibition and system failure (HydropureWater field data, 2025).
Regulatory pressure further complicates the engineering requirements. In China, the GB 31573-2015 standard mandates a COD discharge limit of <50 mg/L for the electronics industry, while the EU Urban Waste Water Directive sets limits at <125 mg/L. In regions like Taiwan, the Environmental Protection Administration (EPA) has tightened MEA discharge limits to <10 mg/L due to its high nitrogen content and potential for eutrophication. Meeting these standards requires a comprehensive approach to future-proofing TFT-LCD wastewater systems with 99.9% recovery.
Common pretreatment failures in large-scale fabs often stem from pH instability and chemical overdosing. In many audits of existing facilities, engineers observe that traditional Fenton oxidation—while chemically capable of breaking down MEA—produces excessive iron sludge (up to 20% of total volume), which leads to downstream clogging and high disposal costs. Residual organics and suspended solids (TSS) often ranging from 300 to 800 mg/L cause rapid membrane fouling in Reverse Osmosis (RO) systems, reducing water recovery rates to less than 60% and forcing frequent, costly chemical cleanings (CIP).
Hybrid ZLD System Design: How Fluidized-Bed Fenton, DAF, and MBR Work Together
A hybrid Zero Liquid Discharge (ZLD) system for TFT-LCD wastewater utilizes a four-stage treatment train to degrade recalcitrant organics and recover high-purity process water. The first critical stage is fluidized-bed Fenton oxidation. Unlike traditional stirred-tank Fenton, the fluidized-bed reactor uses carrier media (typically silica sand) to facilitate the crystallization of iron oxide on the carrier surface. This reduces sludge production by 60–80% while maintaining high oxidation potential. Operating at pH 3 with a molar ratio of [Fe²⁺]=5mM and [H₂O₂]=60mM, this stage achieves up to 98.9% MEA removal within a 2-hour hydraulic retention time (Anotai et al., 2012).
Following oxidation, the wastewater enters a DAF system for TFT-LCD wastewater pretreatment. The Dissolved Air Flotation (DAF) unit is essential for removing the micro-flocs and residual oils/photoresists that survive Fenton treatment. By introducing micro-bubbles (20–40 microns), the DAF system lifts suspended solids to the surface for mechanical skimming, reducing TSS from 750 mg/L to <30 mg/L. This protects the downstream biological and membrane units from physical abrasion and organic loading spikes. For more on this mechanism, engineers can review DAF system engineering and efficiency data.
The third stage employs DF series flat-sheet MBR modules for TFT-LCD effluent polishing. The Membrane Bioreactor (MBR) combines the advantages of activated sludge with membrane filtration. Because the Fenton and DAF stages have already broken down complex MEA into smaller, biodegradable organic acids, the MBR can effectively reduce the remaining COD to <50 mg/L. Finally, a multi-stage reverse osmosis (RO) system concentrates the remaining salts and polishes the water for reuse in cooling towers or non-critical fab processes, achieving a total system water recovery of 95%.
| Treatment Stage | Key Technology | Primary Parameter/Dosing | Removal Target |
|---|---|---|---|
| Pre-oxidation | Fluidized-bed Fenton | pH 3.0, H₂O₂: 2.0 kg/m³ | 98% MEA, 70% COD |
| Clarification | DAF | Recycle ratio: 30%, Air: 50L/min | 95% TSS, residual FOG |
| Bio-Polishing | DF Series MBR | Flux: 15 LMH, HRT: 12h | COD <50 mg/L, NTU <0.5 |
| ZLD Recovery | High-Pressure RO | Operating Pressure: 4.5 MPa | 95% Water Recovery |
Operational Results: 99.8% COD Removal and 95% Water Recovery
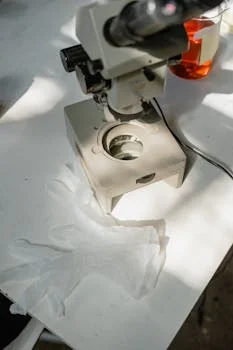
Full-scale operational data from a TFT-LCD manufacturing plant in eastern China confirms that the hybrid ZLD approach exceeds regional discharge standards while maintaining high uptime. The influent wastewater profile was characterized by a COD of 3,200 mg/L, MEA of 500 mg/L, and TSS of 750 mg/L. After the integrated treatment process, the final effluent reached a COD of <45 mg/L and MEA concentrations below the detection limit of 5 mg/L. This performance ensures continuous compliance with China’s GB 31573-2015 standards, even during production peaks where organic loading can fluctuate by 25%.
System reliability is maintained through a 98.5% uptime record over a 12-month monitoring period. Maintenance is streamlined into a 4-hour weekly window, primarily focused on sensor calibration and chemical replenishment. Membrane fouling, a common failure point in electronics wastewater, was mitigated by the DAF pretreatment stage, which kept the Silt Density Index (SDI) of the MBR permeate consistently below 3.0. This allows the RO membranes to operate for 6–9 months between intensive cleanings, significantly reducing the total cost of ownership compared to systems that omit the DAF or Fenton stages. For facilities handling similar waste streams, such as those in the semiconductor sector, these metrics align with IC etching wastewater treatment strategies involving complex chemical removal.
| Parameter | Influent (mg/L) | Effluent (mg/L) | Removal Efficiency (%) |
|---|---|---|---|
| CODcr | 3,200 | <45 | 98.6% |
| Ethanolamine (MEA) | 500 | <1 | >99.8% |
| Total Suspended Solids | 750 | <5 | 99.3% |
| Ammonia Nitrogen (NH₃-N) | 120 | <8 | 93.3% |
Chemical consumption remains the largest component of the daily operational budget. For this 50 m³/h system, the consumption of Hydrogen Peroxide (H₂O₂) averaged 0.8 kg/m³, while Ferrous Sulfate (FeSO₄) was maintained at 0.3 kg/m³. Sodium Hydroxide (NaOH) consumption for post-Fenton pH neutralization was 0.2 kg/m³. By utilizing a fluidized-bed design, the facility avoided the use of traditional polymer flocculants in the Fenton stage, further reducing chemical complexity and sludge handling requirements.
Cost Breakdown: CAPEX, OPEX, and ROI for a 50 m³/h System
The capital expenditure (CAPEX) for a 50 m³/h hybrid ZLD system is approximately $2.1M, representing a comprehensive turnkey solution from primary oxidation to brine concentration. While this initial investment is 20% higher than a conventional standalone Fenton-and-sedimentation system, the lifecycle costs are significantly lower. The CAPEX breakdown includes $450,000 for the fluidized-bed Fenton reactors, $300,000 for the DAF units, $600,000 for the DF MBR modules, and $500,000 for the RO and brine management system. Civil engineering and site integration account for the remaining $250,000.
Operational expenditure (OPEX) is calculated at $0.85 per cubic meter of treated water. This figure is highly competitive for ZLD applications, where costs often exceed $1.50/m³ in less integrated designs. The $0.85/m³ cost is subdivided into chemicals ($0.35), energy consumption ($0.20), labor ($0.15), and preventative maintenance ($0.15). The reduction in chemical costs is a direct result of the fluidized-bed Fenton’s efficiency and the high-performance MBR, which reduces the need for tertiary polishing chemicals.
| Cost Category | Unit Cost ($/m³) | Annual Total (50 m³/h) | % of OPEX |
|---|---|---|---|
| Chemicals (H₂O₂, FeSO₄, NaOH) | 0.35 | $153,300 | 41% |
| Energy (Pumping, Aeration) | 0.20 | $87,600 | 24% |
| Labor & Engineering | 0.15 | $65,700 | 18% |
| Maintenance & Consumables | 0.15 | $65,700 | 17% |
| Total OPEX | 0.85 | $372,300 | 100% |
The Return on Investment (ROI) for this system is achieved in 3.2 years. This calculation factors in the direct savings from water reuse ($0.50/m³ saved on municipal water procurement) and the avoidance of high-concentration discharge fees and potential environmental fines ($0.20/m³). Sensitivity analysis shows that even with varying influent COD levels (from 1,200 to 3,500 mg/L), the ROI remains stable between 2.8 and 4.1 years. This financial predictability is essential for procurement teams justifying the transition to ZLD technology to their finance departments.
Lessons Learned: 3 Mistakes to Avoid in TFT-LCD Wastewater Projects
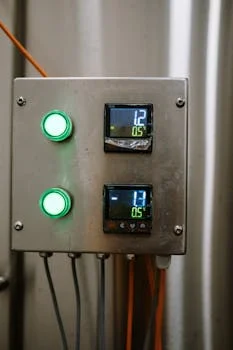
One of the most frequent mistakes in TFT-LCD wastewater design is underestimating the variability of MEA concentrations. Production cycles can cause MEA levels to swing from 50 mg/L to over 600 mg/L in a single shift. A static chemical dosing regimen will either under-treat the waste (leading to compliance failure) or over-treat