TFT-LCD Wastewater Treatment 2026: Hybrid ZLD System Design, Cost Breakdown & 99.9% Recovery Blueprint
TFT-LCD wastewater treatment in 2026 demands hybrid zero liquid discharge (ZLD) systems to handle 200,000 CMD of complex effluent (per PubMed 2023 data) while complying with 70–85% water reuse mandates (Taiwan case study). Key contaminants—DMSO (430 mg/L), MEA (800 mg/L), and TMAH (190 mg/L)—require tailored pretreatment to prevent membrane fouling in MBR-RO-EDR systems. Electro-Fenton achieves 99% COD removal at $256/ton (per ASCE 2023 benchmarks), while hybrid A/O SBR + DAF systems reduce CAPEX by 30% for flows >100 m³/h. This guide provides a step-by-step ZLD design blueprint, cost breakdowns, and a recovery calculator for 5+ treatment pathways.Why TFT-LCD Wastewater Treatment is Failing in 2026: The Contaminant Crisis
Global TFT-LCD wastewater volume is projected to exceed 200,000 CMD by 2026, driving significant increases in treatment complexity and cost (per PubMed 2023 data). Traditional, generic wastewater treatment systems often fail to adequately address the specific chemical properties and interactions of TFT-LCD manufacturing effluent, leading to regulatory non-compliance, membrane fouling, and elevated operational expenses. The core challenge lies in the unique cocktail of highly soluble, slowly biodegradable, and toxic organic compounds characteristic of this industry.DMSO (Dimethyl Sulfoxide): Typically found at concentrations up to 430 mg/L in TFT-LCD effluent, DMSO is a highly soluble aprotic solvent. Its high solubility and resistance to conventional biological degradation (biodegradability index often <0.3) necessitate advanced oxidation processes (AOPs). UV/H₂O₂ oxidation, for instance, achieves 90%+ removal by generating hydroxyl radicals that break down the stable DMSO molecule (ASCE 2023 benchmarks). Inadequate DMSO removal leads to increased chemical oxygen demand (COD) in subsequent stages and can significantly contribute to organic fouling of reverse osmosis (RO) membranes.
MEA (Monoethanolamine): Present at concentrations around 800 mg/L, MEA is a strongly alkaline compound (pH 10–12). Its presence elevates wastewater pH, which can inhibit biological activity and form toxic byproducts such as ammonia during treatment. Effective neutralization with H₂SO₄ to a pH range of 7–8 is therefore critical before wastewater enters biological treatment stages. Failure to control pH can drastically reduce the efficiency of activated sludge systems and increase overall operational burden.
TMAH (Tetramethylammonium Hydroxide): With typical concentrations of 190 mg/L, TMAH is a quaternary ammonium compound widely used as a developer in TFT-LCD production. It is highly toxic to microorganisms, making conventional biological treatment ineffective for its removal. Chemical precipitation, often utilizing Na₂S, can achieve 95%+ removal of TMAH by converting it into less soluble forms, while electrocoagulation offers an alternative with 98%+ removal efficiency (per EPA 2024 guidelines). Without specific TMAH removal, biological systems will suffer severe inhibition, leading to high effluent COD and potential regulatory violations.
These contaminants do not act in isolation. For example, DMSO and MEA can form stable complexes that exacerbate RO membrane fouling, reducing flux and increasing cleaning frequency. This synergistic fouling mechanism underscores why a multi-stage, contaminant-specific pretreatment strategy is non-negotiable for achieving reliable and cost-effective TFT-LCD wastewater treatment solutions.
| Contaminant | Typical Conc. (mg/L) | Solubility | Biodegradability | Toxicity to Microorganisms | Typical Removal Methods | Removal Efficiency Range |
|---|---|---|---|---|---|---|
| DMSO | 430 | High | Low (BI < 0.3) | Moderate | UV/H₂O₂, Electro-Fenton | 90–99% |
| MEA | 800 | High | Moderate | Moderate | pH Neutralization, Biological | 90–98% |
| TMAH | 190 | High | Very Low | High | Chemical Precipitation (Na₂S), Electrocoagulation | 95–98% |
Step-by-Step ZLD System Design for TFT-LCD Wastewater: Process Flow & Equipment Selection
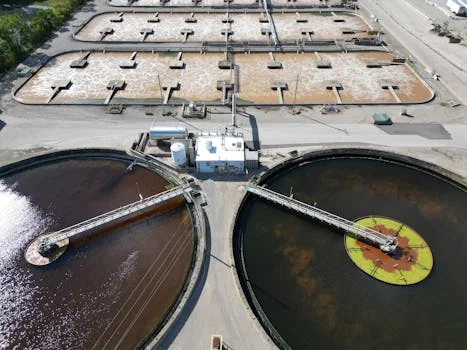
1. Pretreatment Stage: The initial and most critical phase focuses on contaminant-specific removal to protect downstream biological and membrane systems. For DMSO, an advanced oxidation reactor (AOR) utilizing UV/H₂O₂ is employed; dosing guidelines typically recommend 1.2 kg of H₂O₂ per kg of DMSO for achieving 90% removal efficiency. MEA-rich streams require precise pH neutralization tanks, where sulfuric acid (H₂SO₄) is dosed to maintain pH 7–8, optimizing conditions for subsequent biological treatment. For TMAH, a dedicated chemical precipitation tank using sodium sulfide (Na₂S) is vital, ensuring 95%+ removal. These modules are often managed by a PLC-controlled chemical dosing system for optimal reaction kinetics and chemical usage efficiency.
2. Biological Stage: Following intensive pretreatment, the wastewater enters a biological treatment stage designed to reduce residual organic load (COD) and convert biodegradable components. A hybrid Anaerobic/Anoxic/Oxic (A/O) Sequencing Batch Reactor (SBR) combined with hydrolysis acidification is highly effective for TFT-LCD effluent. This configuration typically reduces COD from 600–1,000 mg/L down to 50–100 mg/L. Optimal operating parameters include a Hydraulic Retention Time (HRT) of 12–24 hours and a Mixed Liquor Suspended Solids (MLSS) concentration of 3,000–5,000 mg/L (per Top 5 paper research). This stage often integrates with an MBR system for TFT-LCD wastewater with 0.1 μm filtration, providing superior effluent quality for membrane processes.
3. Membrane Stage: This is the core of the ZLD system, achieving high water recovery and separating dissolved solids. A multi-stage membrane configuration, such as MBR-RO-EDR, is proven effective (Taiwan case study). The MBR provides robust physical separation, ensuring low TSS (<5 mg/L) and SDI (<3) suitable for RO feed. Reverse Osmosis (RO) membranes, like LG BW 400 R G2, are selected for their high rejection rates, achieving 75–78% recovery per pass at 7–9 bar feed pressure. The concentrate from the RO stage is then typically fed into an Electrodialysis Reversal (EDR) system, which further concentrates salts and allows for additional water recovery, pushing overall system recovery to over 90%. Proper RO membrane selection for TFT-LCD water reuse is critical for system longevity and efficiency.
4. Polishing Stage: The permeate from the membrane stage, while high quality, may still contain trace organics or specific ions requiring removal to meet stringent reuse standards. Ion exchange (IX) resins are employed for final removal of specific dissolved ions, while activated carbon filters are used for adsorption of any residual trace organics. For compliance with WHO Guidelines for Drinking-water Quality for reuse applications, ClO₂ generator for TFT-LCD water reuse disinfection is implemented to ensure complete disinfection before the treated water is recycled back into the manufacturing process or discharged.
Process Flow Diagram (Conceptual Description):
- Influent Wastewater: Raw TFT-LCD effluent (High COD, TSS, DMSO, MEA, TMAH, variable pH).
- Pretreatment Modules:
- DMSO Oxidation Reactor (UV/H₂O₂): Reduces DMSO. Effluent: Lower DMSO.
- pH Neutralization Tank (H₂SO₄): Adjusts pH for biological stage. Effluent: pH 7-8.
- TMAH Precipitation Tank (Na₂S): Removes TMAH. Effluent: Lower TMAH.
- Coagulation/Flocculation + DAF: Removes suspended solids and some organics. Effluent: Low TSS, reduced COD.
- Biological Treatment (Hybrid A/O SBR): Reduces biodegradable COD, TN. Effluent: COD 50-100 mg/L, low BOD.
- Membrane Bioreactor (MBR): Ultrafiltration for suspended solids, bacteria, and some macromolecules. Effluent: TSS <5 mg/L, SDI <3.
- Reverse Osmosis (RO): Removes dissolved salts and remaining organics. Effluent: High-purity permeate, concentrated brine.
- Electrodialysis Reversal (EDR): Further treats RO brine for additional water recovery and salt concentration. Effluent: High-purity permeate, highly concentrated brine.
- Polishing (Ion Exchange/Activated Carbon): Removes trace ions and organics. Effluent: Ultra-pure water.
- Disinfection (ClO₂): Ensures microbial safety for reuse. Effluent: Disinfected, reusable water.
- Evaporator/Crystallizer (for ZLD): Treats final concentrated brine to recover remaining water and produce solid waste. Effluent: Solid waste, condensate (reused).
Sizing each module is critical for performance. For example, MBR membrane area can be estimated based on flow rate, typically requiring 0.8 m² of membrane area per m³/day of treated water, assuming standard flux rates and proper pretreatment.
Hybrid System Comparison: Electro-Fenton vs. A/O SBR + DAF vs. MBR-RO-EDR
Selecting the optimal TFT-LCD wastewater treatment system hinges on a careful evaluation of influent characteristics, target recovery rates, and budget constraints, as no single technology fits all scenarios. Hybrid systems combine the strengths of different processes to achieve superior results.| System Type | CAPEX ($/ton) | OPEX ($/ton) | COD Removal (%) | TSS Removal (%) | TDS Removal (%) | Footprint (m²/100 m³/h) | Scalability |
|---|---|---|---|---|---|---|---|
| Electro-Fenton | $250–$400 | $256–$350 | 99%+ | N/A (Pretreatment needed) | N/A | 20–30 | Small to Medium |
| A/O SBR + DAF | $350–$500 | $100–$200 | 85–95% | 90–98% | N/A | 60–100 | Medium to Large |
| MBR-RO-EDR (ZLD) | $600–$900 | $250–$450 | 98%+ | 99%+ | 98%+ | 80–120 | Medium to Large |
Electro-Fenton: This advanced oxidation process is highly effective for high-COD streams, achieving 99% COD removal (per ASCE 2023 benchmarks) by generating powerful hydroxyl radicals. Its primary advantages lie in its ability to treat non-biodegradable organics and its relatively compact footprint. However, it incurs high energy costs, typically around 1.2 kWh/kg COD removed, making it best suited as a robust pretreatment for highly concentrated streams before further biological or membrane treatment. It does not remove TSS or TDS directly.
A/O SBR + DAF: A combination of biological treatment (Anaerobic/Anoxic/Oxic Sequencing Batch Reactor) and physical separation (DAF system for TSS and FOG removal in TFT-LCD pretreatment) offers a cost-effective solution for significant COD and TSS reduction. This hybrid typically boasts 30% lower CAPEX for flows exceeding 100 m³/h compared to full ZLD systems. While it achieves high COD (85-95%) and TSS (90-98%) removal, its water recovery is generally limited to around 85%, making it unsuitable for full ZLD mandates without additional membrane stages.
MBR-RO-EDR: This comprehensive membrane-based system is designed for high water recovery, achieving up to 91% water recovery (Taiwan case study) and near-complete removal of COD, TSS, and TDS, making it ideal for ZLD applications. The MBR acts as a superior clarifier, providing high-quality feed for the RO, which removes dissolved salts. EDR further concentrates the RO brine, maximizing water extraction. While highly effective, this system has the highest CAPEX and OPEX, primarily due to membrane replacement costs ($0.15/m³ treated for RO membranes) and energy consumption for pressure-driven processes.
Decision Framework for System Selection:
- If influent COD > 1,000 mg/L and ZLD is required: Consider Electro-Fenton as a primary pretreatment followed by an MBR-RO-EDR system.
- If influent COD < 1,000 mg/L, high TSS, and 85% water recovery is sufficient: An A/O SBR + DAF system offers a cost-effective solution.
- If ZLD is mandated with high water reuse targets (70-85%) and stringent effluent quality: An MBR-RO-EDR system is the most appropriate choice, with potential for further concentration via evaporators/crystallizers for true ZLD.
- For budget-constrained projects with moderate COD and TSS: A phased approach starting with A/O SBR + DAF, with future integration of RO/EDR, can be considered.
TFT-LCD Wastewater Treatment Cost Breakdown: CAPEX, OPEX & ROI Calculator
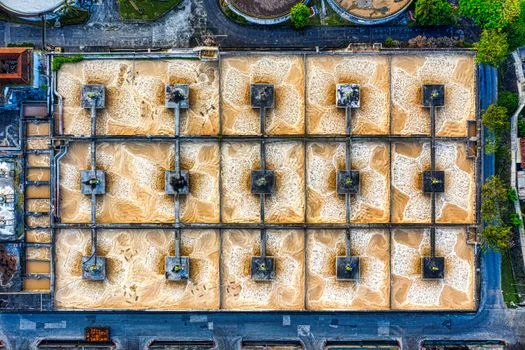
CAPEX Breakdown (per ton of treated wastewater):
- Pretreatment (e.g., AOPs, chemical precipitation, DAF): $50–$150/ton. This includes reactors, dosing pumps, tanks, and PLC-controlled chemical dosing systems.
- Biological Treatment (e.g., A/O SBR, MBR): $100–$300/ton. Costs cover biological reactors, aeration systems, blowers, and MBR modules.
- Membrane Treatment (e.g., RO, EDR): $200–$500/ton. This includes RO/EDR units, high-pressure pumps, membrane vessels, and associated piping.
- Polishing & ZLD Components (e.g., Ion Exchange, Evaporator/Crystallizer): $50–$100/ton. This covers polishing filters, ion exchange columns, and potentially thermal evaporators.
Total CAPEX for a comprehensive ZLD system typically ranges from $400–$1050/ton, depending on the specific technologies deployed and the scale of the plant.
OPEX Breakdown (per m³ of treated wastewater):
- Energy Consumption: $0.05–$0.20/m³. This is a significant component, driven by pumps (especially RO), blowers (biological), and advanced oxidation processes (e.g., Electro-Fenton, UV).
- Chemical Costs: $0.10–$0.30/m³. Includes coagulants, flocculants, pH adjusters (H₂SO₄, NaOH), oxidants (H₂O₂), and anti-scalants for membranes.
- Membrane Replacement: $0.10–$0.25/m³. RO membranes typically have a lifespan of 3-5 years, MBR membranes 5-10 years. This cost is highly dependent on influent quality and effective pretreatment.
- Labor & Maintenance: $0.05–$0.15/m³. Covers operational staff, routine maintenance, and spare parts. Automation can significantly reduce labor costs.
- Sludge Disposal: $0.02–$0.08/m³. Cost for dewatering and disposing of biological sludge and chemical precipitates.
Total OPEX for a ZLD system generally falls between $0.32–$0.98/m³.
ROI Calculator Framework:
To assess the return on investment for a TFT-LCD ZLD system, consider the following:
- Inputs:
- Flow rate (m³/h or CMD)
- Influent COD (mg/L)
- Target water recovery rate (%)
- Cost of fresh water ($/m³)
- Cost of wastewater discharge ($/m³)
- Projected CAPEX and annual OPEX
- Outputs:
- Annual savings from reduced fresh water consumption
- Annual savings from reduced wastewater discharge fees
- Total annual operational savings
- Payback period (Years = Total CAPEX / Annual Operational Savings)
Example: A 100 m³/h TFT-LCD plant implementing a ZLD system with 90% water recovery can save approximately $1.2M/year in water costs alone (Taiwan case study), leading to a typical payback period of 2–4 years for plants of this scale. For additional context on semiconductor wastewater treatment costs, refer to cost benchmarks for semiconductor wastewater treatment.
| Parameter Change | Impact on OPEX | Notes |
|---|---|---|
| +10% Influent COD | +8% OPEX | Increases chemical dosing, energy for AOPs/biological. |
| +10% Water Recovery Target | +12% OPEX | Requires more advanced membrane/thermal stages, higher energy. |
| +10% Energy Cost | +5% OPEX | Direct impact, especially for RO and AOP-heavy systems. |
| -20% Membrane Lifespan | +4% OPEX | Premature replacement due to fouling/damage. |
To reduce costs, strategies include implementing energy recovery systems in RO, optimizing chemical dosing through advanced automation, and extending membrane lifespan through stringent pretreatment and cleaning protocols.
Compliance Checklist: Meeting China GB 3544-2024 and Taiwan Reuse Mandates
Achieving and maintaining regulatory compliance is paramount for TFT-LCD manufacturing plants, particularly with evolving and increasingly stringent discharge and reuse standards. Non-compliance can result in substantial fines, operational shutdowns, and reputational damage.China's GB 3544-2024 standard for industrial wastewater discharge sets strict limits for key parameters in the electronics manufacturing sector. For example, compliance requires effluent COD to be less than 50 mg/L, BOD less than 10 mg/L, TSS less than 10 mg/L, and critically, TMAH less than 0.5 mg/L (per China GB 3544-2024 full table). These limits necessitate advanced treatment beyond conventional biological processes.
In Taiwan, water reuse mandates are increasingly enforced, requiring 70–85% water recovery for water-intensive industrial users (Taiwan EPA 2025). Permeate for reuse must meet specific quality criteria, including TDS below 50 mg/L and an SDI (Silt Density Index) below 3 to prevent fouling of plant equipment. Adherence to these mandates not only ensures regulatory compliance but also offers significant operational savings through reduced reliance on fresh water sources.
10-Step Compliance Checklist:
- Conduct Regular Influent Characterization: Periodically analyze raw wastewater for key contaminants (COD, BOD, TSS, DMSO, MEA, TMAH, heavy metals) to adjust treatment parameters.
- Implement Contaminant-Specific Pretreatment: Ensure dedicated modules for DMSO oxidation, TMAH precipitation, and pH neutralization are operational and optimized.
- Optimize Biological Treatment Parameters: Maintain optimal HRT, MLSS, and DO levels in biological reactors for maximum organic removal.
- Install and Calibrate Online Monitors: Deploy continuous online COD, TSS, pH, and flow rate monitors with alarm systems for real-time compliance tracking.
- Conduct Quarterly TMAH Testing: Due to its toxicity and specific limits, monitor TMAH concentrations in both influent and effluent quarterly, or more frequently if required.
- Regular Membrane Integrity Testing: Perform routine tests (e.g., bubble point, pressure decay) on MBR and RO membranes to prevent permeate quality excursions.
- Implement Robust Disinfection: Utilize a ClO₂ generator for TFT-LCD water reuse disinfection to meet microbiological reuse standards.
- Maintain Comprehensive Records: Document all operational data, analytical results, maintenance logs, and chemical usage for audit purposes.
- Develop Emergency Response Protocols: Establish procedures for handling system upsets, spills, or non-compliance events.
- Stay Updated on Regulatory Changes: Regularly review local and national environmental regulations (e.g., China GB 3544-2024, Taiwan EPA mandates) to ensure proactive adaptation.
Common compliance failures include membrane fouling causing TSS and COD spikes in permeate, inadequate pretreatment leading to biological system inhibition (especially from TMAH), and insufficient disinfection for reuse applications. Addressing these requires a holistic approach, from robust system design to vigilant operational management.
Frequently Asked Questions
What is the most cost-effective TFT-LCD wastewater treatment system for a 50 m³/h plant?
For a 50 m³/h plant targeting up to 85% water recovery, an A/O SBR + DAF system is generally the most cost-effective, with a CAPEX of approximately $350/ton. If Zero Liquid Discharge (ZLD) is required, adding a Reverse Osmosis (RO) system to the A/O SBR + DAF would increase total CAPEX to around $500/ton, balancing cost with higher recovery.
How do you remove TMAH from TFT-LCD wastewater?
TMAH (Tetramethylammonium Hydroxide) is effectively removed from TFT-LCD wastewater primarily through chemical precipitation with Na₂S, achieving up to 95% removal. Alternatively, electrocoagulation can achieve higher removal rates, typically around 98%. In both methods, precise pH adjustment to 8–9 is critical for optimal reaction efficiency and precipitate formation.
What is the payback period for a TFT-LCD ZLD system?
The payback period for a comprehensive TFT-LCD ZLD system typically ranges from 2–4 years, especially for larger plants exceeding 100 m³/h. This rapid return on investment is driven by significant annual savings from water reuse and reduced wastewater discharge fees. For instance, a Taiwan case study demonstrated annual savings of $1.2M from water reuse for a plant of this scale.
Can MBR membranes handle DMSO?
While MBR membranes can physically separate suspended solids and some macromolecules, they are not designed to remove dissolved organic compounds like DMSO (Dimethyl Sulfoxide). Therefore, effective pretreatment, such as UV/H₂O₂ advanced oxidation, is required to reduce DMSO concentrations to below 50 mg/L before the MBR stage to prevent organic fouling and ensure the MBR provides a high-quality feed for subsequent RO membranes (per LG membrane specs).
What are the energy costs for electro-Fenton in TFT-LCD treatment?
The energy costs for the electro-Fenton process in TFT-LCD wastewater treatment are approximately 1.2 kWh per kg of COD removed. At an average electricity cost of $0.12/kWh, this translates to an energy cost of roughly $0.15 per m³ of treated wastewater, making it an energy-intensive but highly effective option for high-COD streams (per ASCE 2023 benchmarks).