How an MBR system for sewage works
An MBR system for sewage couples a high-MLSS bioreactor with microfiltration membranes so solids leave as waste sludge, not as clarifier overflow. Mixed liquor typically runs at 8,000–12,000 mg/L, net flux at 15–30 LMH, and HRT at 4–8 hours. Effluent TSS stays below 1 mg/L and BOD5 below 5 mg/L under stable operation, without a secondary clarifier.
MBR plants drop secondary clarifiers and cut footprint by 50–70% versus conventional activated sludge (CAS). Space often limits capacity expansion at industrial and municipal sites. A 500 m³/day municipal plant in Shenzhen cut footprint by about 60% and met China GB 18918-2002 Class 1A after retrofitting CAS tanks with integrated membrane bioreactors (HydropureWater field data, 2025), doubling capacity without new land.
Earlier marketing copy sometimes tied EPA’s 2024 ELG updates and EU Directive 91/271/EEC to municipal benchmarks of less than 10 mg/L TSS and less than 5 mg/L BOD. The 2024 EPA steam-electric ELG instead targets power-plant wastestreams such as FGD wastewater and bottom-ash transport water, not municipal sewage limits (US EPA, 2024). The revised EU Urban Wastewater Treatment Directive (2024/3019), in force from 1 January 2025, tightens nutrient and micropollutant duties and pushes energy-neutral plants by 2045 (European Commission). Local discharge and reuse permits still commonly demand BOD near 5 mg/L and very low TSS—levels a membrane barrier holds more steadily than gravity settling when sludge bulks or flow spikes.
Reuse pressure keeps rising. MBR permeate is routinely used for irrigation, cooling-tower make-up, and landscaping after a final disinfection step. That single-barrier effluent often replaces a long tertiary filter train on compact sites and inside package plants such as an Underground Package Sewage Treatment Plant (WSZ Series).
What Does an MBR Process Flow Look Like?
An MBR process flow moves sewage through fine screening, biological reaction, membrane filtration, then permeate disinfection and sludge handling. The reactor holds Mixed Liquor Suspended Solids (MLSS) at 8,000–12,000 mg/L so organic load is treated in a smaller tank volume than CAS at 2,000–4,000 mg/L.
Stage 1: Pre-treatment. Raw influent—typically TSS 200–500 mg/L and COD 300–800 mg/L—passes fine screens (1–3 mm) to strip hair, rags, and fibers. Missed debris causes ragging on membrane fibers and irreversible damage.
Stage 2: Biological reactor. Flow enters anoxic and aerobic zones for COD and nutrient removal. Short HRT of 4–8 hours pairs with long Sludge Retention Time (SRT) of 15–30 days, which supports nitrification and lowers sludge yield versus short-SRT CAS.
Stage 3: Membrane filtration. Permeate is drawn through PVDF flat-sheet membrane modules for MBR applications by a suction pump. PVDF pores of 0.1–0.4 μm retain bacteria and suspended solids. Coarse-bubble scour air at the module base limits cake build-up on the membrane surface.
Stage 4: Permeate disinfection and sludge handling. MBR effluent already delivers 99%+ pathogen removal in many municipal trains, yet UV or chlorination is still added for reuse health codes. Waste sludge is thicker than CAS sludge, typically 1–2% solids, which helps a plate and frame filter press reach higher cake dryness with less water to haul.
| Process Stage | Key Parameter | Engineering Value |
|---|---|---|
| Pre-treatment | Screening Mesh Size | 1.0 – 3.0 mm |
| Bioreactor | MLSS Concentration | 8,000 – 12,000 mg/L |
| Bioreactor | Sludge Retention Time (SRT) | 15 – 30 Days |
| Filtration | Design Flux (Net) | 15 – 30 LMH |
| Filtration | Transmembrane Pressure (TMP) | 5 – 30 kPa |
Most plants we size for municipal sewage run net flux toward the lower half of 15–30 LMH when peak-to-average flow is high, trading some membrane area for fewer CIP events.
MBR vs Conventional Activated Sludge: Head-to-Head Comparison
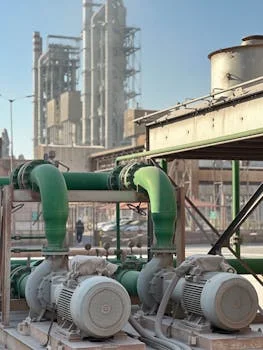
MBR trains produce turbidity below 0.2 NTU and TSS below 1 mg/L, while CAS secondary effluent more often sits at 5–20 mg/L TSS. CAS depends on gravity settling in a clarifier, so temperature swings, filaments, and hydraulic peaks all move effluent quality. MBR separation is a physical barrier that does not need good settleability.
Energy is the trade-off. MBR systems commonly use 0.6–1.2 kWh/m³ of treated water, mainly for membrane air scour. CAS plants more often use 0.3–0.6 kWh/m³. Lifecycle cost narrows when tertiary filters, some phosphorus polishing chemicals, and sludge haul volumes drop out of the MBR bill.
| Feature | MBR System | CAS System |
|---|---|---|
| Effluent TSS | < 1 mg/L | 5 – 20 mg/L |
| Footprint (1,000 m³/d) | ~150 m² | ~400 m² |
| Energy Consumption | 0.6 – 1.2 kWh/m³ | 0.3 – 0.6 kWh/m³ |
| Sludge Yield | Low (Long SRT) | Moderate to High |
| Pathogen Removal | 4–6 Log Reduction | 1–2 Log Reduction |
Key Engineering Parameters for MBR System Design
Sustainable net flux of 15–30 LMH is the design target that balances throughput and membrane life. Sizing on peak flux alone is a frequent error and drives early fouling. Food-to-Microorganism (F/M) ratios are kept low at 0.05–0.15 kg BOD/kg MLSS/day to limit sludge production and stabilize biology.
Aeration splits into two duties: process oxygen at about 0.2–0.5 m³ air/m³ wastewater, and membrane scour at 0.3–0.6 m³ air/m² of membrane area. Scour air also feeds some of the oxygen demand, but its job is shear that strips cake from the membrane face. Influent must pass a rotary mechanical bar screen so debris larger than about 2 mm never reaches the membrane tank.
| Parameter Group | Engineering Metric | Design Range |
|---|---|---|
| Membrane Specs | Pore Size (PVDF) | 0.1 – 0.4 μm |
| Bioreactor | HRT (Hydraulic Retention) | 4 – 8 Hours |
| Aeration | SADm (Specific Aeration Demand) | 0.3 – 0.6 m³/m²·h |
| Maintenance | CIP Frequency | Every 3 – 6 Months |
| Pretreatment | Fine Screen Aperture | < 2.0 mm |
Real-World Efficiency Data: What MBR Systems Actually Achieve
Standard configurations of an MBR system for sewage achieve 92–97% COD removal and 99%+ pathogen reduction without tertiary filtration when pretreat and scour stay in range.
Industrial textile and food plants with influent COD above 1,000 mg/L still hold effluent COD below 50 mg/L in many operating logs. That margin matters for facilities chasing Zero Liquid Discharge (ZLD) feed quality or tight local permits.
Internal recycle from the aerobic membrane zone to an upstream anoxic zone supports Total Nitrogen (TN) removal of 60–80%. Total Phosphorus (TP) removal of 70–90% is reachable when metal salts are dosed into the bioreactor, because the membrane captures precipitated solids in the sludge.
| Contaminant | Typical Influent (mg/L) | MBR Effluent (mg/L) | Removal Efficiency |
|---|---|---|---|
| COD | 300 – 800 | < 30 | 92 – 97% |
| BOD₅ | 200 – 500 | < 5 | 95 – 99% |
| TSS | 200 – 500 | < 1 | 99%+ |
| NH₃-N | 25 – 50 | < 1 | 98%+ |
Operational Challenges: Membrane Fouling, Energy Use, and Maintenance
Membrane fouling shows up as Transmembrane Pressure (TMP) climbing above 30 kPa and remains the main operating constraint. Plants need automated scour control and chemical cleaning before fouling turns irreversible. Fouling splits into biofouling, organic fouling, and inorganic scaling; TMP trend rate is the practical trigger for Clean-In-Place (CIP).
Variable-speed blowers and dissolved-oxygen control cut wasted air. Dropping scour air in low-flow hours can save up to 20% of total plant energy. PVDF membranes typically last 5–10 years when CIP chemistry and recovery cleans follow the supplier schedule. Concentrated MBR sludge needs accurate polymer make-up through an automatic chemical dosing system before dewatering.
How Do MBR and Conventional Treatment Costs Compare?
Capital cost for an MBR system for sewage often starts near $1,500 per m³/d of design capacity and rises with membrane area, covered tanks, and fine-screen depth; the upper bound depends on civil scope rather than a single catalog price. CAS civil works look cheaper per cubic meter of tankage, yet add clarifiers, tertiary filters, and more land when reuse-grade TSS is required.
OPEX drivers for MBR are scour energy at 0.6–1.2 kWh/m³, periodic CIP chemicals every 3–6 months, and membrane replacement on a 5–10 year cycle. CAS OPEX sits lower on power at 0.3–0.6 kWh/m³ but higher on sludge haul when SRT is short and on polishing filters when permits demand TSS near 1 mg/L. Selection checklist most buyers run:
- Permit or reuse limit for TSS, BOD5, TN, and TP
- Available footprint at peak-day flow (m³/d)
- Power price and blower redundancy
- Screening aperture and ragging risk
- Sludge disposal route and cake target
- Membrane replacement budget over 5–10 years
- Staff skill for TMP trending and CIP
Compact sites that need reuse-ready permeate usually favor MBR. Sites with cheap land, loose TSS limits, and very low power tariffs may keep CAS plus tertiary filters.
Who This Is For / Next Step
This process fits municipal expansions on constrained plots, food and textile plants feeding reuse or ZLD, and owners specifying package MBR trains such as the Underground Package Sewage Treatment Plant (WSZ Series). Look elsewhere if your permit allows 15–20 mg/L TSS, land is plentiful, and energy cost dominates over effluent risk. For a duty-sized flux and blower estimate on your influent COD and peak-day flow, send the load sheet through our request a project quote form.
Frequently Asked Questions
How does an MBR system treat sewage step by step?
Sewage is fine-screened at 1–3 mm, degraded in a high-MLSS bioreactor at 8,000–12,000 mg/L, then filtered through 0.1–0.4 μm PVDF membranes at 15–30 LMH net flux. Permeate is disinfected for reuse codes, and waste sludge leaves at about 1–2% solids. The membrane replaces the secondary clarifier, so effluent TSS stays below 1 mg/L when TMP and scour stay in control.
What COD and TSS removal can MBR deliver on municipal sewage?
Municipal MBR trains typically remove 92–97% COD and hold effluent TSS below 1 mg/L and BOD5 below 5 mg/L at design MLSS and flux. Pathogen reduction often exceeds 99% before final disinfection. High-strength industrial feeds with COD above 1,000 mg/L still commonly discharge below 50 mg/L COD when pretreatment and nutrient zones are sized correctly.
Why does MBR use more energy than conventional activated sludge?
MBR energy is higher because coarse-bubble air scour protects the membrane surface, pushing total use to about 0.6–1.2 kWh/m³ versus 0.3–0.6 kWh/m³ for many CAS plants. Variable-speed blowers and reduced scour at night can cut roughly 20% of that load. Lifecycle cost still closes when land, tertiary filters, and sludge haul shrink.
How often do MBR membranes need chemical cleaning?
Most municipal designs schedule Clean-In-Place every 3–6 months, with recovery cleans when TMP rises above about 30 kPa faster than the baseline trend. Skipping recovery cleans shortens the usual 5–10 year PVDF life. Daily TMP logs matter more than a fixed calendar alone.
When should a plant choose MBR over CAS plus filters?
Choose MBR when footprint must fall by roughly half, reuse needs turbidity below 0.2 NTU, or clarifier settleability is unreliable. Keep CAS when land is cheap, TSS limits stay near 15–20 mg/L, and power cost outweighs land and polishing savings. Hybrid upgrades that drop membranes into existing aeration tanks are common on constrained municipal sites.