How Much Does Etching Wastewater Treatment Cost in 2026?
Etching wastewater treatment CAPEX spans $50,000 for small chemical precipitation trains to $5M+ for ZLD plants with copper recovery. OPEX typically runs $0.15–$2.50/m³ at stated pH, metal, and energy conditions. Closed-loop recovery can cut acid and reagent spend by up to 90% (per emew 2024 benchmarks). PCB etching cost payback often lands at 12–24 months when metal revenue offsets disposal.
Budget reviews for 2026 start with three inputs: daily flow (m³/day), copper concentration (mg/L), and the binding local copper limit. Those values decide whether precipitation alone is enough, or whether DAF, MBR, copper recovery, or ZLD delivers the lower lifetime cost. Generic industrial wastewater at the same flow almost always understates reagent use and sludge class on etch lines.
Why Etching Cost Runs Higher Than Generic Industrial Wastewater
Etching wastewater carries far higher metal loads and more extreme pH than typical industrial or municipal wastewater, which is why treatment budgets inflate quickly. PCB, semiconductor, and metal-finishing etch lines commonly discharge 500–5,000 mg/L copper, versus less than 50 mg/L in municipal wastewater, so specialized pretreatment is required (per EPA 40 CFR Part 469). Those copper levels also push sludge into hazardous classifications and raise both disposal fees and enforcement exposure.
Acid etching lines often leave the tool at pH 1–3, while alkaline etching can reach pH 10–12. Neutralizing those swings with H₂SO₄ or NaOH typically raises chemical neutralization costs by 30–50% compared with near-neutral industrial wastewater. Complexing agents, residual organics, and suspended solids then demand extra clarification or flotation before metals can be precipitated or recovered at stable efficiency.
Regulatory copper limits define the last unit process you must buy. China's GB 21900-2008 sets copper below 0.5 mg/L. US EPA electroplating categorical practice often sits near 1.3 mg/L. EU Industrial Emissions Directive projects frequently target below 0.2 mg/L. Non-compliance fines summarized in 2024 World Bank material average $25,000–$100,000 per year for industrial facilities. Flow compounds the problem: a typical PCB plant generates 100–500 m³/day, while a large semiconductor fab can exceed 1,000 m³/day, each with different copper, nickel, and free-acid profiles that change tank sizing and sludge mass.
Most plants we size for etch/rinse segregation keep concentrated bath dumps on a separate high-copper path. Rinse water then sees a lighter solids and metal load. That split cuts neutralization chemical use and keeps recovery cells fed with a more stable copper titer instead of a diluted combined sewer. Mixing bath dumps into the rinse sump is the single fastest way to destroy recovery economics and inflate sludge tickets.
What Drives a Water Treatment Plant Cost Breakdown?
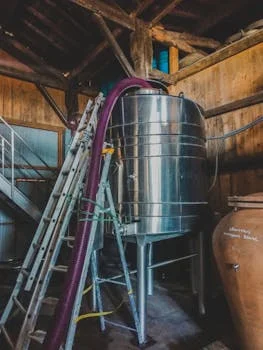
A usable water treatment plant cost breakdown for etching lines separates CAPEX by technology train, capacity band (m³/day), and the effluent quality target. Chemical precipitation remains the lowest CAPEX path at $50,000–$300,000 for 10–100 m³/day. It relies on pH adjustment and flocculation to drop metals, meets many basic permits, and still incurs high sludge disposal often quoted at $0.50–$1.50/m³. That sludge line is why low CAPEX packages lose on 10-year total cost when copper stays high.
Dissolved air flotation fills the mid-CAPEX band. DAF systems usually cost $200,000–$1M for 50–300 m³/day and suit TSS-heavy rinse waters. DAF systems for high-efficiency TSS and copper removal can reach 90–95% TSS removal as pretreatment or as a standalone train when discharge limits are moderate. On many PCB rinse skids we commission, DAF lands toward the lower end of that CAPEX range when a recovery cell follows and civil work is limited to a compact equipment pad.
Membrane bioreactor packages cost more and aim at reuse-grade water. MBR CAPEX typically runs $500,000–$2M for 100–500 m³/day. Integrated MBR systems for near-reuse-quality effluent provide <1 μm filtration, while membrane replacement adds about $0.20–$0.40/m³ to OPEX. Copper must be reduced first. Untreated etching streams foul membranes and suppress biology long before the permeate meter looks attractive on paper.
ZLD sits at the top of the CAPEX ladder at $1M–$5M+ for 100–1,000 m³/day. Water recovery approaches 99%, but evaporation and crystallization push energy to $0.80–$2.50/m³. Copper recovery units, standalone or bolted onto DAF or MBR, add $300,000–$1.5M of CAPEX yet can reach 99.9% recovery efficiency (per emew 2024 data). Payback is often quoted at 12–24 months when copper revenue and avoided hazardous disposal stack in the same cash-flow model.
Reagent control protects every train above precipitation. PLC-controlled chemical dosing for precise pH adjustment and coagulation holds neutralization inside a narrow band when tools swing between acid and alkaline etchants. Overshooting pH wastes caustic or acid and can resolubilize freshly formed metal hydroxides, which shows up later as permit excursions rather than as an obvious dosing fault.
Civil works, power feeders, and acid-compatible tank linings often add 15–30% on top of equipment list prices when etch chemistry is aggressive. Bids that quote only skid CAPEX without those site factors understate the check the owner actually writes. Installation labor, interconnect piping in PVDF or lined steel, and hazardous-area classification for chemical rooms belong in the same breakdown sheet as the DAF or MBR box.
| System Type | CAPEX Range (USD) | Capacity (m³/day) | Key Performance | Primary Cost Driver |
|---|---|---|---|---|
| Chemical Precipitation | $50,000 – $300,000 | 10 – 100 | 70-90% metal removal, high sludge | Equipment, installation |
| Dissolved Air Flotation (DAF) | $200,000 – $1,000,000 | 50 – 300 | 90-95% TSS removal, ~30% metal recovery | DAF unit, pumps, civil works |
| Membrane Bioreactor (MBR) | $500,000 – $2,000,000 | 100 – 500 | Near-reuse quality effluent (<1 μm) | Membranes, aeration, controls |
| Zero Liquid Discharge (ZLD) | $1,000,000 – $5,000,000+ | 100 – 1,000 | 99% water recovery, minimal discharge | Evaporators, crystallizers, RO |
| Copper Recovery System | $300,000 – $1,500,000 | 10 – 1,000 | 99.9% copper recovery | Electrowinning cells, power supply |
OPEX Deep Dive: Chemicals, Energy, Labor, and Sludge
Operational expenditure for etching wastewater often exceeds initial CAPEX over a 10–15 year life, so OPEX belongs in the first design review—not in a post-commissioning surprise. Neutralization with NaOH and H₂SO₄ commonly costs $0.10–$0.50/m³ when pH swings are wide. Coagulants and flocculants such as PAC and PAM add $0.20–$0.80/m³ when TSS and metal hydroxides must settle or float at a stable rate across shift changes.
Energy intensity tracks the unit process, not the building. DAF aeration and pumping usually cost $0.05–$0.15/m³. MBR aeration plus membrane filtration runs $0.20–$0.50/m³. ZLD evaporation, crystallization, and RO push energy to $0.80–$2.50/m³. That spread is why ZLD only closes when water is scarce, discharge is banned, or reuse credits are unusually high.
Labor scales with automation and fault modes. Basic chemical precipitation typically needs 0.5–1 FTE for monitoring, chemical handling, and sludge work. Automated DAF and MBR trains often run at 0.2–0.5 FTE once controls are stable. Complex ZLD plants commonly need 1–2 FTEs for specialized operation and maintenance (per 2024 Bureau of Labor Statistics data used as a labor-cost reference frame). Night-shift coverage on ZLD crystallizers is the item most bids understate.
Sludge disposal remains the quiet budget killer on etch lines. Sludge with copper above 2,500 mg/kg is typically hazardous at $0.10–$0.30/kg. Non-hazardous cake drops to $0.02–$0.10/kg (per EPA 2024 guidelines). High-efficiency sludge dewatering for reduced disposal costs cuts haulage mass before the hazardous-classification debate starts. Plants that skip dewatering pay for water weight on every truck ticket.
Maintenance is smaller than chemicals or sludge but still recurring. MBR membrane replacement contributes $0.20–$0.40/m³. DAF diffuser wear parts sit near $0.05–$0.10/m³. Chemical dosing pumps and other rotating equipment usually add $0.01–$0.05/m³ when spares are stocked and seals are changed on schedule rather than after a spill. Acid-compatible elastomers and double-containment for day tanks belong on the same maintenance budget line as membrane modules.
When owners compare quotes, ask each bidder to express OPEX in USD/m³ at your measured copper and pH—not at a sanitized demo water. A package that looks cheap on deionized water can double chemical use the week etch chemistry swings. That single modeling habit prevents most OPEX disputes after handover.
| OPEX Category | Cost Range (USD/m³) | System Impact | Notes |
|---|---|---|---|
| Chemicals (Neutralization) | $0.10 – $0.50 | All systems | NaOH, H₂SO₄ for pH adjustment |
| Chemicals (Coagulants/Flocculants) | $0.20 – $0.80 | Chemical, DAF, MBR (pretreatment) | PAC, PAM for solids/metal removal |
| Energy (DAF) | $0.05 – $0.15 | DAF | Aeration, pumps |
| Energy (MBR) | $0.20 – $0.50 | MBR | Aeration, membrane filtration |
| Energy (ZLD) | $0.80 – $2.50 | ZLD | Evaporation, crystallization, RO |
| Labor (per FTE/year) | $0.05 – $0.50 (varies by region/automation) | All systems | 0.2-2 FTEs depending on system complexity |
| Sludge Disposal (Hazardous) | $0.10 – $0.30/kg | Chemical, DAF, MBR | Cu >2,500 mg/kg, high volume for chemical |
| Sludge Disposal (Non-Hazardous) | $0.02 – $0.10/kg | Chemical, DAF, MBR | Lower volume or metal content |
| Maintenance (MBR Membranes) | $0.20 – $0.40 | MBR | Periodic replacement |
| Maintenance (DAF Diffusers) | $0.05 – $0.10 | DAF | Wear parts |
Tech Comparison: DAF vs MBR vs Chemical Precipitation vs ZLD
Technology selection for etching wastewater balances effluent quality, flow, copper concentration, and budget—there is no single best unit for every fab. DAF fits feeds with TSS of 500–5,000 mg/L and offers relatively low CAPEX with robust solids capture. Metal recovery across DAF alone usually stays below 30%, so copper-rich etching baths still need a dedicated recovery or precipitation stage after flotation. Chemical precipitation remains the lowest-CAPEX option at roughly $50,000–$300,000 for systems handling 10 m³/day to 100 m³/day, though sludge disposal keeps its OPEX high. At the other end, hybrid ZLD designs for PCB plants have reported 99.8% copper recovery.
MBR trains produce reuse-quality water, with TSS below 1 mg/L and COD below 30 mg/L under stable operation. They suit plants targeting recycle loops or sensitive receiving waters. Fouling risk rises when copper remains high; pretreatment to below about 50 mg/L Cu is the common design rule before the membrane tank. Skipping that step is the fastest way to burn a membrane warranty on an etch line.
Chemical precipitation keeps first-cost lowest and removes 70–90% of metals when pH and flocculation are controlled. Removal can be inconsistent on complexed copper, and hazardous sludge volume drives OPEX. ZLD recovers about 99% of water and eliminates liquid discharge, but energy demand and operator skill put it at the top of both CAPEX and OPEX. Hybrid PCB designs that pair recovery with ZLD polishing have reported copper recovery near 99.8% on concentrated etch streams when bath dumps are segregated.
Copper recovery modules—standalone or added to DAF or MBR—reach 99.9% copper recovery (per emew 2024 data). They cut hazardous disposal mass by 80–90% on high-copper streams and create a metal credit that changes ROI math more than any polishing filter. Teams comparing regional capex and opex patterns for general plants still need etching-specific metal and sludge lines; generic municipal ratios understate etching OPEX by a wide margin.
Decision rule used in many bid reviews: choose precipitation-only below roughly 50 m³/day when copper is moderate and sludge tickets are cheap. Choose DAF plus recovery when TSS is high and copper exceeds several hundred mg/L. Choose MBR only after metals are controlled and reuse is required. Choose ZLD when liquid discharge is banned or water purchase cost exceeds thermal energy. That etching cost decision tree keeps CAPEX aligned with the binding permit, not with brochure capacity charts.
| Technology | Best Use Case | CAPEX (Relative) | OPEX (Relative) | Effluent Quality | Key Advantages | Key Disadvantages |
|---|---|---|---|---|---|---|
| Chemical Precipitation | Basic metal removal, low budget | Lowest | High | 70-90% metal removal, high TSS | Low initial investment | High sludge volume, inconsistent removal, high disposal costs |
| Dissolved Air Flotation (DAF) | High TSS, oil/grease removal, pretreatment | Low-Medium | Medium | 90-95% TSS removal, <30% metal recovery | Effective for solids, robust operation | Limited metal recovery, requires chemical dosing |
| Membrane Bioreactor (MBR) | Water reuse, strict discharge limits | Medium-High | Medium-High | TSS <1 mg/L, COD <30 mg/L (near-reuse) | High effluent quality, compact footprint | High CAPEX, membrane fouling risk, energy intensive |
| Zero Liquid Discharge (ZLD) | Water scarcity, zero discharge mandate | Highest | Highest | 99% water recovery, no liquid discharge | Maximum water recovery, environmental compliance | Very high CAPEX/OPEX, energy intensive, complex operation |
| Copper Recovery System | High copper concentration streams | Medium (add-on) | Medium | Produces pure copper metal | Revenue generation, reduced disposal costs | Requires specific wastewater characteristics, additional CAPEX |
How Do You Use a Wastewater CAPEX Calculator for Copper Recovery?
A wastewater CAPEX calculator for copper recovery only works when metal revenue, disposal savings, and recovery OPEX share one monthly cash-flow sheet. Dedicated copper recovery CAPEX typically ranges from $300,000–$1.5M for 10–1,000 m³/day throughput. Recovery OPEX usually lands between $0.10–$0.30/m³ for energy, maintenance, and acid regeneration on electrowinning or related cells.
Recovered copper revenue and avoided hazardous disposal are the two payback levers. At 99.9% recovery efficiency (per emew 2024 data), plants sell metal into the market instead of paying to landfill it inside cake. Using 2025 London Metal Exchange (LME) price bands cited in the source model, recovered copper can yield about $2–$10/kg. Pulling copper out of sludge often reclassifies cake as non-hazardous and can cut disposal from roughly $0.50–$2.00/m³ hazardous-equivalent cost toward much lower non-hazardous rates.
Payback Period (months) = (CAPEX) / [((Copper Revenue per month) + (Disposal Savings per month)) – (OPEX per month)]
Worked example for a 100 m³/day plant at 1,000 mg/L Cu (1 kg/m³):
- Monthly volume: 100 m³/day × 30 days = 3,000 m³/month
- Copper mass: 3,000 m³/month × 1 kg/m³ = 3,000 kg/month
- Recovered copper at 99.9% efficiency: ~3,000 kg/month
- Copper revenue at $3.50/kg: 3,000 × $3.50 = $10,500/month
- Disposal savings at $1.00/m³: 3,000 × $1.00 = $3,000/month
- OPEX at $0.20/m³: 3,000 × $0.20 = $600/month
- Net monthly benefit: ($10,500 + $3,000) − $600 = $12,900/month
- At $500,000 CAPEX: payback ≈ $500,000 / $12,900 ≈ 38.8 months
A 12-month payback on the same $500,000 CAPEX would need about $41,667/month net benefit. That only appears when copper concentration, metal price, or avoided disposal sits well above the mid-case numbers above. Most etching lines we evaluate land between roughly 18 and 40 months once real LME prices and sludge tickets are entered without optimism bias.
Sensitivity is straightforward. Doubling copper from 1,000 to 2,000 mg/L roughly doubles metal revenue if recovery efficiency holds. A $1/kg move in LME copper shifts monthly revenue by about $3,000 in this example. Disposal savings matter most when the site currently pays hazardous rates and can document a non-hazardous path after recovery and dewatering. Run the calculator at low, mid, and high LME bands before you freeze CAPEX.
| Parameter | Value Range / Example | Impact on ROI |
|---|---|---|
| Copper Recovery CAPEX | $300,000 – $1,500,000 | Higher CAPEX extends payback |
| Copper Recovery OPEX | $0.10 – $0.30/m³ | Higher OPEX extends payback |
| Copper Market Price | $2 – $10/kg (2025 LME) | Higher prices accelerate payback |
| Copper Concentration | 500 – 5,000 mg/L | Higher concentrations generate more revenue |
| Disposal Cost Savings | $0.50 – $2.00/m³ | Higher savings accelerate payback |
| Recovery Efficiency | 99.9% (emew 2024 data) | Maximizes revenue potential |
Regional Cost Adjustments: China vs US vs EU
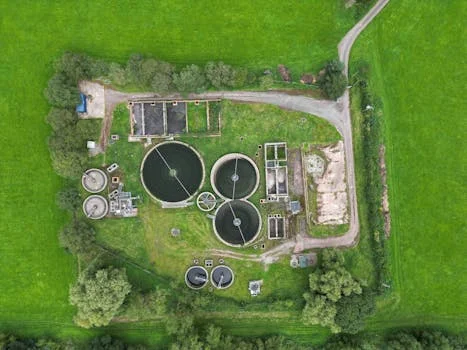
Regional labor, fabrication, and permit rules change etching wastewater project totals even when the process flowsheet looks identical on paper. In China, CAPEX is often 20–30% lower than Western bids because of labor and shop fabrication costs. GB 21900-2008 copper limits below 0.5 mg/L still force advanced pretreatment, which can raise overall project cost 15–25% versus looser permits. Permitting timelines of 6–12 months are common on established industrial sites.
In the United States, CAPEX usually runs 10–20% above China on wages, materials, and engineering fees. EPA 40 CFR Part 469 electroplating categorical rules are well documented, and copper recovery can simplify long-term compliance risk for metal-bearing streams. Permitting often takes 3–6 months for established categories when applications are complete and local utilities accept the proposed effluent quality.
What does an OPEX breakdown look like for European fabs?
European fab OPEX breakdowns sit higher than Chinese baselines mainly because of energy prices, labor rates, and documentation load under the Industrial Emissions Directive 2010/75/EU. EU CAPEX is often 30–50% above China for comparable hydraulic capacity. Incentives for ZLD and reuse in water-scarce regions such as Spain and Italy can cut effective OPEX by 20–40% over plant life through grants, tax relief, or water-tariff reductions. Full permitting commonly needs 12–24 months, which adds soft cost and schedule risk before first legal discharge.
Procurement teams comparing multinational plant budgets with EU fab bids should normalize currency year, include sludge tickets, and separate etch-bay metal recovery from sanitary or cooling-tower trains. Mixing those streams in one spreadsheet hides the copper-driven OPEX that actually decides whether recovery CAPEX pays back. Currency year alone can move apparent CAPEX by double-digit percentages on multi-year multinational rollouts.
Selection Checklist and Who This Guide Is For
Lock the process design only after the following items are measured or priced—not estimated from a brochure curve:
- Measure etch and rinse copper (mg/L) and daily flow (m³/day) on peak and average production days.
- Confirm the binding copper limit (mg/L) and whether reuse or ZLD is mandated by permit or corporate policy.
- Price hazardous vs non-hazardous sludge tickets ($/kg) with the current hauler and disposal site.
- Decide if copper recovery revenue at current LME bands offsets the added electrowinning CAPEX.
- Compare DAF plus recovery versus precipitation-only on 10-year OPEX, not installed CAPEX alone.
- Reserve MBR only after copper is below ~50 mg/L and organics are stable enough for biology.
- Hold ZLD for true zero-discharge mandates or extreme water-scarcity sites with reuse credits.
This guide is written for PCB, semiconductor, and metal-finishing engineers sizing treatment trains, EPC contractors building bid packages, and procurement managers comparing lifetime cost. Teams treating only sanitary wastewater or low-metal industrial streams should look elsewhere; the metal and pH assumptions here will oversize chemistry and sludge handling. For a site-specific budget built from your flow, copper, and discharge limit, request a treatment cost review with those three numbers attached.
Frequently Asked Questions
What is the most cost-effective system for a 50 m³/day PCB plant?
A DAF train paired with copper recovery is usually the most cost-effective package for a 50 m³/day PCB plant. Combined CAPEX often lands near $250,000 when scope stays on etch and rinse metals plus TSS. OPEX can be held near $0.30/m³ when dosing and dewatering are automated. Copper revenue plus lower hazardous sludge mass commonly supports payback around 18 months under mid-case metal prices and local disposal tariffs.
How much does sludge disposal cost for etching wastewater?
Hazardous etching sludge with copper above 2,500 mg/kg typically costs $0.10–$0.30/kg to dispose. Non-hazardous cake after effective copper recovery and dewatering often falls to $0.02–$0.10/kg (per EPA 2024 guidelines used in plant models). Volume reduction from a filter press matters as much as classification because haulage is billed by mass, not by metal grade alone.
Can MBR systems handle high copper concentrations?
MBR systems should not see high copper directly. Copper fouls membranes and inhibits biology, so pretreatment with DAF or chemical precipitation is used to bring copper below about 50 mg/L before the MBR. With that pretreatment, MBR can deliver TSS below 1 mg/L and COD below 30 mg/L for reuse or strict discharge. Skipping metal removal is the most common cause of early membrane failure on etch lines.
What are the hidden costs of ZLD systems?
Hidden ZLD costs are mostly energy, membrane renewals, and specialized labor. Energy for evaporation, crystallization, and RO typically runs $0.80–$2.50/m³. RO membrane replacement can add $0.20–$0.40/m³ on top of thermal energy. Staffing of 1–2 FTEs is common for complex ZLD plants, which raises labor well above automated DAF-only trains that run with part-time coverage.
How do I calculate payback for a copper recovery system?
Payback in months equals CAPEX divided by net monthly benefit from copper revenue plus disposal savings minus recovery OPEX. For 100 m³/day at 1,000 mg/L Cu, $500,000 CAPEX, $0.20/m³ OPEX, $3.50/kg copper, and $1.00/m³ disposal savings, net benefit is about $12,900/month and payback is roughly 38.8 months. Higher copper strength or metal price shortens that period quickly when recovery efficiency stays near 99.9%.